. 2025;21(5):778-786.
doi: 10.1038/s41567-025-02827-7. Epub 2025 Mar 14.

Single-fluorogen imaging reveals distinct environmental and structural features of biomolecular condensates

Affiliations

Single-fluorogen imaging reveals distinct environmental and structural features of biomolecular condensates

Tingting Wu et al. Nat Phys. 2025.

Abstract

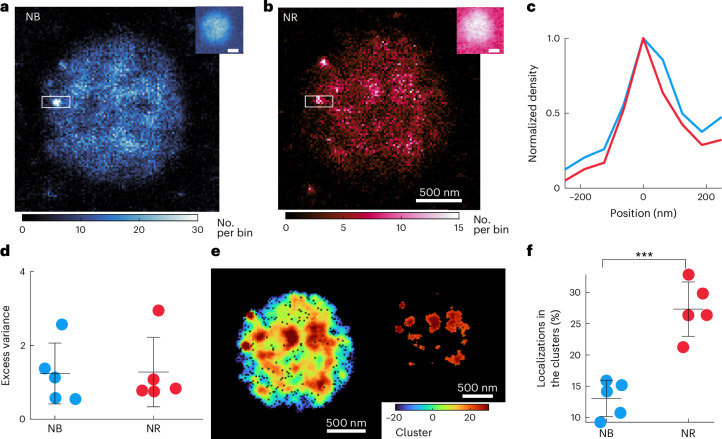
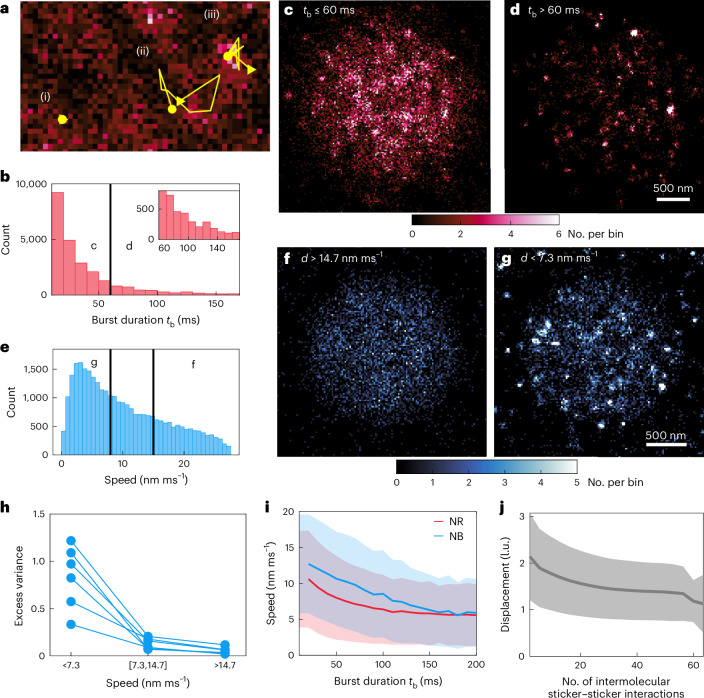
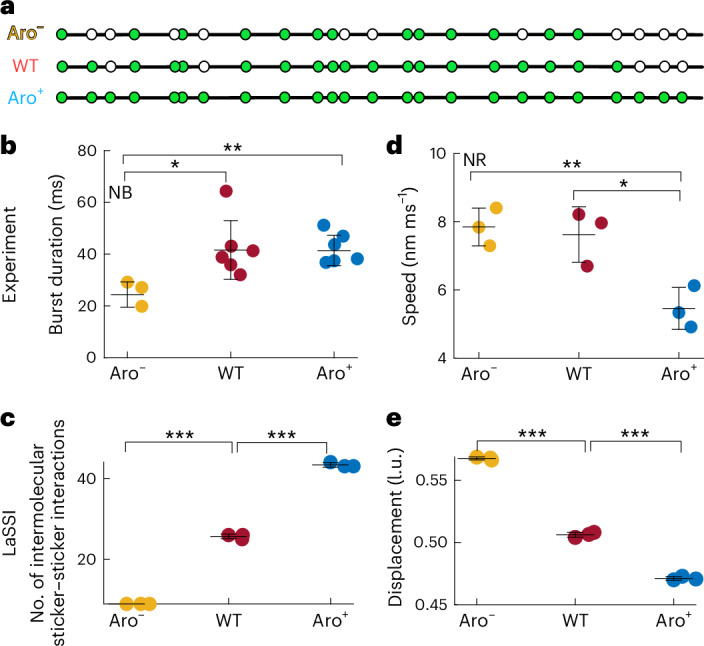
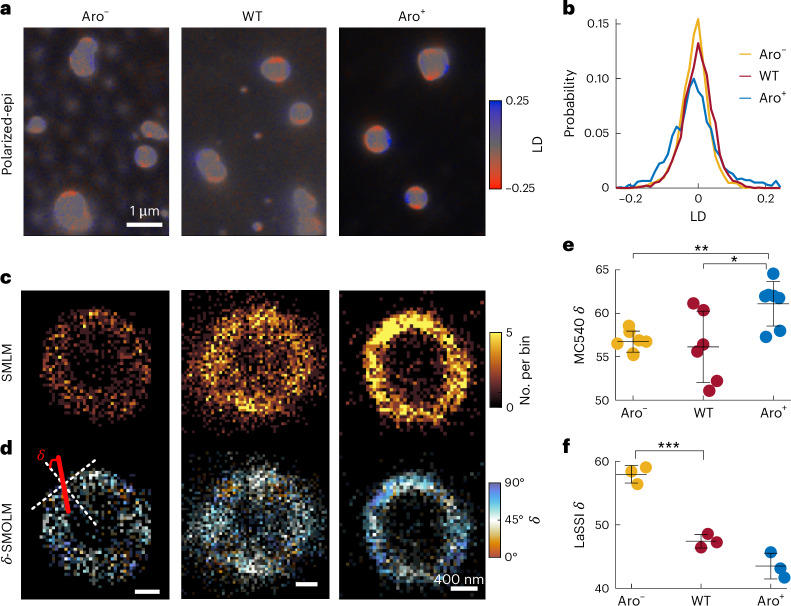
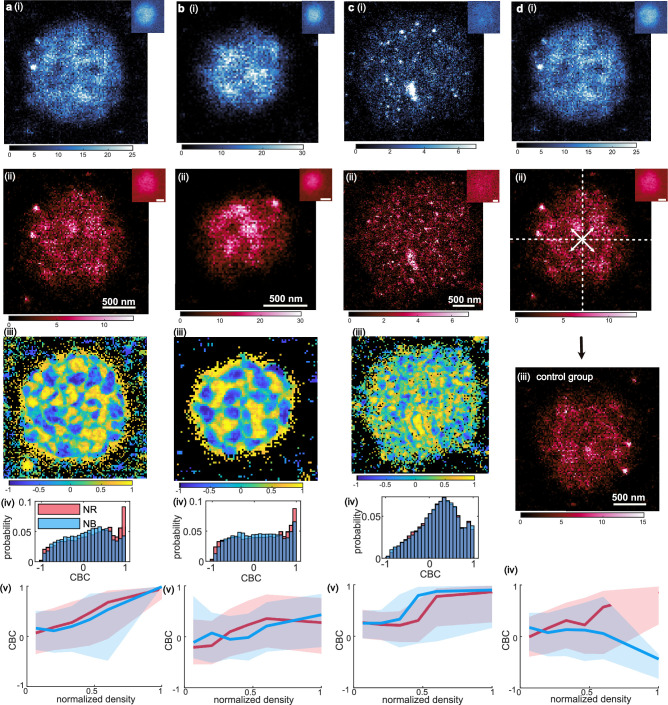
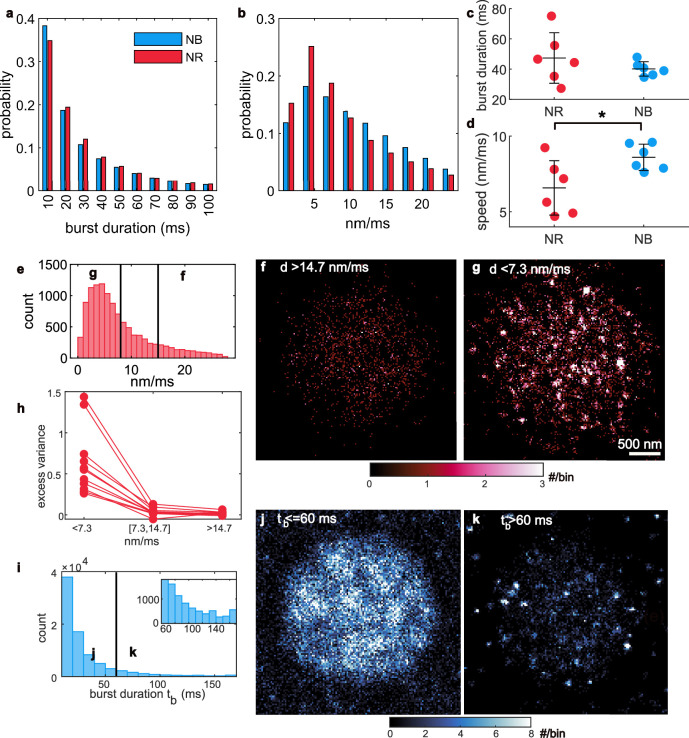
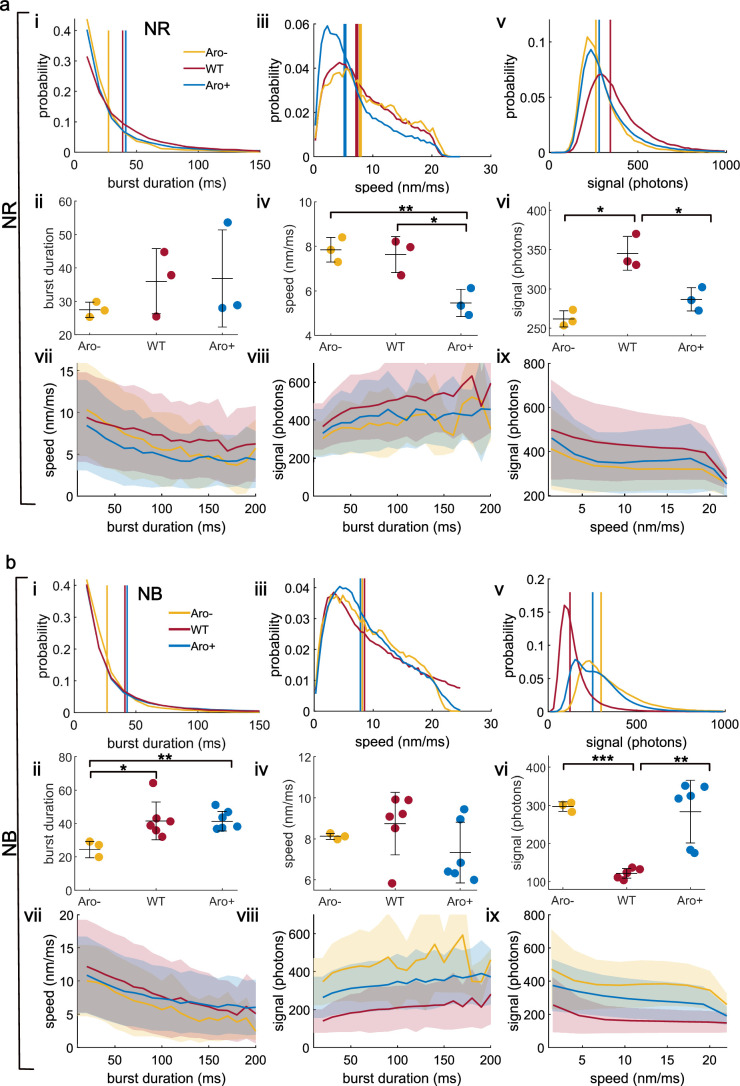
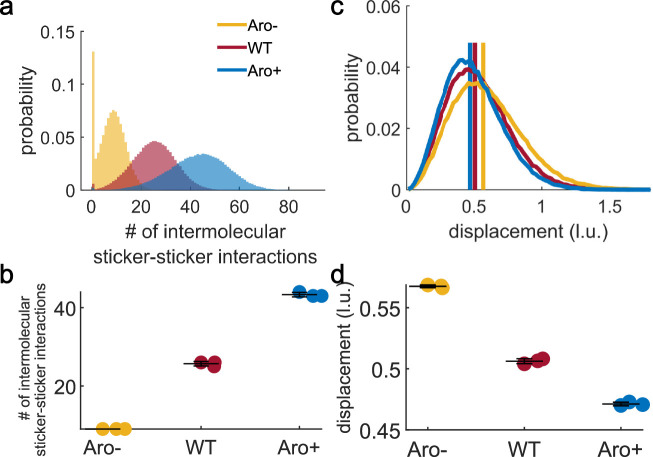
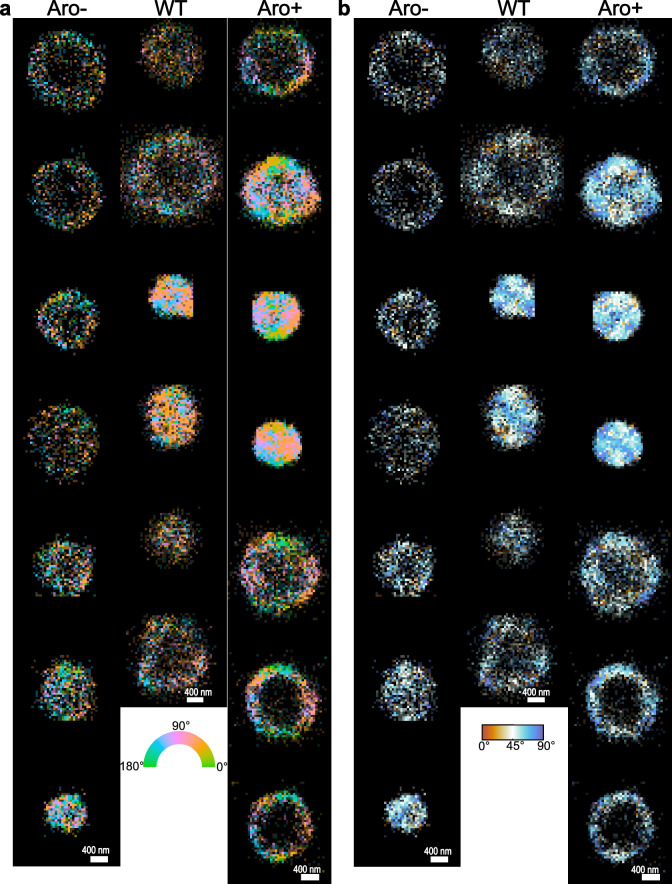
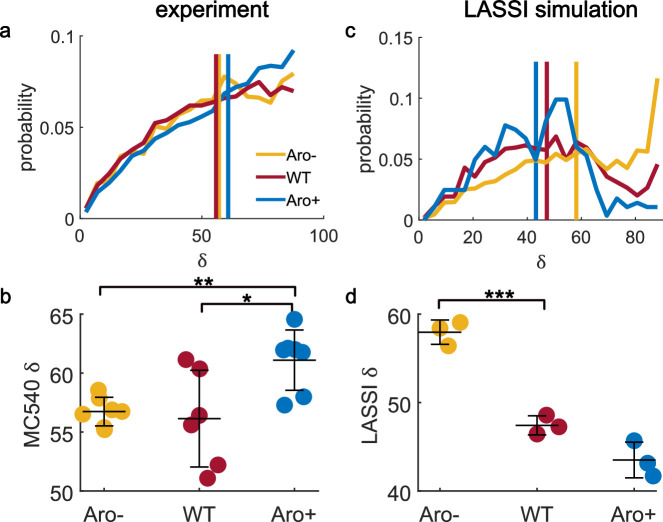
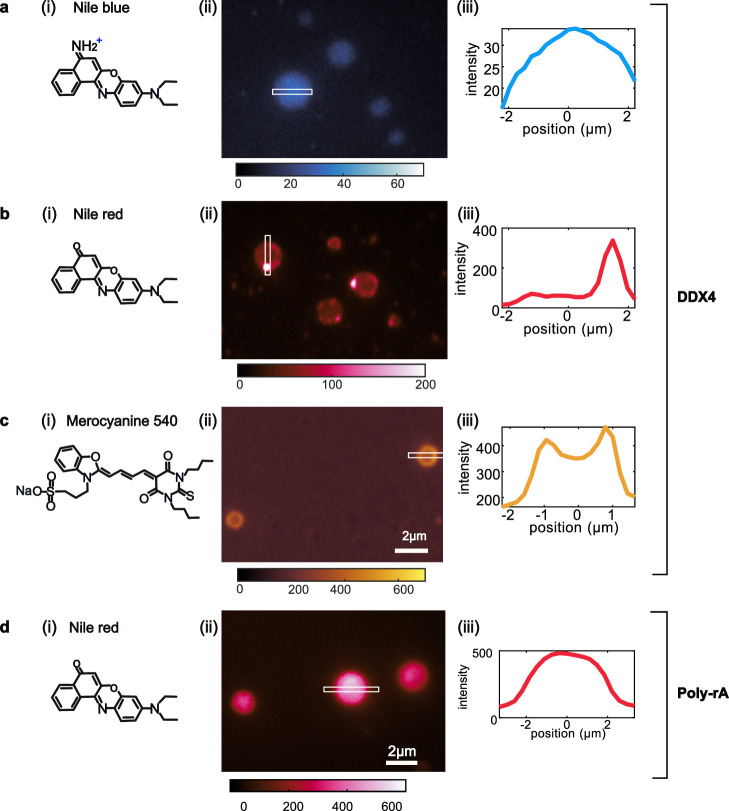
Biomolecular condensates are viscoelastic materials. Simulations predict that condensates formed by intrinsically disordered proteins are network fluids defined by spatially inhomogeneous organization of the underlying molecules. Here, we test these predictions and find that molecules within condensates are organized into slow-moving nanoscale clusters and fast-moving dispersed molecules. These results, obtained using single-fluorogen tracking and super-resolution imaging of different disordered protein-based condensates, affirm the predicted spatially inhomogeneous organization of molecules within condensates. We map the internal environments and interfaces of condensates using fluorogens that localize differently to the interiors versus interface between dilute phase and condensate. We show that nanoscale clusters within condensates are more hydrophobic than regions outside the clusters, and regions within condensates that lie outside clusters are more hydrophobic than coexisting dilute phases. Our findings provide a structural and dynamical basis for the viscoelasticity of condensates.

Keywords: Imaging and sensing; Nanoscale biophysics.


Conflict of interest statement

Competing interestsThe pixOL microscope used in this work was invented by T.W. and M.D.L. and is covered by US patent 11994470 B2 (2024), which was filed by and assigned to Washington University in St. Louis. R.V.P. is a member of the scientific advisory board of and a shareholder at Dewpoint Therapeutics Inc. The work reported here was not influenced by this affiliation. The remaining authors declare no competing interests.

Figures

Fig. 1
Fig. 1. Partitioning of fluorogenic probes into biomolecular condensates.
a, A1-LCD molecules, characterized by aromatic stickers (green) and non-aromatic spacers (white), form a network-like organization within condensates. As fluorogens (shown as black stars) diffuse through solution, they encounter different chemical environments in the dilute phase (white space outside), in the condensate (blue circle) and at the interface between the dilute phase and condensate (grey region). In response, they either remain dark ((i) and (iii)) (black stars) or become fluorescent ((ii) and (iv)) (red stars and curved arrows). Their ((ii), (iv)) speeds of movement and brightness are also affected. b, Chemical structures of the three different fluorogens used for imaging condensates: (i) NR, (ii) NB and (iii) MC540. c, Partition coefficients for NR and NB, measured for 37 condensates for NR for NB (grey circles) across two biological replicates. The median values are 6.5 and 40 for NR and NB, respectively. Shaded regions denote the probability density. d, Top, condensates formed by unlabelled A1-LCD molecules were imaged using differential interference contrast (DIC) microscopy. Bottom, NR partitions into A1-LCD condensates, and this fluorogen was imaged using point-scanning confocal microscopy (signal shown in the red channel). e, Line scan quantifications of partition coefficients of NR into A1-LCD condensates. f, Top, DIC images of A1-LCD condensates; bottom, confocal images showing the partitioning of NB into these condensates. g, Line scan quantifications of the partition coefficients of NB into A1-LCD condensates. For line scans e and g, five condensates across two biological replicates were used to derive median values (bold line) and the 95% confidence interval (shaded region).
Fig. 2
Fig. 2. NB and NR bind to nanoscale clusters within condensates.
a,b, SMLM images of a single A1-LCD condensate collected using NB (a) and NR (b). Insets, epifluorescence images. Scale bar 5 µm. Colour bars, number of single-molecule localizations within each 10-nm × 20-nm bin (white box). c, Localization line profile along the long axis of the white boxes in a and b. d, Quantifying the binding and activation of NB (blue) and NR (red) within five condensates using excess variance. Larger excess variance values represent greater heterogeneities in the blinking statistics of fluorogenic probes within a condensate; zero excess variance represents uniform blinking statistics throughout the condensate. e, A1-LCD condensate in b imaged by NR and colour-coded by clustering coefficient; molecules with clustering coefficients above a threshold of 20 are classified as being clustered. Inset, map of regions that contain clustered NR localizations. f, Percentages of single-molecule localizations that are spatially clustered for five condensates (P = 4.9 × 10−4). For excess variance and localization clustering calculations (d and f), five condensates across two biological replicates were used to derive mean (centre line) ± s.d. (error bars). ***P < 10−3. All P values were calculated using Welch’s unequal variances t-test (two-sided).
Fig. 3
Fig. 3. Single-fluorogen tracking uncovers inhomogeneous molecular organization and dynamics.
a, Trajectories (yellow lines) connecting single NR localizations (yellow dots) exhibit both short (i) and long ((ii) and (iii)) burst durations, as well as high (ii) and low (iii) speeds. b, Burst duration tb of each NR trajectory. The inset shows a zoom into the tail of the burst duration distribution. c,d, SMLM images of NR molecules with burst durations shorter than 60 ms (c) and longer than 60 ms (d) (partition shown as black line in b). Extended Data Fig. 5j,k shows burst duration data for NB. e, Speed distribution of NB measured between consecutive camera frames (10-ms exposure time). f,g, SMLM images of NB molecules with speeds larger than 14.7 nm ms−1 (f) and smaller than 7.3 nm ms−1 (g) (partitions shown as black lines in e). Extended Data Fig. 5e–g shows speed data for NR. h, Excess variance of NB localizations grouped by speeds (left, <7.3 nm ms−1; middle, between 7.3 and 14.7 nm ms−1; right, >14.7 nm ms−1). Blue lines, excess variance of NB within each condensate. i, Speeds of NB (blue) and NR (red) as a function of their fluorescence burst durations. Lines, mean value averaged over 1.5 × 105 trajectories for NB and 129,000 trajectories for NR; shaded region, ±1 s.d. Six condensates were imaged across two biological replicates. j, Displacement in lattice units (l.u.) of each chain within a simulated A1-LCD condensate as a function of the number of intermolecular sticker–sticker interactions. Mean (line) ± s.d. (shaded region) shown. Results are from lattice-based Monte Carlo simulations (three independent simulations per condensate type).
Fig. 4
Fig. 4. Nanoscale dynamics within condensates are influenced by the numbers of aromatic residues.
a, Schematic showing the positions of aromatic amino acids as green circles in Aro, A1-LCD (wild type, WT) and Aro+ variants. White circles denote non-aromatic spacers that are replaced by aromatic residues in Aro+. Black lines represent all non-aromatic residues. b, Fluorescence burst durations for the three condensates measured using NB. PAro−,WT = 0.016, PAro−,Aro+ = 0.0063. Extended Data Fig. 6a(ii) shows burst duration data for NR. c, Number of intermolecular sticker–sticker interactions in simulated condensates. The sequence-specific simulations were performed using the LaSSI engine. PAro-,WT = 4.0 × 10−4, PWT,Aro+ = 3.0 × 10−6. d, Speed of NR within condensates formed by Aro, WT and Aro+. PAro-,Aro+ = 0.0078, PWT,Aro+ = 0.024. Extended Data Fig. 6b(iv) shows speed data for NB. e, Displacements of protein chains quantified in simulated condensates. Circles in b represent the average burst durations of individual condensates; in d,e they represent the median values of measurement parameters for individual condensates. PAro-,WT = 1.3 × 10−5, PWT,Aro+ = 3.6 × 10−5. For NB imaging, three Aro (30,300 ± 11,800 (mean ± s.d.) localizations each), six WT (60,400 ± 22,600 localizations each) and six Aro+ (106,000 ± 53,200 localizations each) condensates across two biological replicates were used to derive mean (centre lines) ± s.d. (error bars). For NR imaging, three Aro (12,100 ± 3,140 localizations each), three WT (40,400 ± 12,300 localizations each) and three Aro+ (49,300 ± 19,500 localizations each) condensates (technical replicates). *P < 0.05, **P < 0.01, ***P < 10−3. All P values were calculated using Welch’s unequal variances t-test (two-sided).
Fig. 5
Fig. 5. MC540 displays distinct orientations at interfaces, influenced by the numbers of aromatic residues.
a, Colour-coded linear dichroism (LD) of MC540 within Aro, A1-LCD (WT) and Aro+ variants, measured by polarized epifluorescence imaging. b, Linear dichroism distributions quantified from images shown in a. Yellow, Aro; red, WT; blue, Aro+. c, SMLM images of MC540. d, Orientation angles δ for MC540 measured with respect to the normal vector to the condensate interface using SMOLM; the median angle δ is depicted within each 50-nm × 50-nm bin. e, Median δ values computed across individual condensates (circles). Here, seven Aro (520 ± 75 (mean ± s.d.) localizations each), six WT (1,310 ± 703 localizations each) and seven Aro+ (2,170 ± 943 localizations each) condensates across three biological replicates were used to derive mean (centre lines) ± s.d. (error bars). PAro−,Aro+ = 00.31. f, δ values computed from LaSSI simulations using orientations of protein molecules at the interface (three independent simulations per condensate type). PAro−,WT = 6.36 × 10−4. *P < 0.05, **P < 0.01, ***P < 10−3. All P values were calculated using Welch’s unequal variances t-test (two-sided).
Fig. 6
Fig. 6. Schematic summarizing the structural features of condensates that were inferred from the fluorogenic experiments.
Condensates are, on average, more hydrophobic than their coexisting dilute phases. They feature spatial inhomogeneities that are manifest as nanoscale hubs (red regions). Hubs are more hydrophobic compared to other regions (blue) within condensates, as well as to the dilute phase (white area). Fluorogens bound to nanoscale hubs move more slowly compared to other regions. Proteins at the interface (orange) have distinct orientational preferences that are unmasked by specific fluorogens such as MC540.
Extended Data Fig. 1
Extended Data Fig. 1. Calibration of the Nile red (NR) dye in homogeneous solutions.
a: The intensity of NR at different concentrations dissolved in an aqueous buffer comprising 20 mM HEPES with 300 mM NaCl. This buffer is identical to the one used for preparing A1-LCD condensates. Images were captured with the microscope focused on the coverslip. Note that the intensity increases with NR concentration. b: Intensity of NR at different concentrations dissolved in dimethyl sulfoxide (DMSO). Images were captured on the coverslip. The intensity increases with NR concentration. Comparing panels in a to panels in b, we see that at equivalent concentrations of NR, the intensities in DMSO are at least three orders of magnitude higher than in aqueous buffers. c: In aqueous buffers, molecules of NR form aggregates at or above concentrations of 652 µM. This image is captured above the coverslip. The morphologies of NR aggregates are different from the hubs we observed in condensates. d: and e: There is a linear correspondence between brightness, quantified in terms of the number of photons collected, and the concentration of fluorogens we use, both in aqueous buffers (d) and in DMSO (e). f: Fluorescence intensity of 56 µm NR solutions in different solvents. These measurements highlight the increased brightness of the solvatochromic NR as the hydrophobicity of the solvent increases. Calibration of the increase in fluorescence intensities is provided by the color bar. g: The data in (f) are summarized by plotting the average intensities of the images. h: The emission spectrum of NR in three different solvents. The emission spectrum of NR in the aqueous buffer is scaled by a factor of 300 for better visualization. The emission spectrum of NR is blue-shifted as the hydrophobicity of the solvent increases. i: The dielectric constant of 100% DMSO is 46.7 and that of aqueous solutions is ~78 at 296 K. At high concentrations of NR (652 µM), we quantified the fluorescence intensity as a function of % DMSO. These measurements show that the aggregates present in aqueous buffers (0% DMSO) are absent even in the presence of 10% DMSO. As the % of DMSO increases, the NR intensity increases by 2–4 orders of magnitude, thus highlighting the fluorogenic nature of NR. The experiments were conducted more than three times to ensure repeatability.
Extended Data Fig. 2
Extended Data Fig. 2. Quantifying the effects of different fluorogens on the driving forces for phase separation.
Driving forces were quantified by measuring saturation concentrations (csat) of A1-LCD molecules in the presence of different amounts of the different fluorogens used in this work. Within the error of the measurements, we find that adding Nile red (NR), Nile blue (NB), and merocyanine 540 (MC540) at different concentrations have minimal effects on the measured values of csat. This inference is made based on comparisons to measurements made in the absence of dyes (black circles). All measurements were performed using a starting concentration of 150 µM A1-LCD in 20 mM HEPES buffer and 300 mM NaCl at (a) 4 °C and (b) 23 °C. Prepared protein and dye mixtures were allowed to phase separate for 30 minutes at the indicated temperatures before the dilute phase was separated from the dense phase via centrifugation and protein concentration measured using absorbance at 280 nm. Each set of samples was prepared in triplicate and measured independently; each triplicate measurement is shown as individual filled circles.
Extended Data Fig. 3
Extended Data Fig. 3. Dynamic wetting of the glass coverslip by A1-LCD condensates.
The images were captured using (a) NB, (b) NR, and (c) MC540. Colorbars: intensity (a.u.). The experiments were conducted more than three times to ensure repeatability.
Extended Data Fig. 4
Extended Data Fig. 4. Spatial inhomogeneities within A1-LCD condensates imaged by NB and NR are highly correlated.
a, b, and c: Correlation between NB and NR measured for three different A1-LCD condensates. SMLM images of single condensates collected using (i) NB and (ii) NR. Insets: epifluorescence images. Color bars: number of single molecules within each 20 nm × 20 nm bin. (iii) Coordinate-based correlation (CBC) between NR and NB localizations averaged for localizations within each 20 nm × 20 nm bin. (iv) Distribution of CBC scores for (blue) NB and (red) NR. (v) CBC of NB (blue) and NR (red) plotted as a function of localization density. Solid lines: median value; shaded area: 25th-75th percentile. d: A condensate measured using (i) NB and (ii) NR as shown in a. We swapped emitters in the four regions of (ii) to form (iii) a modified NR condensate that should have weak correlations with the original condensate in a. (iv) CBC values between (i) NB localizations and (iii) the modified NR localizations.
Extended Data Fig. 5
Extended Data Fig. 5. Tracking single-molecule fluorescence bursts and speeds reveal inhomogeneous molecular distributions within A1-LCD condensates.
a, b: Distribution of (a) burst durations and (b) speeds for NB (blue) and NR (red). c: Mean burst duration for individual condensates. d: Median speed for fluorogens within individual condensates (p=0.041). * denotes p value < 0.05. All p values were calculated using Welch’s unequal variances t-test (two-sided). Single-molecule tracking of (e-h) NR and (i-k) NB. e: NR speeds measured between consecutive camera frames (10 ms exposure time). f, g: SMLM images of NR with speeds (f) larger than 14.7 nm/ms and (g) shorter than 7.3 nm/ms. h: Excess variance of NR localizations grouped by speed (left: ≤ 7.3 nm/ms, middle: between 7.3/ms and 14.7 nm/ms, right: >14.7 nm/ms). Lines: excess variance of molecules within each condensate. i: Fluorescence burst durations tb of NB. j, k: SMLM images of fluorogens (NB) with burst durations (j) shorter than 60 ms and (k) longer than 60 ms. Six condensates (18,300 ± 7,120 [mean ± SD] localizations each for NR, 49,300 ± 3,310 localizations each for NB) across two biological replicates were used to derive mean (center line) +/− SD (error bars).
Extended Data Fig. 6
Extended Data Fig. 6. Speeds and burst durations of NR and NB molecules within Aro, WT, and Aro+ condensates.
a, b: Measurements of (a) NR and (b) NB for three different LCDs. i, Distribution of burst duration. Vertical lines: mean burst durations. Yellow, Aro-; red, WT; blue, Aro+. ii, Mean burst duration for individual condensates. pNB,Aro,WT=0.016,pNB,Aro,Aro+=0.0063. iii, Distribution of speed. Vertical lines: median speeds. iv, Median speed for individual condensates. pNR,Aro,Aro+=0.0078,pNR,WT,Aro+=0.024. v, Distribution of signal photons. Vertical lines: median signals. vi, Median signal of SMs in individual condensates. pNR,Aro,WT=0.011,pNR,WT,Aro+=0.023,pNB,Aro,WT =3.0×10⁵,pNB,WT,Aro+=0.004. vii, Speeds of SMs as a function of their burst durations. viii, Signal photons of SMs as a function of their burst durations. ix, Signal photons as a function of their speed. Shaded region: ±1 standard deviation. For NR imaging, 3 Aro (12,100 ± 3,140 [mean ± SD] localizations each), 3 WT (40,400 ± 12,300 localizations each), and 3 Aro+ (49,300 ± 19,500 localizations each) condensates (technical replicates) were used to derive mean (center line) +/− SD (error bars). For NB imaging, 3 Aro (30,300 ± 11,800 localizations each), 6 WT (60,400 ± 22,600 localizations each), and 6 Aro+ (106,000 ± 53,200 localizations each) condensates across two biological replicates were used. * denotes p values < 0.05, ** denotes p values < 0.01, and *** denotes p values < 10−3. All p values were calculated using Welch’s unequal variances t-test (two-sided).
Extended Data Fig. 7
Extended Data Fig. 7. LaSSI simulations of condensates formed by Aro, WT, and Aro+.
a: Distribution of the number of sticker-sticker interactions. Yellow, Aro-; red, WT; blue, Aro+. b: The median number of sticker-sticker interactions within individual condensates (reproduced from Fig. 4c). c: Distribution of displacement of protein chains. Vertical lines are the median displacements in lattice units (l.u). d: The median displacement of protein chains (reproduced from Fig. 4e). Mean (center line) ± 1 standard deviation (error bars) shown. Three independent simulations were performed for each of the three variants.
Extended Data Fig. 8
Extended Data Fig. 8. Single-molecule orientation-localization microscopy (SMOLM) of Aro-, WT, Aro+ condensates.
a: Single-molecule orientation image with colors representing the measured azimuthal angles φ in the xy-plane. b: Single-molecule orientation image with colors representing the orientation angle δ measured with respect to the normal vector to the condensate interface; the median angle δ is depicted within each 50 nm × 50 nm bin. The images are reconstructed from localizations of freely diffusing MC540.
Extended Data Fig. 9
Extended Data Fig. 9. Orientation of MC540 measured by SMOLM and orientation of protein chains quantified in LaSSI simulations of different condensates.
a: Distribution of the orientation angle δ for MC540 measured with respect to the normal vector to the condensate interface using SMOLM. Vertical lines: median value of orientation δ. Yellow, Aro-; red, WT; blue, Aro+. b: Median δ values computed across individual condensates (circles, reproduced from Fig. 5e). Here, 7 Aro (520 ± 75 [mean ± SD] localizations each), 6 WT (1,310 ± 703 localizations each), and 7 Aro+ (2,170 ± 943 localizations each) condensates across three biological replicates were used to derive mean (center lines) +/− SD (error bars). pAro,Aro+=0.0031,pWT,Aro+=0.033. c: Distribution of orientation δ of protein chains in LaSSI simulations. Vertical lines: median orientation δ. d: δ values computed from LaSSI simulations using orientations of protein molecules at the interface (3 independent simulations per condensate type, reproduced from Fig. 5f). pAro,WT=6.36×10⁴. * denotes p values < 0.05, ** denotes p values < 0.01, and *** denotes p values < 10−3. All p values were calculated using Welch’s unequal variances t-test (two-sided).
Extended Data Fig. 10
Extended Data Fig. 10. Epifluorescence microscopy reveals that different fluorogenic probes sense chemical environments inside DDX4-IDR condensates from different perspectives.
Imaging DDX4-IDR condensates using a. Nile blue (NB), b. Nile red (NR), and c. merocyanine 540 (MC540). (i) Chemical structures. (ii) Typical condensates as viewed by epifluorescence microscopy. (iii) Fluorescence intensity profiles along the long axis of white box shown in (ii). d. Imaging poly-rA condensates using NR. The experiments were conducted more than three times to ensure repeatability.

Update of

Similar articles

Cited by

References

    1. Banani, S. F., Lee, H. O., Hyman, A. A. & Rosen, M. K. Biomolecular condensates: organizers of cellular biochemistry. Nat. Rev. Mol. Cell Biol.18, 285–298 (2017). - PMC - PubMed
    1. Bremer, A. et al. Deciphering how naturally occurring sequence features impact the phase behaviours of disordered prion-like domains. Nat. Chem.14, 196–207 (2022). - PMC - PubMed
    1. Nott, T. J. et al. Phase transition of a disordered nuage protein generates environmentally responsive membraneless organelles. Mol. Cell57, 936–947 (2015). - PMC - PubMed
    1. Jawerth, L. et al. Protein condensates as aging Maxwell fluids. Science370, 1317–1323 (2020). - PubMed
    1. Ghosh, A., Kota, D. & Zhou, H.-X. Shear relaxation governs fusion dynamics of biomolecular condensates. Nat. Commun.12, 5995 (2021). - PMC - PubMed

LinkOut - more resources