. 2025 Aug;12(29):e05723.
doi: 10.1002/advs.202505723. Epub 2025 May 19.

UTX Responds to Nanotopography to Suppress Macrophage Inflammatory Response by Remodeling H3K27me3 Modification

Affiliations

UTX Responds to Nanotopography to Suppress Macrophage Inflammatory Response by Remodeling H3K27me3 Modification

Hengji Jia et al. Adv Sci (Weinh). 2025 Aug.

Abstract

Peri-implantitis is the leading cause of implant failure, primarily due to weak defense at the implant-soft tissue interface, which disrupts the local immune microenvironment. As an integral part of this microenvironment, the implant-tissue interface plays a critical role in shaping immune cell function. Thus, engineering the surface topography of implants has emerged as a novel strategy for sustained immunomodulation following implantation. This study investigated the mechanical regulation of macrophage function by nanopatterned topographies. Titanium nanotubes (TNTs) surfaces reduce the expression of phosphorylated myosin light chain (pMLC) and promote the retention of the UTX histone methyltransferase in the nucleus. This process attenuates the enrichment of the repressive H3K27me3 histone marker at the Abca1 gene locus, increasing Abca1 expression and suppressing inflammation. This study reveals the mechanosensitivity of UTX and provides a new target for the development of therapeutic strategies that integrate mechanical signaling and immune modulation.

Keywords: histone methylation; macropahge; mechano‐immunology; nanotopography.


Conflict of interest statement

The authors declare no conflict of interest.

Figures
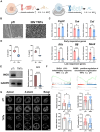
Figure 1
Figure 1
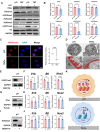
Titanium nanotubes inhibit the macrophage inflammatory response concomitant with a reduction in chromatin condensation. A) Diagrammatic illustration of nanotube‐mediated modulation of macrophage inflammatory activation, which correlates with a decrease in chromatin condensation. B) Scanning electron micrographs characterizing topographical variations among titanium substrates; scale bar: 1 µm. C) Comparative transcriptional profiling of proinflammatory mediators (immediate‐early and delayed‐response genes) in LPS‐stimulated macrophages adherent to titanium or nanotubes after 6 h of exposure. D,E) Relative secretion of the IL‐1β and IL‐6 late inflammatory factors (D) and relative protein expression of iNOS (E) in cells seeded on different titanium surfaces and treated with LPS for more than 6 h. F) GSEA showing significant differences in the enrichment of “LPS‐inflammatory response” and “positive regulation of chromatin organization” genes in cells seeded on different titanium surfaces and treated with LPS for more than 6 h. G) Representative images of nuclei from cells seeded on different titanium surfaces exposed to LPS, along with computational quantification of morphometric parameters, including nuclear planar spread, nuclear volumetric dimensions, sphericity indices, and the chromatin condensation index. These datasets were systematically acquired through analysis of 60–80 individual nuclei sampled across ≥20–30 randomized microscopic fields; scale bar: 2 µm. Other experimental measurements were calculated as the arithmetic mean derived from triplicate independent experimental replicates. All numerical outcomes are presented as the means ± standard deviations. Statistical significance thresholds were defined as *p < 0.05, **p < 0.01, and ***p < 0.001.
Figure 2
Figure 2
TNTs suppress inflammatory gene expression by reducing H3K27me3 levels. A,B) Expression and quantitative analysis of H3K27me3, H3K9me3, H3ac, H3K27ac, H3K4me3, and H3K36me3 in cells seeded on different titanium surfaces. C) Representative images and quantitative analysis of H3K27me3 protein levels in cells seeded on different titanium surfaces; scale bar: 5 µm. D) Representative transmission electron microscopy (TEM) images of heterochromatin in cells seeded on different titanium surfaces and treated with LPS for more than 6 h, with red areas indicating heterochromatin. E,G,I) Cells cultured on pTi were pretreated for 18 h with GSK‐126 (10 µM), PU139 (30 µM), BRD4770 (5 µM), or DMSO, followed by 6 h of LPS stimulation, and the relative protein expression levels of H3K27me3, H3K9me3, and H3ac were determined. F,H,J) Relative expression levels of inflammatory genes in macrophages on pTi after LPS stimulation with inhibitors or DMSO. (K) Schematic illustrating the impact of H3K27me3 on the transcription of inflammatory genes in cells seeded on different titanium surfaces. All numerical outcomes are presented as the means ± standard deviations. Statistical significance thresholds were defined as *p < 0.05, **p < 0.01, and ***p < 0.001.
Figure 3
Figure 3
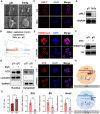
TNTs suppress H3K27me3 levels and inflammatory gene expression by promoting UTX nuclear translocation. A) Relative mRNA expression of Utx, Jmjd3, and Ezh2 in cells seeded on different titanium surfaces and treated with LPS for more than 6 h. B) Relative protein expression of UTX and EZH2 in cells seeded on different titanium surfaces. C) Images of UTX (red) in cells seeded on different titanium surfaces and treated with LPS. Scale bar: 5 µm. The numerical statistical results of UTX were obtained from ≈10 cells selected from three independent samples. D) Representative Western blot images of UTX in the cytoplasm and nucleus of cells on pTi and TNTs after treatment with LPS. GAPDH served as an internal reference for cytoplasmic proteins, whereas LaminB1 served as an internal reference for nuclear proteins. E,F) After LPS treatment, the cells seeded on the nanotubes were also treated with GSK‐J4 (5 µM for 24 h) and si‐UTX (36 h) to assess the relative protein levels of H3K27me3 and the relative expression levels of inflammatory genes. G) Schematic illustrating the impact of UTX nuclear‐cytoplasmic localization on H3K27me3 in cells seeded on different titanium surfaces. All numerical outcomes are presented as the means ± standard deviations. Statistical significance thresholds were defined as *p < 0.05, **p < 0.01, and ***p < 0.001.
Figure 4
Figure 4
TNTs regulate UTX nuclear translocation by modulating actomyosin contractility. A) Cell morphology of macrophages treated with LPS and cultured on pTi and TNTs; scale bar as indicated in the figure. B) GSEA shows significant differences in the enrichment of “regulation of actin cytoskeleton” genes in cells adhered to different surfaces and treated with LPS. C,D) Representative images (C) and relative protein expression (D) of UTX (red) in cells adhered to different surfaces and treated with LPS; scale bar: 5 µm. E,F) Representative images (E) and relative protein expression (F) of H3K27me3 (red) in cells seeded on pure titanium and treated with or without blebbistatin for 1 h, followed by treatment with LPS for 6 h; scale bar: 5 µm. G–I) Relative protein levels, quantitative analysis, and representative images of cytoplasmic and nuclear UTX (G) in macrophages cultured on pTi and treated with or without blebbistatin for 1 h, followed by treatment with LPS for 6 h.; scale bar: 5 µm. GAPDH served as a loading control for cytoplasmic proteins, whereas LaminB1 was used as a loading control for nuclear proteins. J) Relative expression levels of inflammatory genes in cells adhered to pure titanium after LPS treatment with or without blebbistatin pretreatment. K) Schematic illustrating the effect of pMLC on the nuclear‒cytoplasmic localization of UTX in macrophages adhered to different surfaces. All numerical outcomes are presented as the means ± standard deviations. Statistical significance thresholds were defined as *p < 0.05, **p < 0.01, and ***p < 0.001.
Figure 5
Figure 5
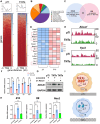
A reduction in H3K27me3 inhibits macrophage inflammation by upregulating ABCA1. A) Heatmap showing the genomic occupancy of H3K27me3 ±3 kb flanking TSSs in cells adhered to different surfaces after LPS stimulation, with genes displayed in descending order of signal intensity. B) Pie chart illustrating the distribution of H3K27me3 in annotated genomic regions across different titanium surfaces. C) Venn diagram showing the intersection of genes with downregulated H3K27me3 enrichment in CUT&Tag and upregulated genes identified via RNA‐seq in cells on TNTs. D) Among the 42 intersecting genes, the top 15 genes with differential expression levels are listed. E) Visualization of peak profiles for the Abca1 and Fpr2 genes. F) Relative mRNA expression of Abca1, Fpr2, Id1, and Trib1 in cells adhered to different surfaces after LPS exposure. G) Relative protein expression levels of ABCA1 in cells adhered to different surfaces after LPS stimulation and exposure to si‐Control or si‐Abca1. H) Relative inflammatory gene expression in cells adhered to nanotubes after LPS stimulation and treatment with si‐Control, si‐Abca1, or si‐Fpr2. I) Schematic illustrating the impact of H3K27me3 on Abca1 transcription and protein levels in cells adhered to different surfaces. All numerical outcomes are presented as the means ± standard deviations. Statistical significance thresholds were defined as *p < 0.05, **p < 0.01, and ***p < 0.001.
Figure 6
Figure 6
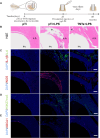
TNTs modification of implant surfaces alleviates peri‐implantitis. A) Schematic illustrating the construction of a rat peri‐implantitis model. B) Representative images of H&E staining of peri‐implant bone tissue. C–E) Representative immunofluorescence images of IL‐1β, IL‐6, iNOS, H3K27me3 and ABCA1 in peri‐implant bone tissues (im., implant; n.b., new bone; in., inflammatory; f.l., fibrous layer). Scale bar: 100 µm, n = 5.
Figure 7
Figure 7
Schematic representation of how titanium nanotubes modulate macrophage H3K27me3‐mediated inflammatory responses through the nucleoplasmic localization of UTX. Compared with those on the pTi surface, macrophages on the TNTs surface present reduced myosin II contractility, which facilitates the nuclear translocation of the UTX. This reduction decreases the enrichment of the repressive H3K27me3 histone modification at the Abca1 gene locus, which promotes the transcription and protein expression of ABCA1, thereby inhibiting the transcription of late inflammatory genes.

Similar articles

References

    1. Roccuzzo A., Imber J. C., Salvi G. E., Roccuzzo M., Periodontol 2000 2023, 92, 350. - PubMed
    1. Darby I., Periodontol 2000 2022, 90, 9. - PMC - PubMed
    1. Zhang H., Yuan Y., Xue H., Yu R., Jin X., Wu X., Huang H., J. Nanobiotechnol. 2023, 21, 485. - PMC - PubMed
    1. Wang Y., Liu Y., Chen J., Ge Z., Wang J., Li D., J. Control Release 2024, 378, 390. - PubMed
    1. Jin S., Yu Y., Zhang T., Xie D., Zheng Y., Wang C., Liu Y., Xia D., Bioact. Mater. 2024, 42, 404. - PMC - PubMed

LinkOut - more resources