. 2025 Jun 26;31(36):e202501158.
doi: 10.1002/chem.202501158. Epub 2025 Jun 9.

A Ketol-Acid Reductoisomerase Inhibitor That Has Antituberculosis and Herbicidal Activity

Affiliations

A Ketol-Acid Reductoisomerase Inhibitor That Has Antituberculosis and Herbicidal Activity

Xin Lin et al. Chemistry. .

Abstract

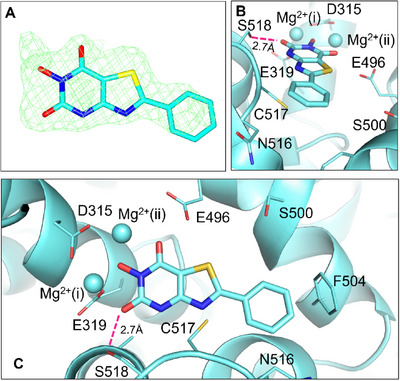
Ketol-acid reductoisomerase (KARI) is a target for the development of new biocidal agents. This is based on its essential role in branched chain amino acid biosynthesis in plants and microorganisms, and its absence in animals. The lack of success in developing KARI inhibitors as biocides may be because the inhibitors assessed to date compete directly with the substrate, 2-acetolactate (AL). As a result, effectiveness diminishes when AL accumulates in cells. Furthermore, as these inhibitors are slow binding, an organism could avoid growth slowdown by increasing KARI production. Here, we show a pyrimidinedione, 1f is a competitive but time-dependent inhibitor of AL and NADPH for Mycobacterium tuberculosis (Mt) KARI (Ki = 23.3 nM). A crystal structure of this compound bound to the MtKARI homolog from Staphylococcus aureus (Sa), SaKARI, illustrates this dual competition. In contrast, for Oryza sativa KARI, no time-dependent inhibition by 1f is observed, though it inhibits AL competitively (146 nM) and NADPH uncompetitively. Despite differences in inhibition properties, 1f has an MIC of 12.7 µm for MtH37Rv and inhibits Brassica campestris growth by 63% at 10 mg mL-1. Therefore, KARI inhibitors that are competitive for NADPH and show no time-dependent inhibition have excellent potential as biocides.

Keywords: Ketol‐acid reductoisomerase; crystal structure; drug discovery; herbicide discovery; inhibitor.


Conflict of interest statement

The authors declare no conflict of interest.

Figures

Figure 1
Figure 1
The reaction catalyzed by KARI and known inhibitors of KARI. A) The isomeroreductase reaction. The isomerization reaction has a strict requirement for Mg2+. The second step involves the reduction of HMKB or HMKP by NAD(P)H to produce DHIV or DHMV, respectively. B) The structures of four KARI inhibitors, IpOHA, Hoe704, CPD and NSC116565 (1b in this study).
Figure 2
Figure 2
Structures of 1b and derivatives. (2i) was not synthesized for this study.
Figure 3
Figure 3
Time‐course of inhibition and k obs versus inhibitor concentration plots for MtKARI and CjKARI. A) Inhibition of MtKARI by 1b.[ 30 ] 1b concentrations in each reaction ranged from 40 µm (red curve) to 0 µM (blue curve) by x2 serial dilution. B) Inhibition of CjKARI by 1b. 1b concentrations in each reaction ranged from 12.8 µm (red curve) to 0 µM (blue curve) by x2 serial dilution. C) Inhibition of MtKARI by 1f. Although it has stronger inhibition than 1b, 1f is still a slow‐binding inhibitor of MtKARI. 1f concentrations in each reaction ranged from 50 µm (red curve) to 0 µm (blue curve) by x2 serial dilution. (D) Inhibition of CjKARI by 1f, adapted from our previous publication.[ 18 ] 1f concentrations in each reaction ranged from 50 µm (red curve) to 0 µm (blue curve) by x2 serial dilution.
Figure 4
Figure 4
Inhibition of MtKARI by 1f over 2 h. 125 nM 1f was incubated with MtKARI (green). The enzyme was fully inhibited after 1 h. When the same amount of inhibitor and enzyme was added in the presence of 4 mm AL (purple) or 100 µm NADPH (red), enzyme inhibition was not complete after 1 h pre‐incubation.
Figure 5
Figure 5
Lineweaver–Burk plots for the inhibition of MtKARI and OsKARI by 1f. A) Inhibition of MtKARI as a function of [AL] and [1f], with [NADPH] fixed at 40 µm. B) Inhibition of MtKARI as a function of [NADPH] and [1f], with [AL] fixed at 800 µm. C) Inhibition of OsKARI as a function of [AL] and [1f], with [NADPH] fixed at 40 µm. D) Inhibition of OsKARI as a function of [NADPH] and [1f], with [AL] fixed at 400 µm. The concentration of substrates and reaction rate were plotted into Equation (7) (see Experimental Section “Lineweaver–Burk plots”).
Figure 6
Figure 6
Ki value of 1f for MtKARI, CjKARI, and OsKARI. Data were measured by pre‐incubating the enzymes (159 nM for MtKARI and 120 nM for CjKARI) at 25 °C for 30 min (MtKARI) or 3 h (CjKARI) with 1f. Reactions were started by adding 1 mm AL and 200 µm NADPH. Data were fitted to Equations (2) and (3) (see Experimental section). Data for OsKARI were obtained by mixing 200 nM enzyme with 1f and 400 µm AL. Reactions were initiated by adding 200 µm NADPH. Data were fitted to Equations (2) and (3) (see Experimental Section).
Figure 7
Figure 7
Active site of SaKARI. A,B) Fo – Fc omit electron density maps for 1f contoured at 2.2 σ, and 2f contoured at 3.0 σ. C,D) Two views for the superimposition of the active sites of the SaKARI.Mg2+.1f (light green) and SaKARI.Mg2+.2f (wheat) complexes. Proteins were aligned using their C‐terminal domains (i.e., residues 184–321). Yellow‐dashed lines represent hydrogen bonds. The distance between the two Mg2+ ions is 3.4 and 3.8 Å for the 1f and 2f complexes, respectively.
Figure 8
Figure 8
Active site of OsKARI. A) Fit of 1f to the Fo – Fc omit electron density map in the active site of the OsKARI.Mg2+.1f complex; B,C) Two views of the active site of the OsKARI.Mg2+.1f complex.
Figure 9
Figure 9
Cytotoxicity assay of 1a, 1b, and 1f against mammalian cell lines HEK293 and SW620.1a, 1b, and 1f showed no inhibition against the growth of the two tested cell‐lines at concentration 1.6–200 µm. The anti‐TB drug rifampicin was used as the negative control. Values are shown as the mean of % growth for three replicates. Error bars represent the standard error of the mean (SEM).
Figure 10
Figure 10
Comparison of the active sites of SaKARI.Mg2+.NADPH.1b and SaKARI.Mg2+.1f. Both 1f (green) and 1b (cyan) bind to the active site of SaKARI. The core part of the two inhibitors is oriented differently such that there is a rotation of about 25°. The comparison shows that the phenyl ring of 1f would clash with the sidechain of P132. In addition, the thiazole of 1f would clash with the nicotinamide of NADPH. Thus, when 1f is bound the active site cannot close properly.
Figure 11
Figure 11
The active sites of four class I KARI complexes. A) MtKARI.Mg2+ (4YPO); in the absence of NADPH the active site is in an “open” state and the Mg2+‐Mg2+ distance is 4.7 Å. E228 (corresponding to E230 in SaKARI) coordinates to one of the Mg2+ ions. B) SaKARI.Mg2+.1b (7KE2). E230 is detached from Mg2+ but visible and stabilized by the presence of 1b. The Mg2+‐Mg2+ distance is contracted to 4.2 Å. C) SaKARI.Mg2+.NADPH. 1b (7KH7). A hydrogen bond is formed between E230 and 1b and the Mg2+‐Mg2+ distance further contracts to 4.0 Å. D) SaKARI.Mg2+.1f (this study). The side chain of E230 is disordered. The two Mg2+ are 3.4 Å apart.
Figure 12
Figure 12
Superimposition of KARIs in the presence and absence of NADPH and inhibitors. SaKARI.Mg2+.1f, SpKARI.Mg2+.NADPH and SaKARI.Mg2+.NADPH.1b are shown in light green, pale pink and cyan, respectively.
Figure 13
Figure 13
Comparison of OsKARI structures. A) OsKARI.Mg2+.1f (green) superimposed with OsKARI.Mg2+(light pink). M254‐K266 is an α‐helix (magenta) in OsKARI.Mg2+ but is disordered in OsKARI.Mg2+.1f. B) OsKARI.Mg2+.1f (green) superimposed with OsKARI.Mg2+.NADPH (wheat). M254‐K266 forms an α‐helix (orange) in OsKARI.Mg2+.NADPH but is disordered in OsKARI.Mg2+.1f.
Figure 14
Figure 14
Active sites of SaKARI.Mg2+.1f and OsKARI.Mg2+.1f. A) Key interactions stabilizing 1f in the active site of SaKARI include the coordination to the two Mg2+, a hydrogen bond with S251 and π stacking with P132 and H134. No interaction with the conserved E230 is observed. B) The binding of 1f to OsKARI is also promoted by the coordination to the two Mg2+ ions, hydrogen bonds with E496 and S518, and π stacking with F504. However, the helix made by residues M254‐K266 (magenta) in the free enzyme needs to relinquish its ordered structure to accommodate the inhibitor.
Figure 15
Figure 15
Superimposition of SaKARI.Mg2+.1f and MtKARI.Mg2+. A) Both structures are in their “open state”; only subtle movements are observed around the N‐domain. B) Zoom in on the binding site of 1f. Upon the binding of the inhibitor, helix G131‐G143 moves toward the active site, enabling P132 and H134 to stack with the phenyl ring of 1f. To vacate the space for P132, L234 flips away from 1f, and E230 detaches from Mg2+(ii) and becomes mobile.

Similar articles

References

    1. Lopez M. J., Mohiuddin S. S., in StatPearls [Internet], StatPearls Publishing, Florida: 2023.
    1. Levitt G., US Patent , 1978, US4127405.
    1. Christopher J. T., Powles S. B., Holtum J. A. M., Plant Physiol. 1992, 100, 1909. - PMC - PubMed
    1. Fletcher J. S., Pfleeger T. G., Ratsch H. C., Environ. Sci. Technol. 1993, 27, 2250. - PubMed
    1. Stidham M. A., Weed Sci. 1991, 39, 428.

MeSH terms

LinkOut - more resources