. 2025 May;14(10):e70950.
doi: 10.1002/cam4.70950.

Mapping of Functional Metabolic Phenotypes in Acute Myeloid Leukemia

Affiliations

Mapping of Functional Metabolic Phenotypes in Acute Myeloid Leukemia

Sissel Dyrstad et al. Cancer Med. 2025 May.

Abstract

Background: Acute myeloid leukemia (AML) is an aggressive hematologic malignancy with a poor prognosis, particularly in older patients. AML is highly heterogeneous, influenced by various chromosomal, genetic, and epigenetic alterations.

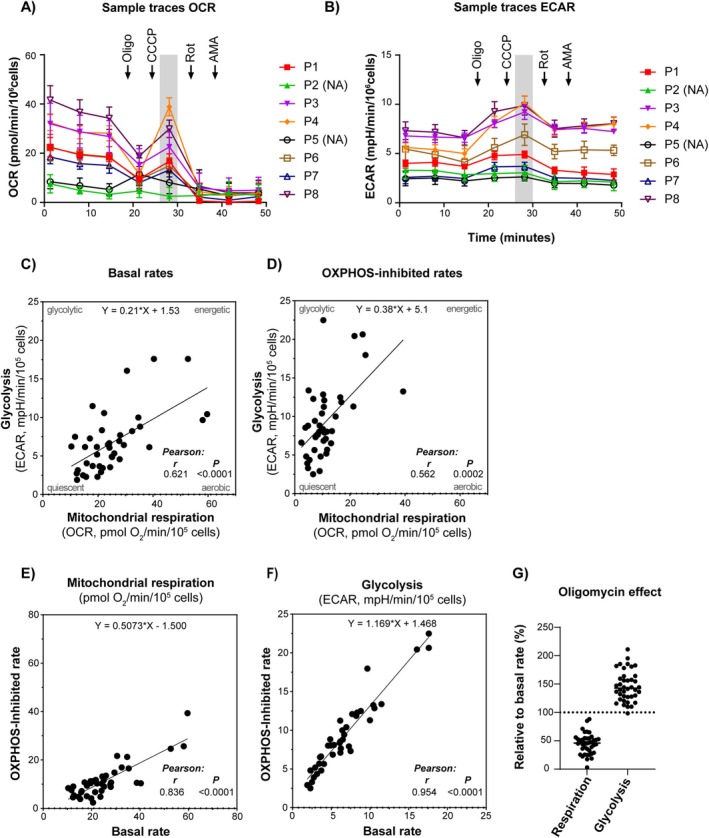
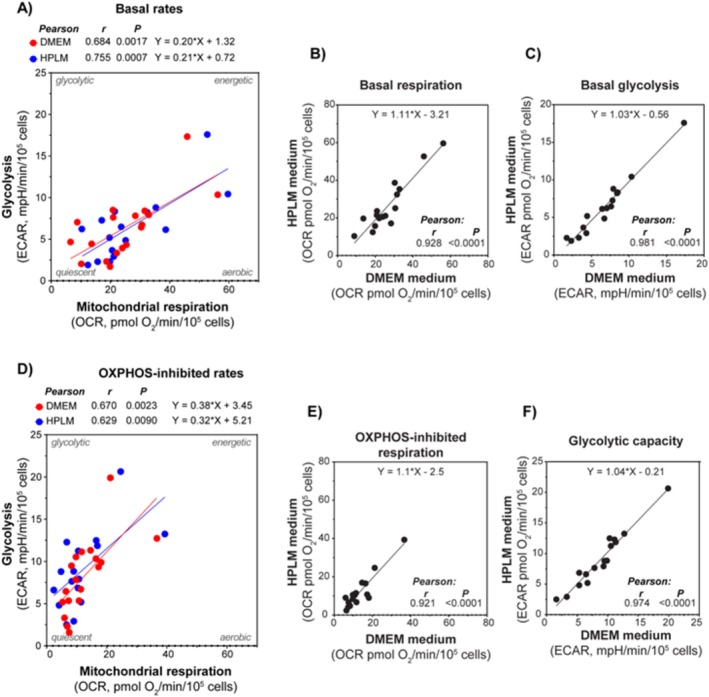
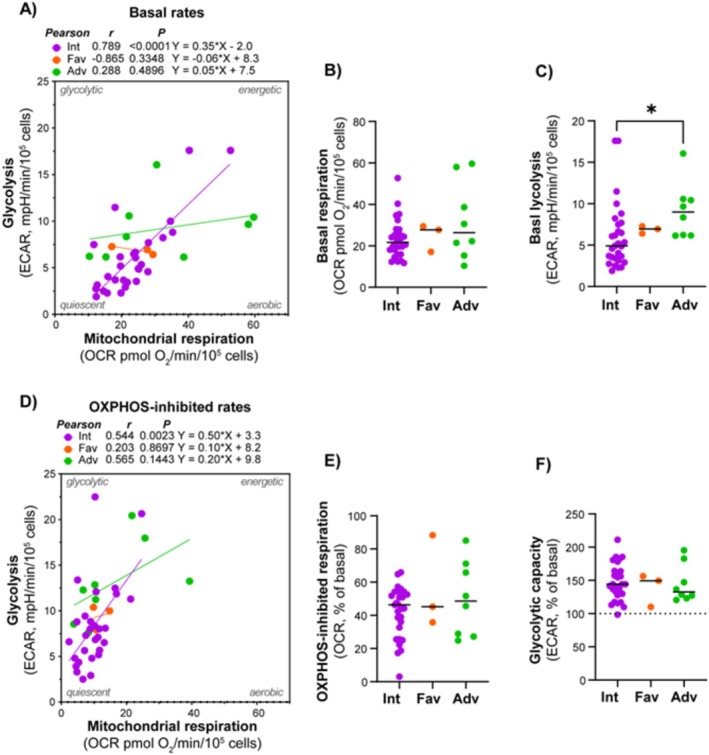
Methods: This study investigated the metabolic profiles of primary AML cells from 46 patients, focusing on mitochondrial respiration and glycolysis. We hypothesized that the metabolic profiles would reflect distinct disease characteristics. Using Seahorse technology, we measured the oxygen consumption rate (OCR) for mitochondrial respiration and the extracellular acidification rate (ECAR) for glycolysis.

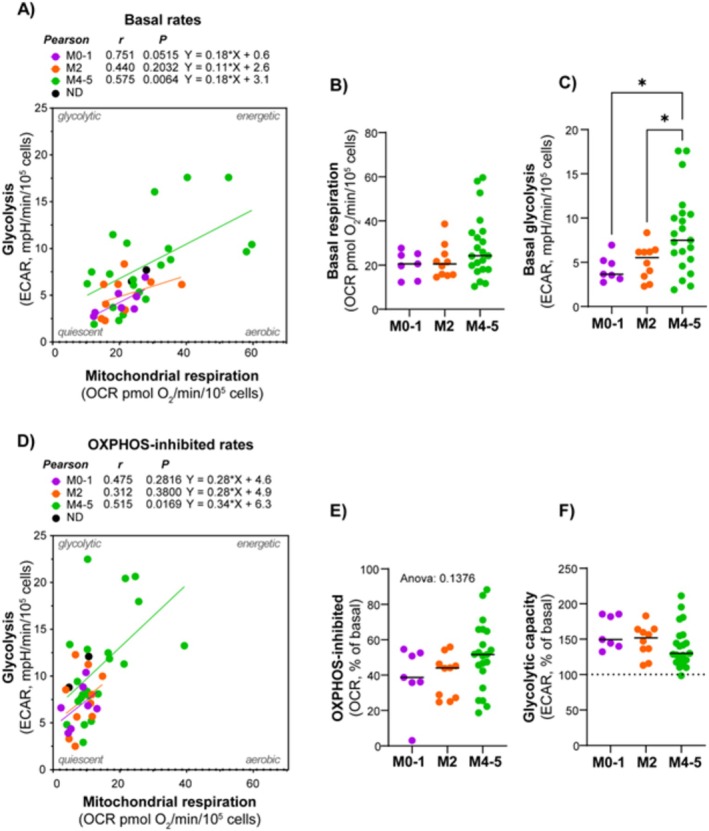
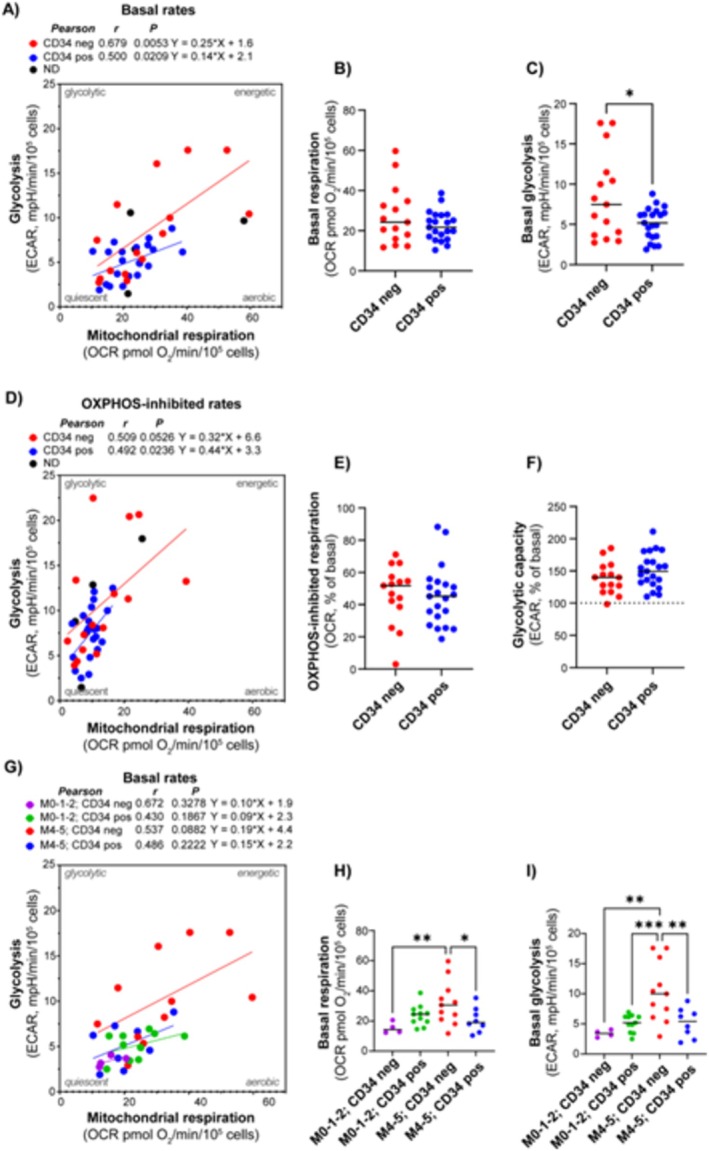
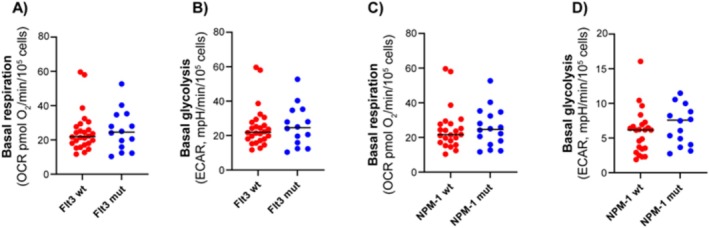
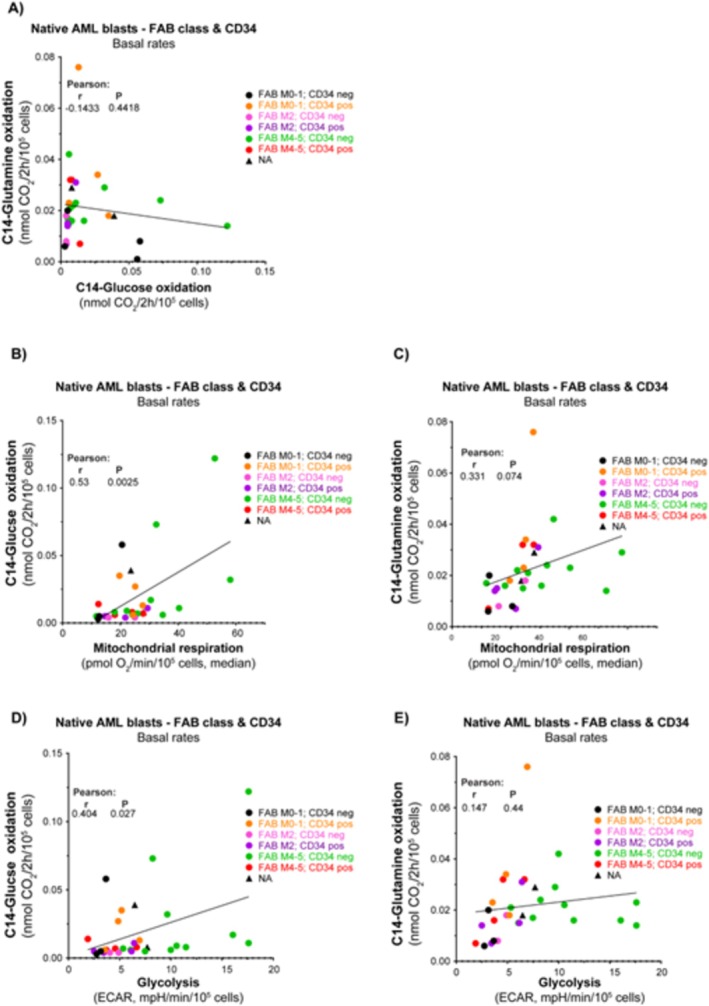
Results: Our results showed significant variability in metabolic activity, with some samples relying more on glycolysis than mitochondrial respiration. Mature AML cells (FAB M4/M5, CD34 negative) exhibited increased rates of both mitochondrial respiration and glycolysis, indicating distinct metabolic adaptations. Higher glycolytic activity was observed in patients with adverse cytogenetic abnormalities. However, no clear associations were found between metabolic profiles and mutations in FLT3 or NPM1.

Conclusion: These findings highlight the role of metabolic variability in AML and suggest that targeting specific metabolic pathways could offer therapeutic opportunities, particularly for subgroups like FAB M4/M5 with unique metabolic features. Further studies are needed to refine these therapeutic strategies for clinical application.

Keywords: acute myeloid leukemias; glycolysis; metabolic phenotypes; metabolism.


Conflict of interest statement

H.R. has consulted Novartis and Glaxo Smith Kline. The other authors declare no conflicts of interest.

Figures

FIGURE 1
FIGURE 1
Energy metabolic function in primary AML cells. Mitochondrial respiration (oxygen consumption rate, OCR, pmol O2/min/105 cells) and glycolysis (extracellular acidification rate, ECAR, mpH/min/105 cells) were measured in primary AML cells from 46 patients. (A) and (B) Representative traces showing data for one analysis plate with 8 samples (randomly numbered; NA, no activity). Using a pre‐optimized protocol, oligomycin (oligo), CCCP, rotenone (Rot), and antimycin A (AMA) were added successively to modulate metabolic parameters. The basal and OXPHOS‐inhibited rates, that is, the rates before and after oligomycin addition, respectively, were analyzed statistically. Since a significant proportion of samples did not tolerate well the addition of CCCP, the resulting uncoupled respiration rate was excluded as descriptor parameter (as indicated on the figure). (C) The association between basal rates of mitochondrial respiration and glycolysis was used to study differences in cellular metabolic phenotype. (D) In the OXPHOS‐inhibited state after adding oligomycin, there was an overall shift towards a glycolytic phenotype. (E) and (F) display the relationships between the rates of mitochondrial respiration and glycolysis, respectively, in the absence (basal rate) and presence (OXPHOS‐inhibited rate) of oligomycin. (G) The relative change (%) caused by oligomycin (OXPHOS‐inhibition). All data are shown as the mean of 4–8 technical replicates for each subject, or the averaged mean if repeated experiments were performed (for 16 subjects). Pearson correlation analysis and simple linear regression analysis were used in (C–F).
FIGURE 2
FIGURE 2
Comparison of cellular metabolic rates using HPLM and DMEM medium. The rates of mitochondrial respiration (oxygen consumption rate, OCR) and glycolysis (extracellular acidification rate, ECAR) when measured in DMEM and HPLM were compared using AML cells from 16 patients. (A) Correlation plot of the basal rates of mitochondrial respiration and glycolysis in the two media. (B) and (C) Correlation plots of DMEM versus HPLM for basal rates of mitochondrial respiration and glycolysis, respectively. (D–F) Show the OXPHOS‐inhibited condition (with oligomycin). All data are shown as mean of 4–8 technical replicates for each subject. Pearson correlation analysis and simple linear regression analysis were performed.
FIGURE 3
FIGURE 3
Relationship between the metabolic phenotype and AML maturation. Comparison of mitochondrial respiration (oxygen consumption rate, OCR) and glycolysis (extracellular acidification rate, ECAR) in AML maturation subsets. (A) Correlation analysis between the basal rates of mitochondrial respiration and glycolysis, comparing different maturation subsets according to the FAB classification. (B) Corresponding analysis under the OXPHOS‐inhibited condition. (C–F) Statistical analysis of key parameters according to FAB subsets. All data are shown as the mean of 4–8 technical replicates for each subject. Pearson correlation analysis and simple linear regression analysis were performed in (A) and (B). *p ≤ 0.05, ordinary one‐way ANOVA and uncorrected Fischer's LSD for multiple comparisons.
FIGURE 4
FIGURE 4
Relationship between the metabolic phenotype and CD34. Comparison of mitochondrial respiration (oxygen consumption rate, OCR) and glycolysis (extracellular acidification rate, ECAR) in CD34 positive versus CD34 negative subsets. (A) Correlation analysis between the basal rates of mitochondrial respiration and glycolysis, comparing CD34 positive and negative subjects. (B) Corresponding analysis under the OXPHOS‐inhibited condition. (C–F) Show statistical analysis of key parameters, according to CD34 status. (G–I) Corresponding analyses according to the combined FAB classification and CD34 status. All data are shown as mean of 4–8 technical replicates for each subject. Pearson correlation analysis and simple linear regression analysis were performed in (A), (B), and (G). *p ≤ 0.05, **p ≤ 0.01, ***p ≤ 0.001, *p ≤ 0.05 ordinary one‐way ANOVA and uncorrected Fischer's LSD for multiple comparisons.
FIGURE 5
FIGURE 5
Relationship between the metabolic phenotype and adverse cytogenetics. Comparison of mitochondrial respiration (oxygen consumption rate, OCR) and glycolysis (extracellular acidification rate, ECAR) between different cytogenetic subsets. (A) Correlation analysis between the basal rates of mitochondrial respiration and glycolysis, comparing primary blasts from patients with favorable (Fav), intermediary (Int), and adverse (Adv) cytogenetics. (B) Corresponding analysis under the OXPHOS‐inhibited condition. (C–F) Show statistical analysis of key parameters, according to cytogenetic group. All data are shown as mean of 4–8 technical replicates for each subject. Pearson correlation analysis and simple linear regression analysis were performed in (A) and (B). *p ≤ 0.05, ordinary one‐way ANOVA and uncorrected Fischer's LSD for multiple comparisons.
FIGURE 6
FIGURE 6
Relationship between the metabolic phenotype and FLT3 and NPM1 mutations. Comparison of mitochondrial respiration (oxygen consumption rate, OCR) and glycolysis (extracellular acidification rate, ECAR) between subsets with or without mutations in FLT3 and NPM1. Basal rates of mitochondrial respiration and glycolysis are compared between groups with or without FLT3 mutation (A, B) and NPM1 mutation (C, D). All data are shown as mean of 4–8 technical replicates for each subject. Statistical difference was evaluated using Welch's test.
FIGURE 7
FIGURE 7
Glucose and glutamine oxidation rates. Glucose and glutamine oxidation rates were assessed by measuring the cellular production of 14CO2 from 14C‐labeled glucose/glutamine (nmol CO2/2 h/105 cells), using primary AML samples (n = 31). (A) The relationship between the measured rates of glucose and glutamine oxidation. The relationship between mitochondrial respiration and (B) glucose oxidation rate and (C) glutamine oxidation rate. The relationship between glycolysis and (D) glucose oxidation rate and (E) glutamine oxidation rate. Data are shown as the mean of 5 technical replicates. Pearson correlation analysis and simple linear regression analysis were used.

Similar articles

References

    1. DiNardo C. D., Erba H. P., Freeman S. D., and Wei A. H., “Acute Myeloid Leukaemia,” Lancet 401, no. 10393 (2023): 2073–2086. - PubMed
    1. Extermann M., Artz A., Rebollo M. A., et al., “Treating Acute Myelogenous Leukemia in Patients Aged 70 and Above: Recommendations From the International Society of Geriatric Oncology (SIOG),” Journal of Geriatric Oncology 15, no. 2 (2024): 101626. - PubMed
    1. Bouligny I. M., Maher K. R., and Grant S., “Mechanisms of Myeloid Leukemogenesis: Current Perspectives and Therapeutic Objectives,” Blood Reviews 57 (2023): 100996. - PMC - PubMed
    1. Reikvam H., “Revisiting the Prognostic Role of FLT3 Mutations in Acute Myelogenous Leukemia,” Expert Review of Hematology 16, no. 5 (2023): 317–323. - PubMed
    1. Falini B., Martelli M. P., Brunetti L., Gjertsen B. T., and Andresen V., “The NPM1 Mutant Defines AML Irrespective of Blast Count,” American Journal of Hematology 98, no. 7 (2023): E187–E189. - PubMed