. 2025 May;31(5):e70440.
doi: 10.1111/cns.70440.

ALOX15-Mediated Neuron Ferroptosis Was Involved in Diabetic Peripheral Neuropathic Pain

Affiliations

ALOX15-Mediated Neuron Ferroptosis Was Involved in Diabetic Peripheral Neuropathic Pain

Zhiye Feng et al. CNS Neurosci Ther. 2025 May.

Abstract

Background: Diabetic peripheral neuropathic pain (DPNP) is one of the most common complications in diabetic patients. Current treatment strategies primarily focus on blood glucose control and pain relief, but they often yield limited effects. Ferroptosis, a regulated form of cell death driven by lipid peroxidation and iron imbalance, plays a crucial role in various diseases, including neuropathic pain.

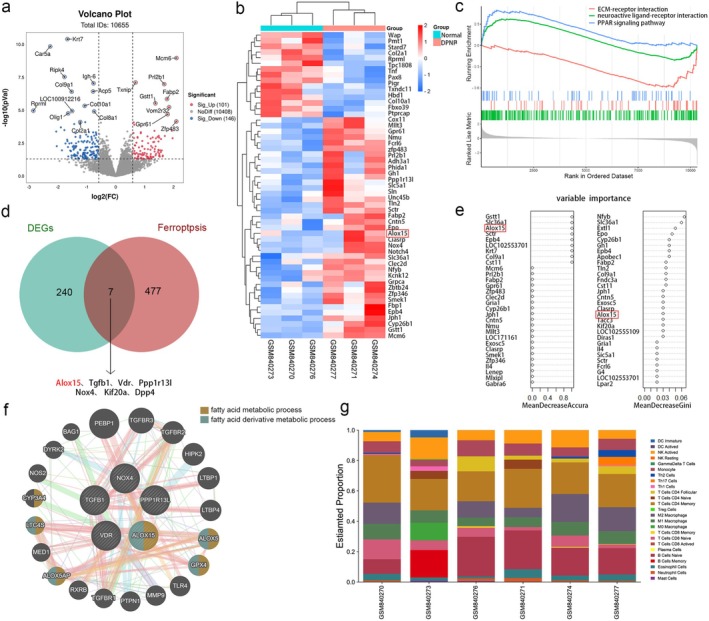
Methods: In this study, we employed a combined bioinformatics and machine learning approach to identify genes most strongly associated with DPNP and ferroptosis. Subsequently, we established a DPNP mouse model via streptozotocin (STZ) injection and a high-glucose-induced SH-SY5Y cell injury model. ALOX15 was knocked down in the in vitro model using siRNA transfection.

Results: Bioinformatics analysis identified ALOX15 as a hub gene linking DPNP and ferroptosis. In both in vivo and in vitro DPNP models, ALOX15 expression was significantly upregulated and correlated with ferroptosis biomarkers. Knockdown of ALOX15 in the cellular model mitigated high-glucose-induced ferroptosis, reduced lipid peroxidation and free iron ion accumulation, and restored cell viability.

Conclusion: In conclusion, ALOX15 contributes to the onset and progression of DPNP by promoting ferroptosis, and its knockdown effectively suppresses ferroptosis, providing a novel target and strategy for DPNP treatment.

Keywords: ALOX15; diabetic peripheral neuropathic pain; ferroptosis; machine learning.


Conflict of interest statement

The authors declare no conflicts of interest.

Figures

FIGURE 1
FIGURE 1
Differential gene expression analysis and GSEA, ALOX15 upregulated in DRG of DPNP rats. (a) Volcano plot showing upregulated and downregulated genes. (b) Heat map of the 50 most differentially expressed genes regulated by DPNP. Expression down‐regulation is shown in blue, whereas up‐regulation is represented in red. (c) The three most differentially expressed pathways in GSEA. (d) Venn diagram of differentially expressed genes and ferroptosis‐related genes. The Venn diagram shows that the intersection includes seven genes, demonstrating that they are all under the regulation of DPNP as well as implicated in ferroptosis. (e) Importance ranking of the random forest algorithm differentially expressed genes. (f) The GeneMANIA website is used to establish the PPI network. The 20 functionally similar genes are located in the outer circle, while the intersection genes are located in the inner circle. (g) The proportion of immune cells was shown.
FIGURE 2
FIGURE 2
Construction of DPNP model; increased expression of ALOX15 and ferroptosis‐related proteins in DRG of DPNP mice. (a–d) Time course of body weight (a), blood glucose (b), PWT (c) and PWL (d) in the DPNP and control mice. After 10 weeks, the mice in the DPNP group showed obvious mechanical pain and thermal pain hypersensitivity. (e–j) Protein expression levels of ALOX15, MDA, 4HNE, and FTH1. Two‐tailed unpaired student T‐test, n = 6 mice/group. Data are presented as mean ± standard deviation. # p < 0.05, ### p < 0.001, **p < 0.01, ***p < 0.001. PWL, paw withdrawal latency; PWT, paw withdrawal threshold.
FIGURE 3
FIGURE 3
ALOX15 expression was increased in high glucose injury cell model. (a–c) Trends in cell viability of neuronal cells treated with different glucose concentrations for 24, 48, and 72 h, respectively. (d) ALOX15 expression was analyzed through qPCR, with mRNA levels normalized to β‐actin. (e) WB of ALOX15 with 50 mM glucose. (f) Quantitative analysis of ALOX15 expression, with levels of expression normalized to β‐actin. Data are shown as mean ± SD. One‐way ANOVA was used, followed by Tukey's multiple comparisons using multiple sample means compared two‐by‐two. *p < 0.05, **p < 0.01, ***p < 0.001. n = 3–6 independent cell culture preparations.
FIGURE 4
FIGURE 4
ALOX15 promotes neuronal ferroptosis via lipid peroxidation. Cells were treated with 50 mM glucose for 24, 48, and 72 h, respectively. (a) Representative images of live cell staining using C11‐BODIPY: Oxidized state (green), reduced state (red). Scale bar: 20 μm. (b) Flow cytometry detection of lipid ROS levels by C11‐BODIPY staining. (c) Quantitative data of lipid ROS detected by confocal fluorescence. (d) Quantitative data of lipid ROS detection by flow cytometry. (e) Representative images of MDA (green) immunofluorescence staining, DAPI staining (blue) for nucleic acid detection. Scale bar: 10 μm. (f) Quantitative data of MDA detected by confocal fluorescence. (g) Representative WB of ALOX15 and 4HNE. (h, i) Quantitative analysis of ALOX15 and 4HNE expression. Data are shown as mean ± SD. One‐way ANOVA was used, followed by Tukey's multiple comparisons using multiple sample means compared two‐by‐two. *p < 0.05, **p < 0.01, ***p < 0.001, ns p > 0.05. n = 3 independent cell culture preparations.
FIGURE 5
FIGURE 5
Ferroptosis‐related proteins are activated in a high glucose injury cell model. Fe2+ levels were detected by immunofluorescence and flow cytometry after treatment with 50 mM glucose for 24, 48, and 72 h, respectively. (a) Representative confocal fluorescence images of Fe2+ levels in the cells shown. Scale bar size is 25 μm. (b) Flow cytometry detection of Fe2+ levels. (c) Quantitative data of Fe2+ detected by confocal fluorescence. (d) Quantitative data of Fe2+ detected by flow cytometry. (e) WB analysis of GPX4 and FTH1, using β‐actin as a normalization control. (f, g) Quantitative assessment of the expression of GPX4 and FTH1. Data are shown as mean ± SD. One‐way ANOVA was used, followed by Tukey's multiple comparisons using multiple sample means compared two‐by‐two. *p < 0.05, ***p < 0.001, ns p > 0.05. n = 3 independent cell culture preparations.
FIGURE 6
FIGURE 6
Knockdown of ALOX15 attenuates high glucose (HG)‐induced impairment of neuronal viability. Specific siRNA knockdown of ALOX15 was used and treated accordingly to grouping requirements. glucose: 50 mM. (a) ALOX15 expression was analyzed through qPCR, with mRNA levels normalized to β‐actin. (b) WB of ALOX15. (c) Measurement of ALOX15 expression levels. (d) CCK‐8 results of control and high glucose groups after ALOX15 knockdown. Data are shown as mean ± SD. One‐way ANOVA was used, followed by Tukey's multiple comparisons using multiple sample means compared two by two. *p < 0.05, **p < 0.01, ***p < 0.001. n = 3–6 independent cell culture preparations.
FIGURE 7
FIGURE 7
Knockdown of ALOX15 inhibits neuronal ferroptosis by attenuating lipid ROS levels. (a) Representative images of live cell staining using C11‐BODIPY: Oxidized state (green), reduced state (red). Scale bar: 20 μm. (b) Flow cytometry detection of lipid ROS levels by C11‐BODIPY staining. (c) Quantitative data of lipid ROS detected by confocal fluorescence. (d) Quantitative data of lipid ROS detection by flow cytometry. (e) Representative images of MDA (green) immunofluorescence staining, DAPI staining (blue) for nucleic acid detection. Scale bar: 10 μm. (f) Quantitative data of MDA detected by confocal fluorescence. (g) Representative WB of ALOX15 and 4HNE. (h, i) Quantitative analysis of ALOX15 and 4HNE expression. Data are shown as mean ± SD. One‐way ANOVA was used, followed by Tukey's multiple comparisons using multiple sample means compared two‐by‐two. *p < 0.05, **p < 0.01, ***p < 0.001, ns p > 0.05. n = 3 independent cell culture preparations.
FIGURE 8
FIGURE 8
Knockdown of ALOX15 attenuates high glucose‐induced neuronal ferroptosis. (a) Representative confocal fluorescence images of Fe2+ levels in the cells shown. Scale bar size is 25 μm. (b) Flow cytometry detection of Fe2+ levels. (c) Quantitative data of Fe2+ detected by confocal fluorescence. (d) Quantitative data of Fe2+ detected by flow cytometry. (e) WB analysis of GPX4 and FTH1, using β‐actin as a normalization control (three samples in each group). (f, g) Quantitative assessment of the expression of GPX4 and FTH1. Data are shown as mean ± SD. One‐way ANOVA was used, followed by Tukey's multiple comparisons using multiple sample means compared two‐by‐two. **p < 0.01, ***p < 0.001, ns p > 0.05. n = 3 independent cell culture preparations.

Similar articles

References

    1. Jensen T. S., Karlsson P., Gylfadottir S. S., et al., “Painful and Non‐Painful Diabetic Neuropathy, Diagnostic Challenges and Implications for Future Management,” Brain 144, no. 6 (2021): 1632–1645. - PMC - PubMed
    1. Veves A., Backonja M., and Malik R. A., “Painful Diabetic Neuropathy: Epidemiology, Natural History, Early Diagnosis, and Treatment Options,” Pain Medicine 9, no. 6 (2008): 660–674. - PubMed
    1. Iyer S. and Tanenberg R. J., “Pharmacologic Management of Diabetic Peripheral Neuropathic Pain,” Expert Opinion on Pharmacotherapy 14, no. 13 (2013): 1765–1775. - PubMed
    1. Dixon S. J., Lemberg K. M., Lamprecht M. R., et al., “Ferroptosis: An Iron‐Dependent Form of Nonapoptotic Cell Death,” Cell 149, no. 5 (2012): 1060–1072. - PMC - PubMed
    1. Jiang X., Stockwell B. R., and Conrad M., “Ferroptosis: Mechanisms, Biology and Role in Disease,” Nature Reviews. Molecular Cell Biology 22, no. 4 (2021): 266–282. - PMC - PubMed

MeSH terms

Substances