. 2025 Aug;12(29):e15276.
doi: 10.1002/advs.202415276. Epub 2025 May 19.

Activation of HTR2B Suppresses Osteosarcoma Progression through the STAT1-NLRP3 Inflammasome Pathway and Promotes OASL1+ Macrophage Production to Enhance Antitumor Immunity

Affiliations

Activation of HTR2B Suppresses Osteosarcoma Progression through the STAT1-NLRP3 Inflammasome Pathway and Promotes OASL1+ Macrophage Production to Enhance Antitumor Immunity

Zhen Huang et al. Adv Sci (Weinh). 2025 Aug.

Abstract

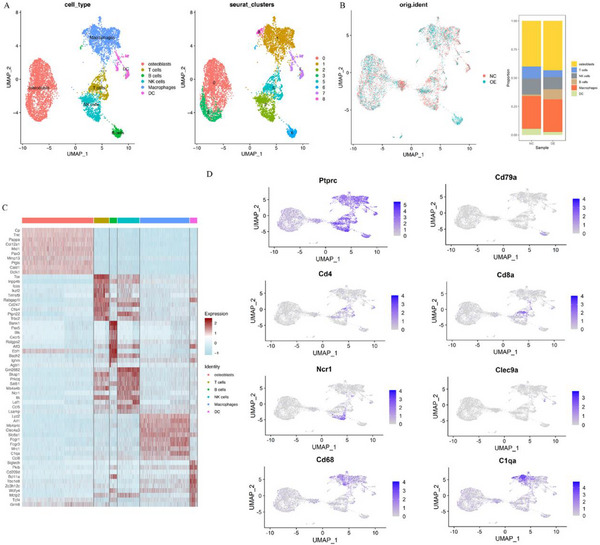
Osteosarcoma is a primary malignant bone tumor originating from mesenchymal tissue, and associated with poor prognosis. The 5-hydroxytryptamine receptor 2B (HTR2B), a receptor for serotonin, is known to play a role in the progression of multiple tumors. This study aims to explore the potential roles of HTR2B in osteosarcoma progression. HTR2B expression is analyzed using the TARGET, GEO databases, and osteosarcoma tissue samples in the hospital. Lentivirus and agonist BW-723C86 are employed to assess HTR2B overexpression effects in osteosarcoma cell lines. Transcriptome sequencing analysis and single-cell sequencing are performed to identify potential downstream molecules and signaling pathways, and the changes in tumor immune microenvironment. The investigation demonstrates that HTR2B is downregulated in osteosarcoma tissues, and correlates with poorer survival outcomes. Upregulating HTR2B through lentiviral-mediated gene delivery or the agonist BW-723C86, resulted in a marked suppression of osteosarcoma cell progression via the STAT1-NLRP3 inflammasome pathway. Single-cell sequencing of CD45+ cells reveals that HTR2B activation enhances the production of OASL1+ macrophages, contributing to the observed enhancement of antitumor immunity. These findings propose HTR2B as a novel therapeutic target for treating osteosarcoma, offering a dual mechanism of action that directly impedes tumor cell proliferation and augments the host immune response.

Keywords: HTR2B; OASL1+ macrophage; STAT1‐NLRP3 inflammasome; activation; osteosarcoma.


Conflict of interest statement

The authors declare no conflict of interest.

Figures

Figure 1
Figure 1
The expression of HTR2B in osteosarcoma and its relationship with the prognosis of patients with osteosarcoma, and the effect of HTR2B overexpression on the proliferation of osteosarcoma cells. A) Analysis of serotonin receptors with osteosarcoma prognosis in TARGET‐Osteosarcoma database revealed that low expression of HTR2B related to poor prognosis. B) Through the public database analysis found that HTR2B expression was downregulated in osteosarcoma. C) Our hospital osteosarcoma samples confirmed low expression of HTR2B in osteosarcoma tissue. D) Our hospital osteosarcoma samples found that low expression of HTR2B closely related to poor prognosis of osteosarcoma patients. E) EdU assay revealed that the proliferation capacity of K7M2 and LM8 cells in HTR2B overexpression group was significantly reduced. F) Colony formation found that HTR2B overexpression suppress the colony formation ability. ***P < 0.001.
Figure 2
Figure 2
Effects of HTR2B overexpression on osteosarcoma cell migration, invasion, cell cycle, and tumor growth. A) Wound healing showed that HTR2B overexpression group of K7M2 and LM8 cells inhibited cell migration. B) Transwell assay revealed reduced migration and invasion abilities of K7M2 and LM8 cells with HTR2B overexpression. C) Increased proportion of G1 phase in the K7M2 and LM8 cells was observed with HTR2B overexpression. D) Tumor growth in vivo was significantly inhibited in the HTR2B overexpression group. E) The HE staining confirmed that osteosarcoma tumor tissue in OE‐NC and OE‐HTR2B group, and HTR2B expression is promoted in OE‐HTR2B group, Ki67 protein is decreased in OE‐HTR2B group. *P < 0.05, ***P < 0.001.
Figure 3
Figure 3
Effects of HTR2B agonist (BW‐723C86) on osteosarcoma cell activity, proliferation, and migration. A) Changes of cell viability of K7M2 and LM8 cells at different concentrations of BW‐723C86. B) Effects of BW‐723C86 on the state of K7M2 cells and LM8 cells after 48 h intervention at 0, 20, and 40 µm concentrations. C) BW‐723C86 treatment increased HTR2B expression in K7M2 and LM8 cells. D) Colony formation ability of K7M2 and LM8 cells was inhibited with increasing BW‐723C86 concentration. E) The proliferation ability of K7M2 and LM8 cells was gradually inhibited with the increase of BW‐723C86 concentration. F) The migration ability of K7M2 and LM8 cells was gradually inhibited with the increase of BW‐723C86 concentration. ***P <0.001.
Figure 4
Figure 4
BW‐723C86 effects on cell migration, invasion, cell cycle, and tumor growth in vivo. A) Migration and invasion abilities of K7M2 and LM8 cells were inhibited by BW‐723C86 in a dose‐dependent manner. B) The G1 phase proportions of K7M2 and LM8 cells gradually increased with the increase of BW‐723C86 concentration. C) BW‐723C86 treatment significantly inhibited tumor growth in vivo compared with DMSO control group. D) The HE staining confirmed that osteosarcoma tumor tissue in BW‐723C86 and DMSO group, and HTR2B expression is promoted in BW‐723C86 group, Ki67 protein is decreased in BW‐723C86 group. E) No significant visceral toxicity observed in heart, lung, liver, spleen, and kidney after BW‐723C86 intervention. ***P < 0.001.
Figure 5
Figure 5
Activation of HTR2B promotes STAT1 protein expression in osteosarcoma cell lines. A) Transcriptome sequencing analysis showed that HTR2B and STAT1 genes were significantly upregulated in HTR2B overexpression group. B) The protein–protein interaction analysis suggested STAT1 may be potential downstream target of HTR2B activation. (C) HDOCK Server analysis showed that HTR2B and STAT1 can be stable binding. D) Western blot analysis demonstrated that HTR2B activation by lentivirus or BW‐723C86 increased STAT1 protein expression. E) Representative images of STAT1 lentivirus transfection in K7M2 cell and mRNA and protein expression of STAT1 were significantly decreased. F) The mRNA and protein expression of STAT1 were significantly decreased in STAT1 lentivirus transfection in LM8 cell. *P < 0.05, **P < 0.01.
Figure 6
Figure 6
Effects of STAT1 knockdown on osteosarcoma cell proliferation and migration, invasion, cell cycle, and tumor growth in vivo. A) The EdU assay revealed that the proliferation capacity of K7M2 and LM8 cells in sh‐STAT1‐1 and sh‐STAT1‐2 group was significantly reduced compared with sh‐NC control group. B) Colony formation assays showed reduced colony formation in STAT1 knockdown K7M2 and LM8 cells compared to control group. C) Wound healing assays demonstrated reduced migration ability in STAT1 knockdown K7M2 and LM8 cells. D) Transwell assay showed decrease migration and invasion in STAT1 knockdown cells compared to control group. E) The proportion of G1 phase in K7M2 and LM8 cells with STAT1 knockdown was increased compared to sh‐NC group. F) Tumor growth was significantly inhibited in STAT1 knockdown groups in vivo. *P < 0.05, **P < 0.01, ***P < 0.001.
Figure 7
Figure 7
Effects of HTR2B overexpression combined with STAT1 knockdown on osteosarcoma cell proliferation and migration, invasion, cell cycle, and tumor growth in vivo. A) The western blot assays confirmed a transfected efficiency of OE‐HTR2B and sh‐STAT1 in K7M2 and LM8 cells. B) Colony formation assay found that colony formation ability further decreased in OE‐HTR2B combined with sh‐STAT1 group. C) The EdU assay revealed that OE‐HTR2B combined with sh‐STAT1 can further reduce cell proliferation ability in K7M2 and LM8 cells. D) Wound healing assay revealed that OE‐HTR2B combined with sh‐STAT1 can further suppress migration ability in K7M2 and LM8 cells. E) Transwell assay result demonstrated that OE‐HTR2B combined with sh‐STAT1 can further inhibit the migration and invasion abilities in K7M2 and LM8 cells. F) The cell cycle analysis showed that G1 phase is further arrested in OE‐HTR2B combined with sh‐STAT1 group in K7M2 and LM8 cells. G) The in vivo experiment revealed that OE‐HTR2B combined with sh‐STAT1 group can further suppress tumor growth. *P < 0.05, **P < 0.01, ***P < 0.001.
Figure 8
Figure 8
Activation of HTR2B suppresses osteosarcoma progression via NLRP3 inflammasome pathway. A) KEGG enrichment analysis of transcriptome sequencing showed that the NOD‐like receptor signaling pathway is enriched, which containing the STAT1. B) Western blot analysis showed that promotion of HTR2B protein by lentivirus or BW‐723C86, knockdown of STAT1, and HTR2B overexpression combined with STAT1 knockdown led to the activation of the NLRP3 inflammasome pathway.
Figure 9
Figure 9
HTR2B activation and its impact on the tumor immune microenvironment. A) The GO‐GSEA analysis of tumor tissue transcriptome sequencing revealed that HTR2B activation associated with multiple immune reaction processes. B) The KEGG‐GSEA analysis of tumor tissue transcriptome sequencing found that activation of HTR2B associated with multiple immune reaction processes. C) The analysis of osteosarcoma single‐cell database revealed the enrichment of HTR2B in macrophage. D) The microenvironment scoring of HTR2B expression. E) Bioinformatics analysis of GSE19276 and TARGET‐Osteosarcoma databases showed that high HTR2B expression correlates with increased immune cell infiltration, containing macrophage. *P < 0.05, **P < 0.01.
Figure 10
Figure 10
Single‐cell sequencing results and marker enrichment. A) Unsupervised clustering analysis identified 6 distinct cells into Osteoblasts, T cells, B cells, NK cells, Macrophages, and DC clusters, respectively. B) The distribution and percentage of each subgroups in NC and OE group; C) The markers heatmap of different clusters in single cell. D) The representative genes enriched in T cells, B cells, NK cells, Macrophages, DC clusters, respectively.
Figure 11
Figure 11
Macrophage subgroup annotations and potential functions. A) The macrophage subgroup has been defined as Mono‐Vcan, Mac‐Oasl1, Mac‐Skap1, Mac‐Top2a, and Mac‐Selenop clusters. B) The distribution and percentage of each subgroup in NC and OE group. C) Heatmap of markers for macrophage subgroups. D) The volcano map of differential genes expression in Mac‐Oasl1 subgroup. E) GO enrichment analysis found that signaling pathways related to antigen presentation were significantly enriched. F) KEGG enrichment analysis revealed that antigen processing and presentation, and ferroptosis pathway were enriched. G) Scoring analysis showed decreased MDSC and increased M1 macrophage and antigen‐presenting scores in the OE group, with unchanged M2 macrophage scores. H) Costimulatory molecules analysis showed that CD86, Cxcl2, and Cxcl10 increased in OE group, which could increase immune infiltration. I) Ferroptosis‐related gene expression indicated reduced ferroptosis in the Oasl1 subgroup, indicating that the Oasl1 subgroup was resistant to ferroptosis. J) The multiple immunofluorescence staining results confirmed that OASL1+macrophages is promoted in OE‐HTR2B group. ***P < 0.001.
Figure 12
Figure 12
Pseudotime analysis of macrophage subgroups and cell communications. A) Unsupervised trajectory of macrophage transition along pseudotime using Monocle. B) The monocle facet in NC and OE group. C) The cluster and group density transition along pseudotime. D) GO enrichment analysis showed that cluster1 subgroup was associated with macrophage activation and leukocyte activation, cluster2 subgroup is associated with T cell activation and differentiation, and cluster3 subgroup is associated with leukocyte activation and chemotaxis. E) KEGG enrichment analysis showed that cluster1 subgroup was associated with ferroptosis, the cluster2 subgroup is associated with of T cell receptors and subtypes differentiation, the cluster3 subgroup is associated with cytokine receptors and chemokines. F) The ferroptosis enrichment pathway in cluster1 subgroup showed that the expression levels of ferroptosis suppressor genes fth1 and ftl1 gradually increased in Oasl1 subgroup. G) Cell communication analysis showed enhanced interactions among macrophage subtypes and weakened interactions with CD8 Tex and CD4 Treg. H) Ligand receptor analysis showed that Mac‐Oasl1subgroup macrophages may enhance the interaction between giant cells through Cadm1‐Cadm1 and Ccl7‐Ccr2, while the expressions of Mif‐CD74‐ CD44 (macrophage migration inhibitor) and Lgals9‐Havcr2 were significantly inhibited in OE‐HTR2B group, the interaction with CD8 Tex and CD4 Treg may be weakened by Lgals9‐Ptprc and H2‐Ob‐ CD4.

Similar articles

References

    1. Liu W., Li L., Bai X., Zhang M., Lv W., Ma Y., Sun Y., Zhang H., Jiang Q., Yao Q., Zhang Z. Y., Adv. Sci. 2025, 2409870. - PMC - PubMed
    1. Ji R., Wang Y., Pan D., Han J., Wang Y., Zheng S., Zhao W., Li X., Han C., Zhang L., Cancer Lett. 2024, 591, 216893. - PubMed
    1. Wang Y., Hong J., Ge S., Wang T., Mei Z., He M., Liu Y., Fang J., Liu C., Yang L., Yuan Y., Phytomedicine 2024, 132, 155430. - PubMed
    1. Tatsuno R., Ichikawa J., Komohara Y., Pan C., Kawasaki T., Enomoto A., Aoki K., Hayakawa K., Iwata S., Jubashi T., Haro H., Cell Death Dis. 2024, 15, 108. - PMC - PubMed
    1. Lilienthal I., Herold N., Int. J. Mol. Sci. 2020, 21, 6885. - PMC - PubMed

MeSH terms

Substances

LinkOut - more resources