

The Application of Anisotropically Collapsing Gels, Deep Learning, and Optical Microscopy for Chemical Characterization of Nanoparticles and Nanoplastics
- PMID: 40387864
- PMCID: PMC12139033
- DOI: 10.1021/acs.langmuir.5c00769
The Application of Anisotropically Collapsing Gels, Deep Learning, and Optical Microscopy for Chemical Characterization of Nanoparticles and Nanoplastics
Abstract
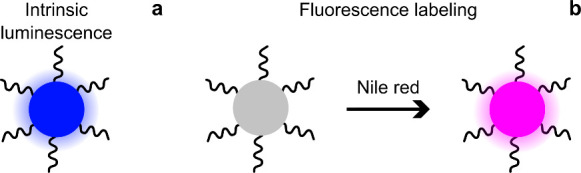
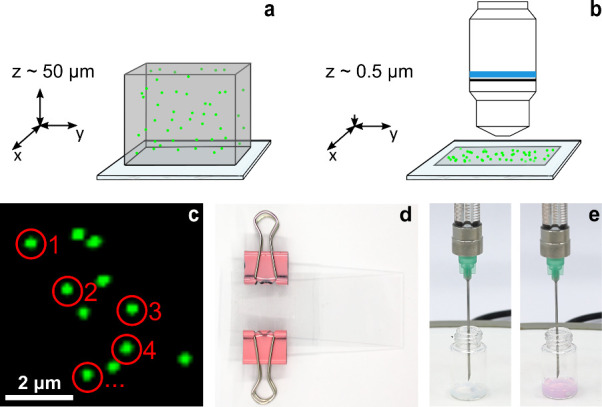
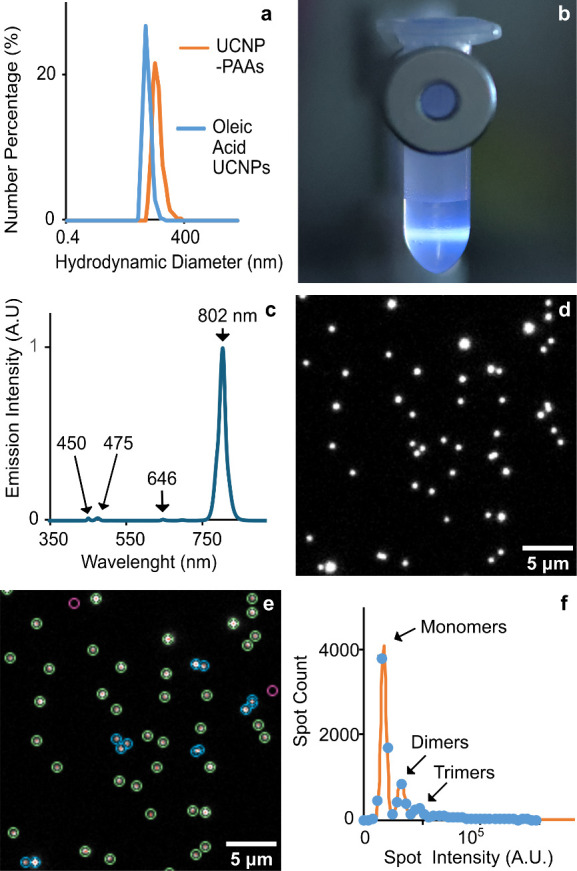
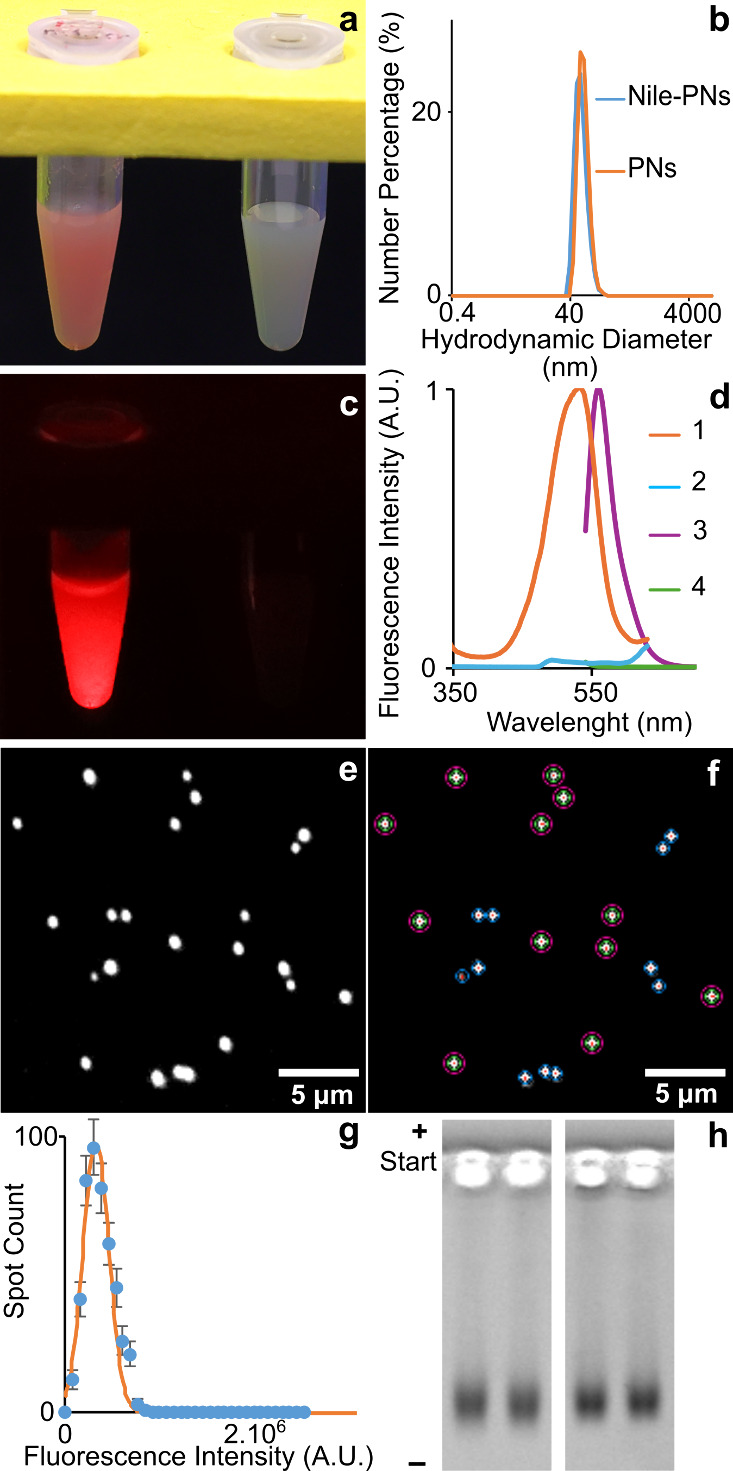
The surface chemistry of nanomaterials, particularly the density of functional groups, governs their behavior in applications such as bioanalysis, bioimaging, and environmental impact studies. Here, we report a precise method to quantify carboxyl groups per nanoparticle by combining anisotropically collapsing agarose gels for nanoparticle immobilization with fluorescence microscopy and acid-base titration. We applied this approach to photon-upconversion nanoparticles (UCNPs) coated with poly(acrylic acid) (PAA) and fluorescence-labeled polystyrene nanoparticles (PNs), which serve as models for bioimaging and environmental pollutants, respectively. UCNPs exhibited 152 ± 14 thousand carboxyl groups per particle (∼11 groups/nm2), while PNs were characterized with 38 ± 3.6 thousand groups (∼1.7 groups/nm2). The limit of detection was 6.4 and 1.9 thousand carboxyl groups per nanoparticle, and the limit of quantification was determined at 21 and 6.2 thousand carboxyl groups per nanoparticle for UCNP-PAAs and PNs, respectively. High intrinsic luminescence enabled direct imaging of UCNPs, while PNs required fluorescence staining with Nile Red to overcome low signal-to-noise ratios. The study also discussed the critical influence of nanoparticle concentration and titration conditions on the assay performance. This method advances the precise characterization of surface chemistry, offering insights into nanoparticle structure that extend beyond the resolution of electron microscopy. Our findings establish a robust platform for investigating the interplay of surface chemistry with nanoparticle function and fate in technological and environmental contexts, with broad applicability across nanomaterials.
Figures
Similar articles
-
Improving the sensitivity of immunoassays by reducing non-specific binding of poly(acrylic acid) coated upconverting nanoparticles by adding free poly(acrylic acid).Mikrochim Acta. 2018 Mar 13;185(4):220. doi: 10.1007/s00604-018-2756-z. Mikrochim Acta. 2018. PMID: 29594511
-
Absolute Counting Method with Multiplexing Capability for Estimating the Number Concentration of Nanoparticles Using Anisotropically Collapsed Gels.Anal Chem. 2022 Oct 18;94(41):14340-14348. doi: 10.1021/acs.analchem.2c02989. Epub 2022 Oct 4. Anal Chem. 2022. PMID: 36194835
-
In Situ Characterization of Binary Mixed Polymer Brush-Grafted Silica Nanoparticles in Aqueous and Organic Solvents by Cryo-Electron Tomography.Langmuir. 2015 Aug 11;31(31):8680-8. doi: 10.1021/acs.langmuir.5b01739. Epub 2015 Jul 28. Langmuir. 2015. PMID: 26174179
-
Perspectives and challenges of photon-upconversion nanoparticles - Part I: routes to brighter particles and quantitative spectroscopic studies.Anal Bioanal Chem. 2017 Oct;409(25):5855-5874. doi: 10.1007/s00216-017-0499-z. Epub 2017 Jul 14. Anal Bioanal Chem. 2017. PMID: 28710516 Review.
-
Engineered lanthanide-doped upconversion nanoparticles for biosensing and bioimaging application.Mikrochim Acta. 2022 Feb 17;189(3):109. doi: 10.1007/s00604-022-05180-1. Mikrochim Acta. 2022. PMID: 35175435 Review.
References
-
- Algar W. R., Massey M., Rees K., Higgins R., Krause K. D., Darwish G. H., Peveler W. J., Xiao Z., Tsai H.-Y., Gupta R., Lix K., Tran M. V., Kim H.. Photoluminescent Nanoparticles for Chemical and Biological Analysis and Imaging. Chem. Rev. 2021;121(15):9243–9358. doi: 10.1021/acs.chemrev.0c01176. - DOI - PubMed
MeSH terms
Substances
LinkOut - more resources
Full Text Sources
