. 2025;17(1):2506406.
doi: 10.1080/17590914.2025.2506406. Epub 2025 May 19.

Proliferating Microglia Exhibit Unique Transcriptional and Functional Alterations in Alzheimer's Disease

Affiliations

Proliferating Microglia Exhibit Unique Transcriptional and Functional Alterations in Alzheimer's Disease

Nàdia Villacampa et al. ASN Neuro. 2025.

Abstract

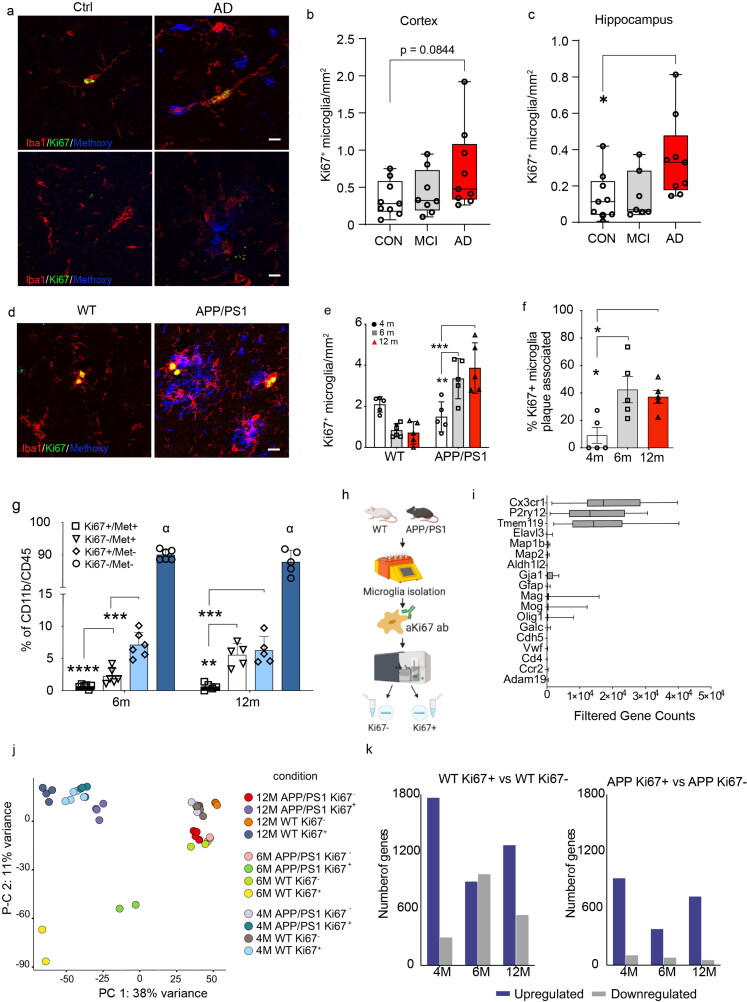
Proliferation of microglia represents a physiological process, which is accelerated in several neurodegenerative disorders including Alzheimer disease (AD). The effect of such neurodegeneration-associated microglial proliferation on function and disease progression remains unclear. Here, we show that proliferation results in profound alterations of cellular function by providing evidence that newly proliferated microglia show impaired beta-amyloid clearance in vivo. Through sorting of proliferating microglia of APP/PS1 mice and subsequent transcriptome analysis, we define unique proliferation-associated transcriptomic signatures that change with age and beta-amyloid accumulation and are characterized by enrichment of immune system-related pathways. Of note, we identify the DEAD-Box Helicase 3 X-Linked (DDX3X) as a key molecule to modulate microglia activation and cytokine secretion and it is expressed in the AD brain. Together, these results argue for a novel concept by which phenotypic and functional microglial changes occur longitudinally as a response to accelerated proliferation in a neurodegenerative environment.

Keywords: Alzheimer’s disease; inflammasome; microglia; proliferation; transcriptome.


Conflict of interest statement

No potential conflict of interest was reported by the author(s).

Figures

Figure 1.
Figure 1.
Dynamics and phenotype of microglial proliferation in Alzheimer’s disease. A) Proliferating microglia stained with Ki67 (green), beta-amyloid plaque (blue) and microglia stained with Iba1 (red) in the cortex (upper panel) and hippocampus (lower panel) of Ctrl and AD brains (scale bar = 10µm). B) Quantification of proliferating microglia in cortex in control human cases (Ctrl) (n = 9), mild cognitive impairment (MCI) (n = 8) and Alzheimer’s (AD) (n = 9). One-way ANOVA with Tukey’s multiple comparisons test. C) Quantification of proliferating microglia in hippocampus in control human cases (Ctrl) (n = 9), mild cognitive impairment (MCI) (n = 7) and Alzheimer’s (AD) (n = 9). One-way ANOVA with Tukey’s multiple comparisons test, * indicates p < 0.05 in AD compared to Ctrl. D) Proliferating microglia stained with Ki67 (green), beta-amyloid plaque stained with Methoxy (blue) and microglia stained with Iba1 (red) in WT and APP/PS1 mice at 12 months. E) Quantification of proliferating microglia in WT and APP/PS1 mice at 4 (n = 5/genotype), 6 (n = 5/genotype) and 12 months (n = 5/genotype). Two-way ANOVA with Holm-Sidak’s multiple comparisons test, ** indicates p < 0.01 compared to 4 months, *** indicates p < 0.001 compared to 6 months. F) Quantification proliferating microglia associated to an amyloid plaque in APP/PS1 mice at 4 (n = 5), 6 (n = 5) and 12 months (n = 5) expressed as % of total proliferating microglia. One-way ANOVA with Sidak’s multiple comparisons test * indicates p < 0.05 compared to 4 months. G) Quantification of amyloid content (Met+) and proliferation (Ki67+) in CD11b+/CD45+ microglia in APP/PS1 mice at 6 (n = 6) and 12 months (n = 5). Double positive microglia were almost absent. Two-way ANOVA with Tukey’s post hoc test ** indicates p = 0.0010, *** indicates p = 0.0002, **** indicates p < 0.001. H) Schematic figure representing the experimental design to obtain proliferating microglia from WT and APP/PS1 mice at 4, 6 and 12 m for bulk RNA-seq. I) Filtered gene counts of microglia specific genes demonstrating purity of the cells obtained. J) PCA plot showing unsupervised clustering of groups by both proliferation state (PC1) and age (PC2). K) Bar plots of DEGs upregulated (blue) and downregulated (grey) genes between proliferating and non-proliferating cells at 4, 6 and 12 months for WT (left) and APP/PS1 (right) mice.
Figure 2.
Figure 2.
Effects of disease in the transcriptome of microglia. A,B) Volcano plots for disease associated DEGs for proliferating cells at 6 m and 12 m in WT vs APP/PS1. C) Gene ontology analysis of 35 upregulated genes shared between APP vs WT Ki67+ microglia at 6 m and 12 m. D) Protein-protein interaction network form STRING online analysis website from the DEGs found at 6 m and 12 m between APP vs WT Ki67+ microglia. Network nodes represent proteins and edges represent protein-protein associations. Empty nodes represent proteins of unknown 3D structure, while filled represent proteins with predicted or known 3D structure (PPI enrichment value <1.0e-16). E) Pathway enrichment analysis of the 35 upregulated genes shared at 6 m and 12 m. F) Graph representing inflammasome-related genes in proliferating microglia of APP/PS1 mice at 6 m when compared to WT. ** indicates p < 0.01. G) Representative scatter plots of mice analyzed for microglial amyloid content after intraperitoneal injection of methoxy-X04 (Mx04) H) Quantification of amyloid content (Met+) and proliferation (Ki67+) in CD11b+/CD45+ microglia in APP/PS1 and APP/PS1xASC-/- mice at 6 months. Two-way ANOVA with Tukey’s multiple comparisons test, ** indicates p < 0.01 compared to Ki67+ microglia in the APP/PS1xASC-/-, *** indicates p < 0.001 compared to Mx04+ microglia in the APP/PS1xASC-/- mice. (n = 6 APP/PS1, n = 6 APP/PS1xASC-/- mice).
Figure 3.
Figure 3.
DDX3X is expressed on microglia in Alzheimer’s disease. A) Venn diagrams representing overlap with lipidhigh microglia of 18 m mice (lipid, purple) and the disease associated microglia (DAM, green) with APP vs WT Ki67+ microglia at 6 m (6 m Ki67+, left, red) and APP vs WT Ki67+ microglia at 12 m (12 m Ki67+, right, red). B) Expression of several genes associated with tolerogenic (green) and neurodegenerative (red) microglia in proliferating microglia of APP/PS1 compared to WT at 6 m (left) and 12 m (right). * indicates p < 0.05, ** indicates p < 0.01, *** indicates p < 0.001, **** indicates p < 0.0001. C) Protein-protein interaction network form STRING online analysis from DEGs found uniquely at 12 m. Network nodes represent proteins and edges represent protein-protein associations. Empty nodes represent proteins of unknown 3D structure, while filled represent proteins with predicted or known 3D structure (PPI enrichment value = 0.000134). D) Blots of cell lysates of isolated adult WT and APP/PS1 microglia at 12 m stained for DDX3X and alpha-tubulin, as a loading control. E) Quantification of DDX3X levels in isolated adult microglia, normalized to alpha-tubulin. WT (n = 5), APP/PS1 (n = 11), Student’s t-test, ** indicates p < 0.01 compared to the corresponding time point in the WT. F) Release of IL-1β and cytotoxicity in primary WT microglia cells after NLRP3 inflammasome activation and treatment with increasing concentrations of DDX3X inhibitor (RK-33). G) Blots of human brain homogenates from control (Ctrl), mild cognitive impairment (MCI) and Alzheimer’s disease (AD) stained for DDX3X. H) Quantification of the three DDX3X fragments in human brain homogenates from control (Ctrl) (n = 5), mild cognitive impairment (MCI) (n = 5) and Alzheimer’s disease (AD) (n = 5), normalized to alpha-tubulin. I) Representative microphotographs of human brain from controls (Ctrl) and AD patients (AD) showing DDX3X (green) staining in the neuronal soma in plaque-free regions and in microglia (anti-Iba1, red) in plaque regions, stained with Methoxy (blue).

Similar articles

References

    1. Askew, K., Li, K., Olmos-Alonso, A., Garcia-Moreno, F., Liang, Y., Richardson, P., Tipton, T., Chapman, M. A., Riecken, K., Beccari, S., Sierra, A., Molnár, Z., Cragg, M. S., Garaschuk, O., Perry, V. H., & Gomez-Nicola, D. (2017). Coupled proliferation and apoptosis maintain the rapid turnover of microglia in the adult brain. Cell Reports, 18(2), 391–405. 10.1016/j.celrep.2016.12.041 - DOI - PMC - PubMed
    1. Bachiller, S., Jiménez-Ferrer, I., Paulus, A., Yang, Y., Swanberg, M., Deierborg, T., & Boza-Serrano, A. (2018). Microglia in neurological diseases: A road map to brain-disease dependent-inflammatory response. Frontiers in Cellular Neuroscience, 12, 488. 10.3389/fncel.2018.00488 - DOI - PMC - PubMed
    1. Biswas, K. (2023). Microglia mediated neuroinflammation in neurodegenerative diseases: A review on the cell signaling pathways involved in microglial activation. Journal of Neuroimmunology, 383, 578180. 10.1016/j.jneuroim.2023.578180 - DOI - PubMed
    1. Bray, N. L., Pimentel, H., Melsted, P., & Pachter, L. (2016). Near-optimal probabilistic RNA-seq quantification. Nature Biotechnology, 34(5), 525–527. 10.1038/nbt.3519 - DOI - PubMed
    1. Chiu, I. M., Morimoto, E. T., Goodarzi, H., Liao, J. T., O’Keeffe, S., Phatnani, H. P., Muratet, M., Carroll, M. C., Levy, S., Tavazoie, S., Myers, R. M., & Maniatis, T. (2013). A neurodegeneration-specific gene-expression signature of acutely isolated microglia from an amyotrophic lateral sclerosis mouse model. Cell Reports, 4(2), 385–401. 10.1016/j.celrep.2013.06.018 - DOI - PMC - PubMed

Publication types

MeSH terms

LinkOut - more resources