

Approximation of EVLWI in severe COVID-19 pneumonia using quantitative imaging techniques: an observational study
- PMID: 40388016
- PMCID: PMC12089548
- DOI: 10.1186/s40635-025-00752-w
Approximation of EVLWI in severe COVID-19 pneumonia using quantitative imaging techniques: an observational study
Abstract
Background: This study aimed to approximate the level of extravascular lung water (EVLW) in patients with severe COVID-19 pneumonia using quantitative imaging techniques. The elevation of EVLW is known to correlate with the degree of diffuse alveolar damage and linked with the mortality of critically ill patients. Transpulmonary thermodilution (TPTD) is the gold standard technique to estimate the total amount of EVLW, but it is invasive and requires specialized equipment and trained personnel.
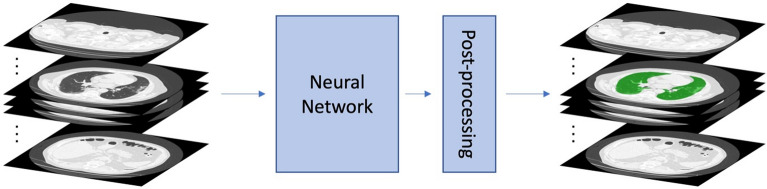
Methods: The study included patients with severe COVID-19 who required chest CT scanning within the first 48 h of Intensive Care Unit (ICU) admission and had TPTD monitoring. Using in-house software tools for automatic semantic segmentation, lung masks were obtained for estimating the EVLW content. The results were compared with the TPTD measurements.
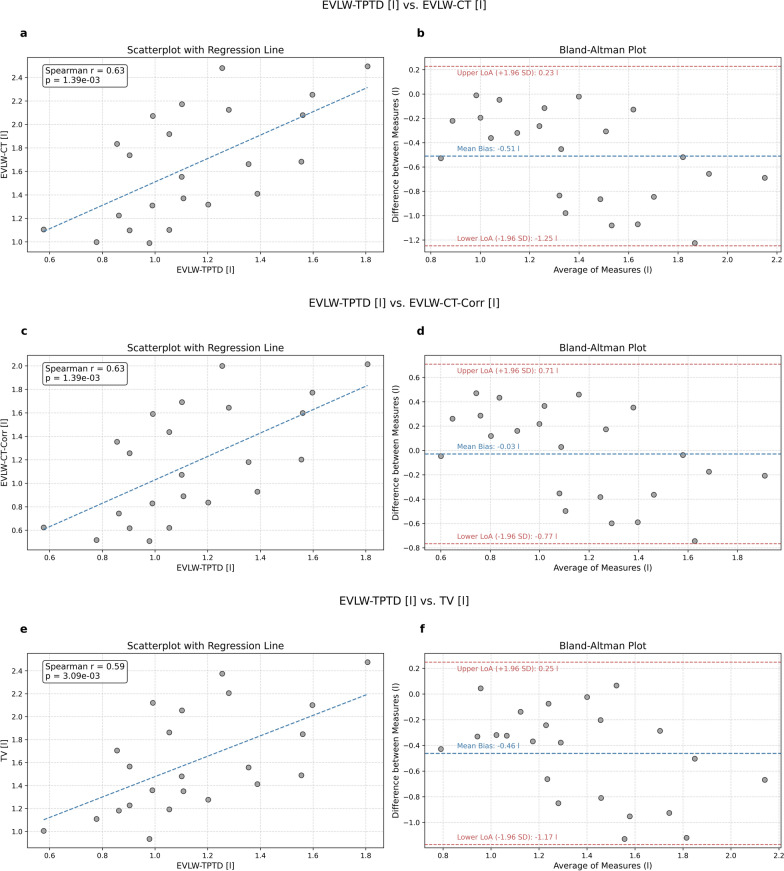
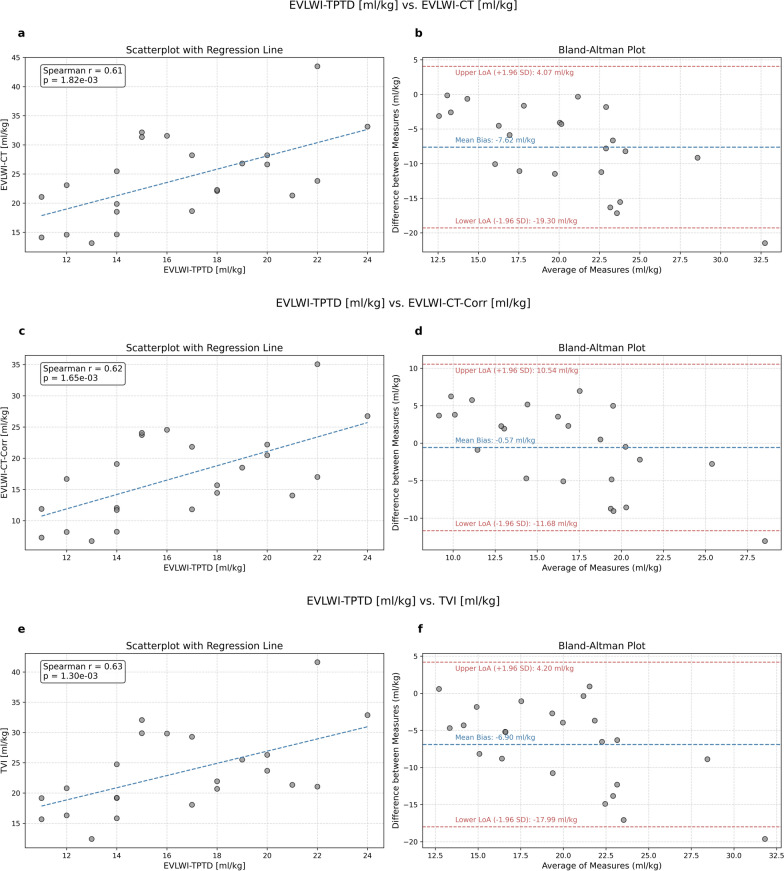
Results: The results demonstrate a significant correlation between EVLW-TPTP measured by thermodilution and EVLW-CT estimated from the patient's CT-image (r = 0.629, p = 0.0014).
Conclusion: The study showed that quantitative imaging techniques using chest CT-scans could be used as a convenient and low-cost option for ICUs without TPTD equipment for the assessment of EVLW in severe COVID-19 pneumonia.
Keywords: ARDS; Extravascular lung water; Pulmonary edema; Quantitative image analysis.
© 2025. The Author(s).
Conflict of interest statement
Declarations. Ethics approval and consent to participate: This observational study was approved (Approval No. 178/20S) by the Ethics Committee of University hospital Klinikum rechts der Isar and written informed consent was obtained from all patients or their legal representatives. Consent for publication: Not applicable. Competing interests: JB, KRW, KWM, and W.W. hold shares of Ebenbuild. All other authors declare no competing interests.
Figures

References
-
- Al-Mashat M, Jögi J, Carlsson M, Borgquist R, Ostenfeld E, Magnusson M, Bachus E, Rådegran G, Arheden H, Kanski M (2020) Increased pulmonary blood volume variation in patients with heart failure compared to healthy controls: a noninvasive, quantitative measure of heart failure. J Appl Physiol 128:324–337. 10.1152/japplphysiol.00507.2019 - DOI - PubMed
-
- Gavelli F, Shi R, Teboul J-L, Azzolina D, Mercado P, Jozwiak M, Chew MS, Huber W, Kirov MY, Kuzkov VV, Lahmer T, Malbrain MLNG, Mallat J, Sakka SG, Tagami T, Pham T, Monnet X (2022) Extravascular lung water levels are associated with mortality: a systematic review and meta-analysis. Crit Care 26:202. 10.1186/s13054-022-04061-6 - DOI - PMC - PubMed
-
- Hermann EA, Motahari A, Hoffman EA, Allen N, Bertoni AG, Bluemke DA, Eskandari A, Gerard SE, Guo J, Hiura GT, Kaczka DW, Michos ED, Nagpal P, Pankow J, Shah S, Smith BM, Hinckley Stukovsky K, Sun Y, Watson K, Barr RG (2022) Pulmonary blood volume among older adults in the community: the MESA lung study. Circulation. 10.1161/CIRCIMAGING.122.014380 - DOI - PMC - PubMed
LinkOut - more resources
Full Text Sources
