. 2025 May 19;20(5):e0320395.
doi: 10.1371/journal.pone.0320395. eCollection 2025.

Conditioning invasive bigheaded carps (Hypophthalmichthys molitrix and H. nobilis)to enhance the efficacy of acoustic and CO2 deterrents

Affiliations

Conditioning invasive bigheaded carps (Hypophthalmichthys molitrix and H. nobilis)to enhance the efficacy of acoustic and CO2 deterrents

Jack A Culotta et al. PLoS One. .

Abstract

Invasive bigheaded carps (Hypophthalmichthys molitrix and H. nobilis) have caused substantial ecological and economic damage throughout the Mississippi River Basin and expanded their range threatening the Laurentian Great Lakes. Broadband acoustic deterrents have shown promise in repelling carp and are currently being assessed in navigational lock chambers on the Mississippi River. These nonphysical deterrents permit vessel navigation while reducing carp passage. However, no single deterrent is 100% effective and fish may habituate to the sound after repeated playback. Carp exhibit aversive behaviors to carbon dioxide, which suggests combining these two stimuli into one deterrent system could extend the effective duration of sound and reduce the frequency of carbon dioxide ([Formula: see text]) application. We conditioned bigheaded carps to associate broadband sound from outboard boat motors (0.06-5 kHz, [Formula: see text]150 dB re. 1 [Formula: see text]Pa) with [Formula: see text] application ([Formula: see text]35,000 ppm) in small (80 L) and large (3475 L) two-choice shuttle tanks. We compared negative phonotaxis responses over one to four weeks between fish conditioned with sound and [Formula: see text], sound and air, or sound alone. Similar [Formula: see text] avoidance thresholds were found across tank sizes and species. Conditioning treatment did not affect time to leave the sound chamber, confirming sound alone remains a deterrent for all fish. Carp conditioned with [Formula: see text] took longer to return to the sound chamber than control treatments. Control fish were closer to the speaker during playback than during the pre-sound period, while fish conditioned with [Formula: see text] were not significantly closer. Conditioning paradigms may extend the effective duration of nonphysical deterrents for bigheaded carps. Conditioning with [Formula: see text] may also increase proactive flight-responses over reactive freeze-responses. Findings could be applied to increase nonphysical barrier effectiveness at locks along the Mississippi River and help protect the Laurentian Great Lakes from invasion.


Conflict of interest statement

The authors have declared that no competing interests exist.

Figures

Fig 1
Fig 1. CO2 threshold.</figuretext> Boxplots indicate the median pCO2 concentration threshold that resulted in fish leaving the CO2 side of the shuttle tank. Boxplots display the median ± quartiles with whiskers extending to 1.5 times IQR. Data points represent individual trials from small (red) and large (blue) tanks. There was no significant difference in threshold between species (Kruskal-Wallis rank sum test, X2=2.07, p = 0.15).
Fig 2
Fig 2. Exit time in the small tank.
Box plots indicate the median time that unconditioned (blue) or CO2 and sound conditioned schools (red) exited the small sound chamber after sound onset. Boxplots include the median ± quartiles for each treatment. Whiskers extend to 1.5 times IQR. The difference between conditioned and unconditioned schools on the first day was not significant (Welch Two Sample t-test, df = 1.95, t = 1.95, p = 0.07).
Fig 3
Fig 3. Exit time in the large tank.
Box plots indicate the median time that bighead carp conditioned with air and sound (blue) or CO2 and sound (red) exited the large sound chamber after sound onset. Boxplots display the median ± quartiles with whiskers extending to 1.5 times IQR. Bighead carp conditioned with CO2 exited the sound chamber significantly faster when the sound stimulus was playing than during the pre-sound period on the first day (Paired t-test, t = 2.72, df = 20, p = 0.013).
Fig 4
Fig 4. Return time in the small tank.
Box plots indicate the median time that conditioned carp (red) and unconditioned carp (blue) spent in the opposite chamber after sound onset. Boxplots display the median ± quartiles with whiskers extending to 1.5 times IQR. * indicates significantly different medians (Welch Two Sample t-test, df = -2.34, t = -2.34, p = 0.04).
Fig 5
Fig 5. Return time in the large tank.
Boxplots include the median ± quartiles for each period. Whiskers extend to 1.5 times IQR. Control carp returned to the sound chamber more quickly than they had during the pre-sound period for the first (Paired t-test, t = 2.64, df = 20, p = 0.016), second (Paired t-test, t = 3.01, df = 16, p = 0.009, and third days (Paired t-test, t = 2.91, df = 9, p = 0.020). Carp conditioned with CO2 did not return significantly faster until the third day (Paired t-test, t = 2.30, df = 16, p = 0.035).
Fig 6
Fig 6. Stationary time (large tank).
Bighead carp from both conditioning treatments exhibited freeze-responses to sound playback. Boxplots include median ± quartiles for each conditioning treatment and sound stimulus. Whiskers extend to 1.5 times IQR. Points indicate responses outside of the IQR.
Fig 7
Fig 7. Distance to the speaker (large tank).
Boxplots include the median ± quartiles for each period. Whiskers extend to 1.5 times IQR. Carp conditioned with air remained significantly closer to the active speaker on the first (Paired t-test, t = 8.89, df = 26, p < 0.0001), third (Paired t-test, t = 6.35, df = 25, p < 0.0001), and seventh days (Paired t-test, t = 4.64, df = 25, p < 0.0001). In contrast, carp conditioned with CO2 did not remain significantly closer to the speaker during playback until the seventh day (Paired t-test, t = 3.51, df = 29, p = 0.001).
Fig 8
Fig 8. Duration in sound chamber (large tank).
Boxplots include the median ± 25% and 75% quartiles for each period. Whiskers extend to 1.5 times IQR. Control carp spent significantly more time in the sound chamber during playback compared to the pre-sound period on the first (Paired t-test, t = -8.36, df = 28, p < 0.0001), third (Paired t-test, t = -5.59, df = 26, p < 0.0001), and seventh days (Paired t-test, t = -3.84, df = 29, p < .001). Carp conditioned with CO2 did not spend significantly more time in the sound chamber on the first and third days, but did on the seventh day (Paired t-test, t = -3.58, df = 29, p = .001).
Fig 9
Fig 9. Sound pressure level sound maps.
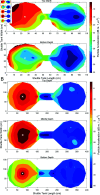
Median RMS SPL (dB re. 1 μPa @ 50 - 5 kHz) are plotted at 33 points during sound presentation in the left chamber of the A) small shuttle box, B) and 53 points in the large shuttle tank. SPL was measured at two depths in the small tank, and three depths in the large. A total of 225 hydrophone locations were used. The active speaker is indicated with a white X.
Fig 10
Fig 10. Particle acceleration sound maps.
PA (dB re. 1 ms2) are plotted at 33 points during sound presentation in the left chamber of the A) small shuttle box, B) and 53 points in the large shuttle tank. PA was measured at two depths in the small tank, and three depths in the large. A total of 225 hydrophone locations were used. The active speaker is indicated with a white X.
Fig 11
Fig 11. A. Water pH is plotted versus time (seconds) in the large and small shuttle tanks.
Time zero represents CO2 bubble initiation in the experimental chamber. The dotted line indicates the approximate threshold for CO2 avoidance in bigheaded carps. B. Model to predict pCO2 from pH in the large tank. Dissolved CO2 is plotted versus pH in the large tank. Water samples were collected from the increasing pCO2 chamber after first exit and three minutes after the last exit. The solid line represents the model described by the equation above (n = 72, F = 209, p < 0.0001, adj R2=0.854). Water pH was used as a proxy to determine CO2 concentrations according to the model in the large tank.

References

    1. Kolar CS, Chapman DC, Courtenay WR, Jr, Housel CM, Williams JD, Jennings DP. Bigheaded carps: a biological synopsis and environmental risk assessment. Am Fish Soc Spec Publ. 2007;33:i–xiv, 1–204. doi: 10.47886/9781888569797 - DOI
    1. Noatch MR, Suski CD. Non-physical barriers to deter fish movements. Environ Rev. 2012;20(1):71–82. doi: 10.1139/a2012-001 - DOI
    1. Cudmore B, Mandrak NE, Dettmers JM, Chapman DC, Kolar CS. Binational ecological risk assessment of bigheaded carps (Hypophthalmichthys spp.) for the Great Lakes Basin. Report. Ottawa, ON; 2012. Report No.: 2011/114.
    1. Putland RL, Mensinger AF. Acoustic deterrents to manage fish populations. Rev Fish Biol Fisheries. 2019;29:789–807. doi: 10.1007/s11160-019-09583-x - DOI
    1. Riesgraf AT, Finger JS, Zielinski DP, Dennis CE, Whitty JM, Sorensen PW. Evaluation of a broadband sound projected from the gates of a navigation lock in the Mississippi River shows it to be a weak deterrent for common carp and unable to block passage. Manage Biol Invasions. 2022;13(1):220–32.