. 2025 Jul;7(7):e11761.
doi: 10.1002/acr2.11761. Epub 2025 May 19.

Whole-Blood RNA Sequencing Profiling of Patients With Rheumatoid Arthritis Treated With Tofacitinib

Affiliations

Whole-Blood RNA Sequencing Profiling of Patients With Rheumatoid Arthritis Treated With Tofacitinib

Chiara Bellocchi et al. ACR Open Rheumatol. 2025 Jul.

Abstract

Objective: Patients with rheumatoid arthritis (RA) often fail to respond to therapies, including JAK inhibitors (JAKi), and treatment allocation is made via a trial-and-error strategy. A comprehensive analysis of responses to JAKi, including tofacitinib, by RNA sequencing (RNAseq) would allow the discovery of transcriptomic markers with a two-fold meaning: (1) an improved knowledge about the mechanisms of response to treatment (inference modeling) and (2) the definition of features that may be useful in treatment optimization and assignment (predictive modeling).

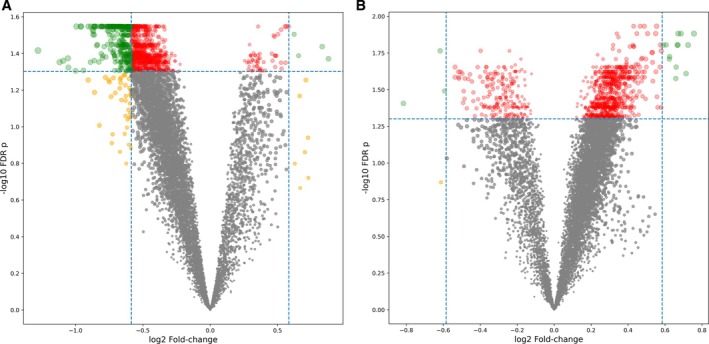
Methods: Thirty-three patients with active RA were treated with a tofacitinib dose of 5 mg twice a day for 24 weeks and evaluated for EULAR Disease Activity Score in 28 joints using the C-reactive protein level response. Whole-blood RNA was collected before and after treatment to perform RNAseq transcriptome analysis. Linear models were used to determine differentially expressed genes (DEGs) (1) at baseline according to clinical responses and (2) in the pre-post comparison after tofacitinib treatment and in relation to EULAR responses. The capability of DEGs to predict a successful treatment was tested via machine learning modeling after extensive internal validation.

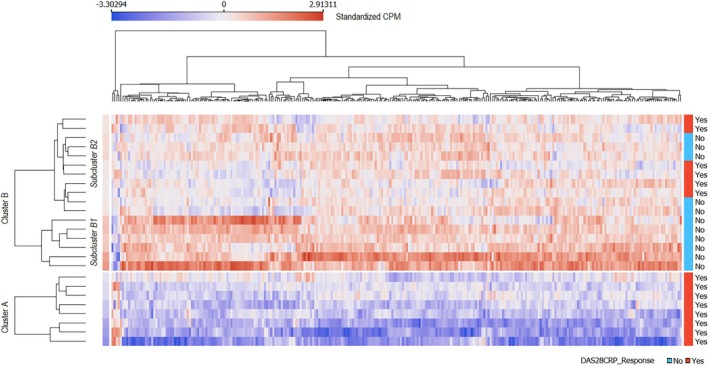
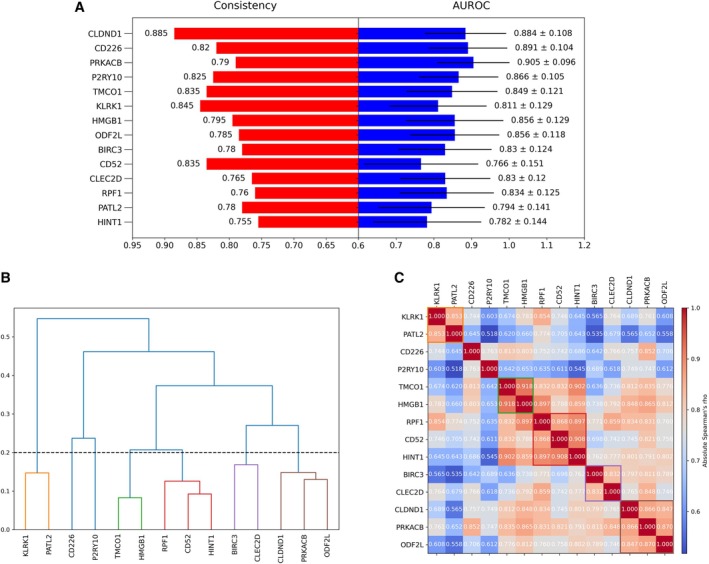
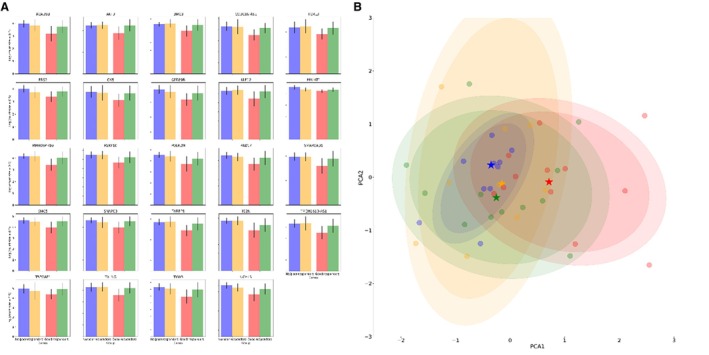
Results: Of 26 patients who completed the study (per-protocol analysis), 15 (57.7%) achieved good responses, and 7 (26.9%) and 4 (15.3%) had moderate and no responses, respectively. Overall, 273 baseline genes were significantly associated with the attainment of good responses, contributing to several pathways linked to the immune system or RA pathogenesis (eg, citrullination processes and the negative regulation of natural killer function). The expression of several molecules was reverted by tofacitinib when good responses were reached, including AKT3, GK5, KLF12, FCRL3, BIRC3, TSPOAP1, and P2RY10. Finally, we isolated 14 markers that singularly were capable of predicting the attainment of good responses, including, NKG2D, CD226, CLEC2D, and CD52.

Conclusion: Whole-blood transcriptome analysis of patients with RA treated with tofacitinib identified genes whose expression may be relevant in prognostication and understanding the mechanisms of responses to therapy.


Figures

Figure 1
Figure 1
Volcano plots of DEGs in relation to responses. Volcano plots showing the statistical significance (−log10 FDR‐corrected P value) versus the magnitude of change (log2 FC) in the comparison of patients attaining or not attaining EULAR DAS28‐CRP responses after tofacitinib treatment (A) at baseline or (B) in the pre‐post analysis. Genes with P < 0.05 and |log2 FC| > 0.585 are highlighted in green. DAS28‐CRP, Disease Activity Score in 28 joints using the C‐reactive protein level; DEG, differentially expressed gene; FC, fold change; FDR, false discovery rate.
Figure 2
Figure 2
Clustering of gene expression at baseline after differential expression analysis. The distribution of EULAR DAS28‐CRP responses is highlighted in the rightmost bar. Cluster A is characterized by low standardized CPM in most genes and good EULAR responses, whereas subcluster B1 is characterized by high expression and lack of good EULAR responses; subcluster B2 presents a more mixed expression and response pattern. Averages of case‐wise standardized CPM are highlighted in the left bar. CPM, counts per million; DAS28‐CRP, Disease Activity Score in 28 joints using the C‐reactive protein level.
Figure 3
Figure 3
Top‐ranking predictive features in ML models. Top‐ranking features selected in relation to their capability of predicting EULAR DAS28‐CRP responses in ML models after 2000 runs of bootstrap with aggregation and validation (bagging). Consistency is presented as the percentage of time the feature was found to be differentially expressed in in‐bag samples. AUROC is presented as mean ± SD for the selected feature in OOB samples. Target of prediction: EULAR DAS28‐CRP good responses. (A) Visualization of relevant features (consistency > 0.75 across in‐bag samples and mean OOB AUROC > 0.75). (B) Correlation dendrogram among relevant features. (C) Correlation matrix. AUROC, area under the receiver operating characteristic curve; DAS28‐CRP, Disease Activity Score in 28 joints using the C‐reactive protein level; ML, machine learning; OOB, out‐of‐bag.
Figure 4
Figure 4
Change in gene expression in the pre‐post analysis. (A) Significant transcripts in the pre‐post analysis. The bars show the log2 (CPM + 0.5) in relation to the EULAR DAS28‐CRP good versus none or poor responses. Blue and red bars represent baseline values, yellow and green bars represent end‐of‐treatment values. (B) Scatterplot of the two PCs of significant transcripts in relation to time and response to treatment. Red dots represent good responders at baseline; green dots represent good responders at end of study; blue dots represent none or poor responders at baseline; yellow dots represent none or poor responders at end of study; “star” points indicate the mass center of clusters, and ellipses indicate the 90% and 95% confidence intervals of PC projections. The shift in gene transcription is substantial only for responders in cluster A (red to green) and minimal for responders in cluster B (blue to yellow). CPM, counts per million; DAS28‐CRP, Disease Activity Score in 28 joints using the C‐reactive protein level; PC, principal component.

Similar articles

References

    1. Luurssen‐Masurel N, Weel AEAM, Hazes JMW, et al; tREACH group investigators . The impact of different (rheumatoid) arthritis phenotypes on patients’ lives. Rheumatology (Oxford) 2021;60(8):3716–3726. - PMC - PubMed
    1. Heutz J, de Jong PHP. Possibilities for personalised medicine in rheumatoid arthritis: hype or hope. RMD Open 2021;7(3):e001653. - PMC - PubMed
    1. Smolen JS, Landewé RBM, Bijlsma JWJ, et al. EULAR recommendations for the management of rheumatoid arthritis with synthetic and biological disease‐modifying antirheumatic drugs: 2019 update. Ann Rheum Dis 2020;79(6):685–699. - PubMed
    1. Kosorok MR, Laber EB. Precision Medicine. Annu Rev Stat Appl 2019;6(1):263–286. - PMC - PubMed
    1. Lowe R, Shirley N, Bleackley M, et al. Transcriptomics technologies. PLOS Comput Biol 2017;13(5):e1005457. - PMC - PubMed