

Benchmarking Differential Abundance Tests for 16S microbiome sequencing data using simulated data based on experimental templates
- PMID: 40388544
- PMCID: PMC12088514
- DOI: 10.1371/journal.pone.0321452
Benchmarking Differential Abundance Tests for 16S microbiome sequencing data using simulated data based on experimental templates
Abstract
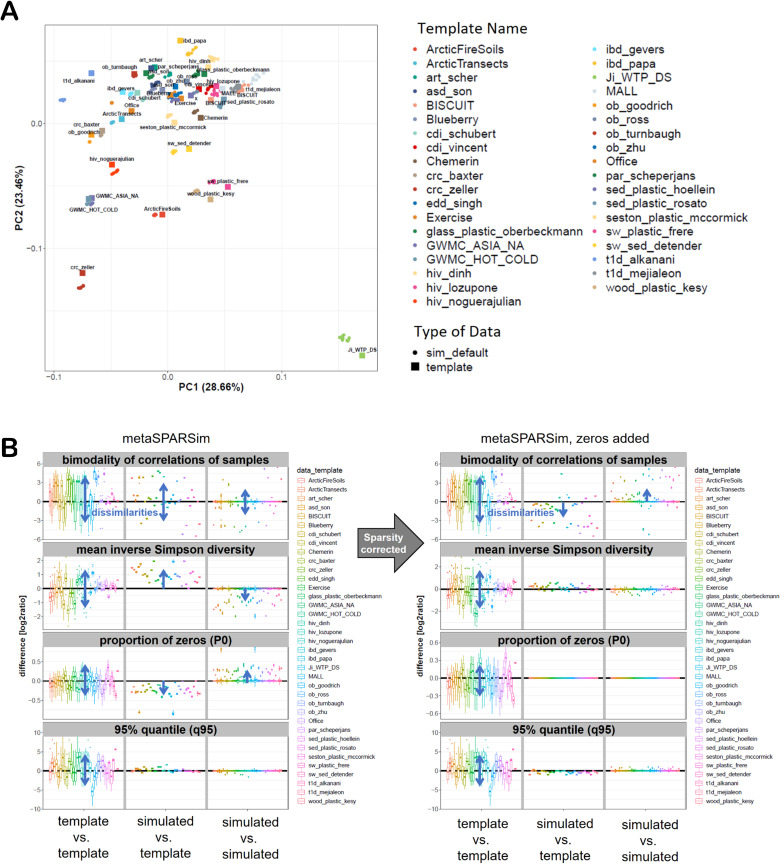
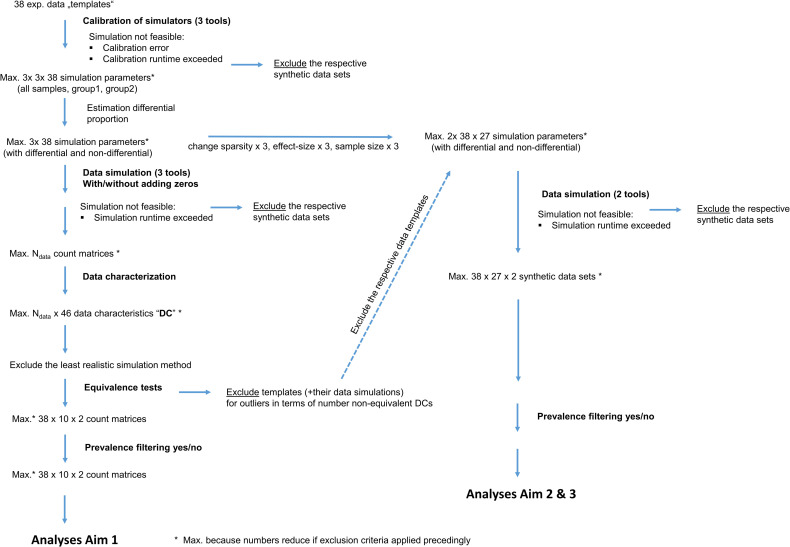
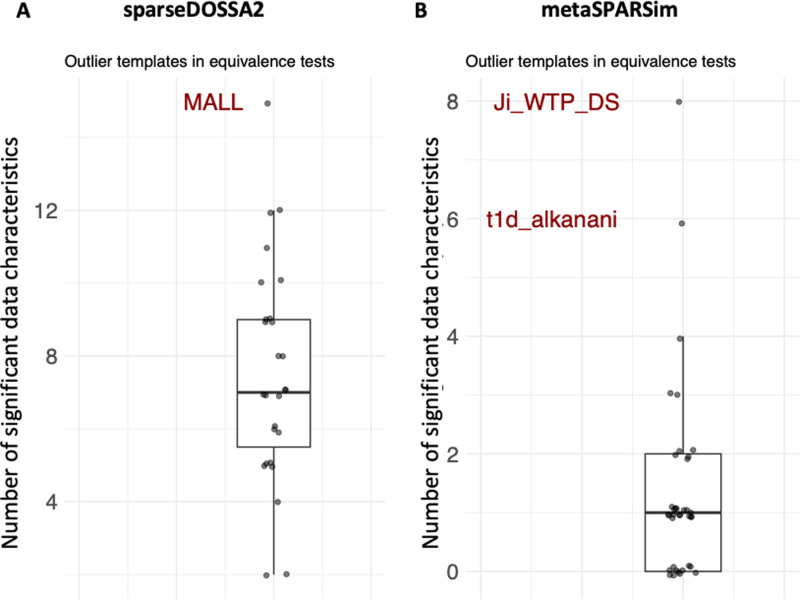
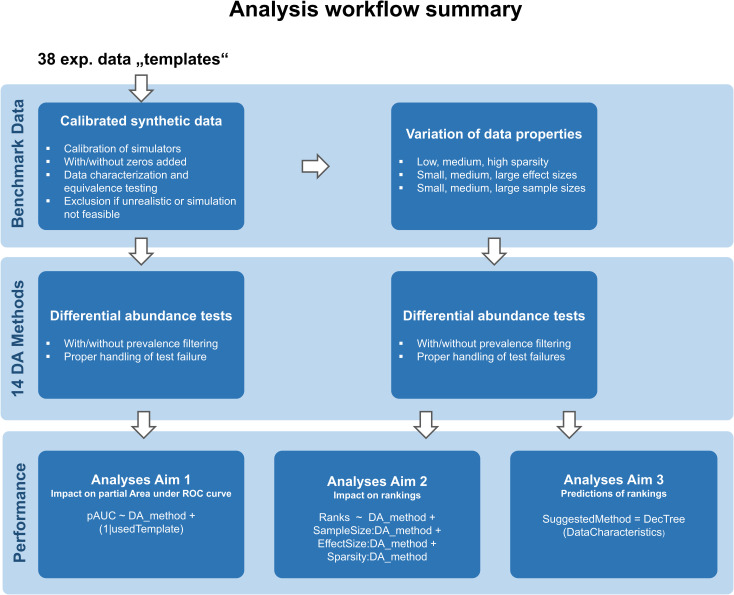
Differential abundance (DA) analysis of metagenomic microbiome data is essential for understanding microbial community dynamics across various environments and hosts. Identifying microorganisms that differ significantly in abundance between conditions (e.g., health vs. disease) is crucial for insights into environmental adaptations, disease development, and host health. However, the statistical interpretation of microbiome data is challenged by inherent sparsity and compositional nature, necessitating tailored DA methods. This benchmarking study aims to simulate synthetic 16S microbiome data using metaSPARSim (Patuzzi I, Baruzzo G, Losasso C, Ricci A, Di Camillo B. MetaSPARSim: a 16S rRNA gene sequencing count data simulator. BMC Bioinformatics. 2019;20:416. https://doi.org/10.1186/s12859-019-2882-6 PMID: 31757204) MIDASim (He M, Zhao N, Satten GA. MIDASim: a fast and simple simulator for realistic microbiome data. Available from: https://doi.org/10.1101/2023.03.23.533996), and sparseDOSSA2 (Ma S, Ren B, Mallick H, Moon YS, Schwager E, Maharjan S, et al. A statistical model for describing and simulating microbial community profiles. PLOS Comput Biol. 2021;17(9):e1008913. https://doi.org/10.1371/journal.pcbi.1008913 PMID: 34516542) , leveraging 38 real-world experimental templates (S3 Table) previously utilized in a benchmark study comparing DA tools. These datasets, drawn from diverse environments such as human gut, soil, and marine habitats, serve as the foundation for our simulation efforts. We employ the same 14 DA tests that were previously used with the same experimental data in benchmark studies alongside 8 DA tests that were developed subsequently. Initially, we will generate synthetic data closely mirroring the experimental datasets, incorporating a known truth to cover a broad range of real-world data characteristics. This approach allows us to assess the ability of DA methods to recover known true differential abundances. We will further simulate datasets by altering sparsity, effect size, and sample size, thus creating a comprehensive collection for applying the 22 DA tests. The outcomes, focusing on sensitivities and specificities, will provide insights into the performance of DA tests and their dependencies on sparsity, effect size, and sample size. Additionally, we will calculate data characteristics (S1 and S2 Table) for each simulated dataset and use a multiple regression to identify informative data characteristics influencing test performance. Our prior study, where we used simulated data without incorporating a known truth, demonstrated the feasibility of using synthetic data to validate experimental findings. This current study aims to enhance our understanding by systematically evaluating the impact of known truth incorporation on DA test performance, thereby providing further information for the selection and application of DA methods in microbiome research.
Copyright: © 2025 Kohnert, Kreutz. This is an open access article distributed under the terms of the Creative Commons Attribution License, which permits unrestricted use, distribution, and reproduction in any medium, provided the original author and source are credited.
Conflict of interest statement
The authors have declared that no competing interests exist.
Figures
Similar articles
-
Computational Study Protocol: Leveraging Synthetic Data to Validate a Benchmark Study for Differential Abundance Tests for 16S Microbiome Sequencing Data.F1000Res. 2025 Jan 2;13:1180. doi: 10.12688/f1000research.155230.2. eCollection 2024. F1000Res. 2025. PMID: 39866725 Free PMC article.
-
metaSPARSim: a 16S rRNA gene sequencing count data simulator.BMC Bioinformatics. 2019 Nov 22;20(Suppl 9):416. doi: 10.1186/s12859-019-2882-6. BMC Bioinformatics. 2019. PMID: 31757204 Free PMC article.
-
MIDASim: a fast and simple simulator for realistic microbiome data.Microbiome. 2024 Jul 22;12(1):135. doi: 10.1186/s40168-024-01822-z. Microbiome. 2024. PMID: 39039570 Free PMC article.
-
Investigating differential abundance methods in microbiome data: A benchmark study.PLoS Comput Biol. 2022 Sep 8;18(9):e1010467. doi: 10.1371/journal.pcbi.1010467. eCollection 2022 Sep. PLoS Comput Biol. 2022. PMID: 36074761 Free PMC article. Review.
-
Current challenges and best-practice protocols for microbiome analysis.Brief Bioinform. 2021 Jan 18;22(1):178-193. doi: 10.1093/bib/bbz155. Brief Bioinform. 2021. PMID: 31848574 Free PMC article. Review.
References
MeSH terms
Substances
LinkOut - more resources
Full Text Sources
