. 2025 May 27;122(21):e2414316122.
doi: 10.1073/pnas.2414316122. Epub 2025 May 19.

Imaging a concussion and the ensuing immune response at the blood-brain barrier

Affiliations

Imaging a concussion and the ensuing immune response at the blood-brain barrier

Rita H Nguyen et al. Proc Natl Acad Sci U S A. .

Abstract

Concussions can cause debilitating symptoms despite no evidence of structural changes on diagnostic imaging. The cellular events occurring in the brain parenchyma following concussion, especially repetitive concussion, are not well elucidated. We developed a concussion model to induce a confined area of injury without causing frank hemorrhage. Using intravital microscopy, we observe activation of the vasculature that supported neutrophil rolling and platelet adhesion but no overt cellular recruitment from blood into brain parenchyma. Activated resident, not monocyte-derived, macrophages relocated to the injury site via Cx3cr1 and phagocytosed dysfunctional/detached astrocytes via scavenger receptors and TLR4, particularly after repetitive concussion. Additionally, microglia sealed areas of blood-brain barrier (BBB) disruption via purinergic pathways. Using a splitCre approach to dissect microglia and perivascular macrophages, we show that microglial invasion into the injury site is key to reducing BBB disruption. Our data suggest that microglia repair the BBB following concussion, but in doing so significantly alter the cellular ultrastructure of the brain milieu.

Keywords: astrocytes; blood–brain barrier; concussion; microglia; traumatic brain injury.


Conflict of interest statement

Competing interests statement:The authors declare no competing interest.

Figures

Fig. 1.
Fig. 1.
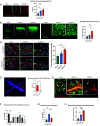
A closed skull concussion model does not result in invasion of peripheral immune cells. (A) C57 whole mouse brains demonstrate no signs of macroscopic injury in a closed skull TBI model compared to visible contusion in an open skull injury. (B) Brain slices incubated with 2,3,5-triphenyltetrazolium chloride (TTC) show no signs of ischemic injury in a closed skull model versus areas of nonviable tissue (yellow squares) in an open-skull injury model (Left). Quantification of percent of nonviable brain from TTC slice image analysis (Right). Data are expressed as mean ± SEM; individual points represent individual animals. One-way ANOVA compared to sham with Dunnett’s multiple comparisons test, ****P < 0.0001. (C) Whole brain stitched fluorescent confocal microscopy images in the LysM-gfp mouse show infiltration of neutrophils and/or monocytes (green, gfp) in open versus closed skull injury. (Scale bar, 200 μm.) Quantification of neutrophils/monocytes in whole brain slice imaging, ***P = 0.0005, unpaired two-tailed t test. (D) Intravital confocal imaging of mouse brain following closed skull injury shows neutrophil (red, PE) trafficking to the vasculature increases following CON 1X and CON 2X, with resolution beginning at 24 h. n = 3 to 5 per time point, per injury group. (Scale bar, 40 μm.) (E) Intravital confocal microscopy of C57 mouse shows a neutrophil (red, PE) traveling through the vasculature but no neutrophil extravasation following CON 1X or CON 2X, n = 3 per time point, per injury group. (Scale bar, 20 μm.)
Fig. 2.
Fig. 2.
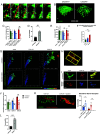
Microglia become activated in response to BBB damage. (A) Intravital imaging of C57BL/6 mice following injury. Brain surface stained with propidium iodide. One-way ANOVA, *P = 0.03, **P = 0.002. (Scale bar, 20 μm.) (B) Intravital multiphoton microscopy images of CX3CR1-gfp/wt mice. Left, xyz 3D view stack images. (Scale bar, each square = 30 μm.) Middle, extended focus z-stack images. (Scale bar, 50 μm.) Right, quantification. Microglia (green, gfp) become activated and migrate to the superficial cortical site of injury following TBI. One-way ANOVA, **P = 0.004, ***P = 0.0008. (C) Images (Left) and quantification (Right) of the number of microglia (individually colored) intimately associated with vasculature (red) following brain injury. One-way ANOVA, *P = 0.01, ***P = 0.005. (Scale bar, 50 μm.) (D) Intravital imaging (Left) and quantification (Right) demonstrating Ms4a3-positive macrophages are only found in the intravascular compartment following CON2X, unpaired two-tailed t test, *P = 0.01. (E) Intravital imaging (Left) of Aldh1L1-gfp mice IV injected with 70,000 MW dextran rhodamine show BBB permeability and astrocyte end-feet (ALDH1L1-gfp, green) retract from vasculature following injury (white arrow). (F) BBB permeability following single injury over multiple time points (hours). 300 ng Pertussis toxin (PTX) was injected IV over 2 d as a positive control for BBB disruption. Significance markers represent comparison to Sham. Statistical analysis with one-way ANOVA and multiple comparisons post hoc testing. *P = 0.03, ***P = 0.001, ****P < 0.0001. (G) BBB permeability in single and repetitive concussion. One-way ANOVA, **P = 0.001. (H) Quantification of astrocyte distance from vasculature, one-way ANOVA, ***P = 0.003, ****P < 0.0001 Each dot represents one mouse. Data represent three independent experiments with 4 to 6 mice per group.
Fig. 3.
Fig. 3.
Activated microglia protect the BBB in repetitive mild TBI. (A) Intravital multiphoton microscopy video sequences in CX3CR1gfp/+ mice. Microglia (green, gfp) extend their processes to encase injured blood vessels (red) following a TBI. (Scale bar, 10 μm, time stamp in minutes.) (B) Intravital 2P images and (C) quantification of recruitment of microglial cells to the site of injury in CX3CR1+/− and CX3CR1−/− mice. (D) Permeability results following CON2X in CX3CR1−/− mice, unpaired t test, **P = 0.002. Each dot represents one mouse. Data represent three independent experiments with 3 to 5 mice per group. (E) Number of microglia at the site of injury in normal and apyrase-treated conditions. (F) Apyrase-treated microglia can still be activated as measured by soma size (one-way ANOVA, ****P < 0.0001, ***P = 0.0007. (G) xy scatter plots of individual microglia show that apyrase alters microglia morphology by longest-principal axis. Microglia colored based on total area size. (H) Schematic of longest principal axis measurement. The yellow arrowed line shows the length measured. (I) Representative individual microglia in untreated and apyrase-treated conditions highlights shorter principal axis in apyrase-treated microglia. (Scale bar, 20 μm.) (J) Quantification of changes to microglia morphology/longest principal axis following treatment with apyrase. One-way ANOVA, *P = 0.03, ***P = 0.0004. (K) Intravital 2P images of BBB permeability (Left) and quantification (Right) following apyrase treatment, unpaired t test *P = 0.01, **P = 0.006. (L) BBB permeability results following repetitive mild TBI in P2RX7KO mice. Unpaired t test, ***P = 0.0001.
Fig. 4.
Fig. 4.
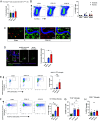
Microglia progressively phagocytose astrocytes in repeated concussion. (A) Quantification of the percentage of propidium iodide cells that had colocalization signal with astrocyte-gfp fluorescence, one-way ANOVA, n.s. (B) Representative flow cytometry analysis (Right) for apoptotic versus necrotic astrocytes. Cells were gated on size, ACSA+, PI+, YO-PRO-1+. Apoptotic cells are identified as those that have positive signal for YO-PRO-1, quantification (Left). 2-way ANOVA, n.s. (C) Intravital imaging of Sham (Left) and CON 2X (Right) CX3CR1-gfp/wt mice injected IV with SR101 demonstrates sulforhodamine 101 stained astrocytes and gfp-microglia are distinct from one another in noninjured conditions but show colocalization of microglia signal (green, gfp) with astrocytes (red, SR101) in CON 2X. (Scale bar, 40 μm.) (D) Images (Left) and quantification (Right) of intravital imaging with PrismPlus mice. Microglia (green, gfp), phagocytosing astrocytes (gray, ALDH1L1, DsRedMax, pseudocolored), astrocytes that are not phagocytosed by microglia have been pseudocolored purple (ALDH1L1, DsRedMax). (Scale bar, 20 μm.) Enlarged view shows a single microglia phagocytosing an astrocyte with the microglia partially clipped away in the first panel to demonstrate that the astrocyte is within the microglia. (Scale bar, 5 μm.) One-way ANOVA, **P = 0.003. (E) Flow cytometry analysis for gfp-positive astrocytes in microglia following TBI. Cells were gated on size, viability, CD45lo, CX3CR1+, CD11b+. Plots show quantification of percent of gfp-positive microglia, indicating phagocytosis of astrocytes. One-way ANOVA, **P = 0.002, ***P = 0.0002. (F) Flow cytometry analysis for ACSA-2 astrocytes within CD45+, CX3CR1+, CD11b+ microglia in C57 wild-type mice. One-way ANOVA **P = 0.001, ***P < 0.0001. (G) Flow cytometry quantification of ACSA-2 -positive microglia in TLR4−/− mice, indicating microglial phagocytosis. One-way ANOVA, *P = 0.02. (H) Flow cytometry quantification of ACSA-2+ microglia in CD36−/− mice. Each dot represents one mouse. Data represent three independent experiments (A, B, and DH) with 3 to 6 mice per group or two independent experiments.
Fig. 5.
Fig. 5.
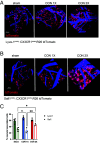
Perivascular macrophages and microglia have distinct responses following repetitive concussion. (A) Intravital 2P imaging of Lyve-1ncre:CX3CR1ccre:R26 tdTomato mice under CON1X and CON2X TBI demonstrating perivascular location of Lyve1-positive (tdTomato) cells. (Scale bar, 40 μm.) (B) Intravital 2P imaging of Sall1ncre:CX3CR1ccre:R26 tdTomato mice under CON1X and CON2X TBI demonstrating progressive localization of CX3CR1+ microglial cells (tdTomato) with repetitive injury. (C) Quantification of vascular associated cells in Cx3cr1ccre: Lyve1ncre and Cx3cr1ccre: Sall1ncre. Two-way ANOVA *P = 0.01, **P = 0.002. Each dot represents one mouse.

References

    1. Lulla A., et al. , Prehospital guidelines for the management of traumatic brain injury—3rd edition. Prehosp. Emerg. Care 27, 507–538 (2023). - PubMed
    1. Nguyen R., et al. , The international incidence of traumatic brain injury: A systematic review and meta-analysis. Can. J. Neurol. Sci. 43, 774–785 (2016). - PubMed
    1. Marmarou C. R., Walker S. A., Davis C. L., Povlishock J. T., Quantitative analysis of the relationship between intra- axonal neurofilament compaction and impaired axonal transport following diffuse traumatic brain injury. J. Neurotrauma 22, 1066–1080 (2005). - PubMed
    1. Khatri N., et al. , Oxidative stress: Major threat in traumatic brain injury. CNS Neurol. Disord. Drug Targets 17, 689–695 (2018). - PubMed
    1. Patet C., Suys T., Carteron L., Oddo M., Cerebral lactate metabolism after traumatic brain injury. Curr. Neurol. Neurosci. Rep. 16, 31 (2016). - PubMed

MeSH terms

LinkOut - more resources