. 2025 Jun;12(22):e2412747.
doi: 10.1002/advs.202412747. Epub 2025 May 19.

Histone Lactylation Antagonizes Senescence and Skeletal Muscle Aging by Modulating Aging-Related Pathways

Affiliations

Histone Lactylation Antagonizes Senescence and Skeletal Muscle Aging by Modulating Aging-Related Pathways

Fanju Meng et al. Adv Sci (Weinh). 2025 Jun.

Abstract

Epigenetic alterations are among the prominent drivers of cellular senescence and/or aging, intricately orchestrating gene expression programs during these processes. This study shows that histone lactylation, plays a pivotal role in counteracting senescence and mitigating dysfunctions of skeletal muscle in aged mice. Mechanistically, histone lactylation and lactyl-CoA levels markedly decrease during cellular senescence but are restored under hypoxic conditions primarily due to elevated glycolytic activity. The enrichment of histone lactylation at promoters is essential for sustaining the expression of genes involved in the cell cycle and DNA repair pathways. Furthermore, the modulation of enzymes crucial for histone lactylation, leads to reduced histone lactylation and accelerated cellular senescence. Consistently, the suppression of glycolysis and the depletion of histone lactylation are also observed during skeletal muscle aging. Modulating the enzymes can also lead to the loss of histone lactylation in skeletal muscle, downregulating DNA repair and proteostasis pathways and accelerating muscle aging. Running exercise increases histone lactylation, which in turn upregulate key genes in the DNA repair and proteostasis pathways. This study highlights the significant roles of histone lactylation in modulating cellular senescence as well as muscle aging, providing a promising avenue for antiaging intervention via metabolic manipulation.

Keywords: epigenetics; histone lactylation; senescence; skeletal muscle aging.


Conflict of interest statement

The authors declare no conflict of interest.

Figures

Figure 1
Figure 1
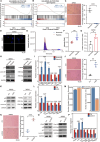
Histone lactylation decreases during cellular senescence. A–C) Immunoblotting of Lamin B1, p16, p21, H3K9la, H3K14la, and H3K18la in young and senescent MEFs (A), IMR90 cells (B), and HUVECs (C). GAPDH and H3 served as loading controls. D) Relative band intensity of immunoblots in A, B and C, n = 3. E) Top, number of altered peaks associated with cellular senescence; bottom, heatmap of altered H3K9la peaks associated with cellular senescence. F) Distribution of the altered H3K9la peaks in the genomic elements of IMR90 cells during senescence. G) Heatmaps and intensity profiles of H3K9la around ±3 kb of TSS throughout the genome in young and senescent IMR90 cells. H) Intensity of lactyl‐CoA in young and senescent IMR90 cells. I) Relative lactyl‐CoA intensity fold change in H, n = 6. The error bars represent the S.D. of independent experiments. Two‐tailed, unpaired Student's t tests were performed. **P < 0.01. TSS, transcription start site.
Figure 2
Figure 2
Glycolysis inhibition leads to a loss of histone lactylation and triggers cellular senescence. A) GSEA of glycolysis genes in IMR90 cells during senescence. B) GSEA of glycolysis genes in IMR90 cells upon hypoxia exposure. C) SA‐β‐gal staining of IMR90 cells cultured under normoxia and hypoxia. The percentages of SA‐β‐gal+ cells are shown on the right, n = 3. D) Immunofluorescence of Ki67 and DAPI in IMR90 cells cultured under normoxia and hypoxia. E) Intensity of lactyl‐CoA in normoxic and hypoxic IMR90 cells. F) Relative lactyl‐CoA intensity fold change in E, n = 6. G) Intracellular lactate levels in IMR90 cells cultured under normoxia and hypoxia, n = 3. H) Protein levels of p16, Lamin B1, p21, H3K9la, H3K14la, and H3K18la in IMR90 cells cultured under normoxia and hypoxia. GAPDH and H3 served as the loading controls. I) Relative band intensity of immunoblots in H, n = 3. J) SA‐β‐gal staining of IMR90 cells with or without 2‐DG treatment in a hypoxic environment. The percentages of SA‐β‐gal+ cells are shown on the right, n = 3. K) Immunoblotting of Lamin B1, p16, p21, H3K9la, H3K14la, and H3K18la in IMR90 cells cultured under hypoxia with and without 2‐DG treatment. GAPDH and H3 served as loading controls. L) Relative band intensity of immunoblots in K, n = 3. M) The number of altered peaks upon hypoxia or 2‐DG treatment. N) SA‐β‐gal staining of IMR90 cells in the presence or absence of Ldha siRNA. The percentages of SA‐β‐gal+ cells are shown on the right, n =3. O) Immunoblotting of LDHA, Pan Kla, H3K18la, H3K14la, H3K9la, Lamin B1, p16, and p21 in IMR90 cells in the presence or absence of Ldha siRNA. H3 and GAPDH served as the loading controls. P) Relative band intensity of immunoblots in O, n = 3. The error bars represent the S.D. of independent experiments. Two‐tailed, unpaired Student's t tests were performed. *P < 0.05, **P < 0.01, ***P < 0.001. Normoxia, 20% O2; hypoxia, 3% O2.
Figure 3
Figure 3
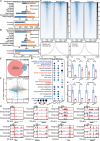
Histone lactylation modulates the expression of genes related to the cell cycle and DNA repair. A) Distribution of the altered H3K9la peaks in genomic elements in IMR90 cells upon hypoxia exposure. B) Distribution of the altered H3K9la peaks in genomic elements in IMR90 cells treated with 2‐DG in a hypoxic environment. C) Heatmaps and intensity profiles of H3K9la around ± 3 kb of TSS throughout the genome in IMR90 cells cultured under hypoxia or normoxia. D) Heatmaps and intensity profiles of H3K9la around ± 3 kb of TSS throughout the genome with or without 2‐DG treatment in IMR90 cells cultured in a hypoxic environment. E) Venn diagram showing the overlapping genes between decreased H3K9la peak‐associated genes identified via CUT&Tag and downregulated genes identified via RNA‐seq data related to cellular senescence. F) Scatter plot showing the relationships between genes with alterations in promoter histone lactylation and those with changes in gene expression during cellular senescence. The green dots indicate the genes that lost promoter histone lactylation and in which senescence was downregulated. G) Gene Ontology pathway analysis of genes with altered H3K9la peaks at their promoters and corresponding downregulation during senescence, upregulation upon hypoxia, or downregulation upon 2‐DG treatment in IMR90 cells. H) Snapshots of H3K9la peaks at the promoters of KIF11, KAT6A, CDT1, and CENPK in young and senescent IMR90 cells. I) Snapshots of H3K9la peaks at the promoters of NDRG1, NSD2, LIG1, and FANCC in young and senescent IMR90 cells. J) mRNA levels of the cell cycle‐related genes KIF11, KAT6A, CDT1, and CENPK in young and senescent IMR90 cells. The cycle threshold (Ct) values of these genes were normalized to that of ACTB, n = 4. K) mRNA levels of the DNA repair‐related genes NDRG1, NSD2, LIG1, and FANCC in young and senescent IMR90 cells. The cycle threshold (Ct) values of these genes were normalized to that of ACTB, n = 4. The error bars represent the S.D. of independent experiments. Two‐tailed, unpaired Student's t tests were performed. **P < 0.01, ***P < 0.001. Normoxia, 20% O2; hypoxia, 3% O2; TSS, transcription start site.
Figure 4
Figure 4
Inhibiting lactyltransferase p300 or delactylase HDAC decreases histone lactylation and accelerates cellular senescence. A) SA‐β‐gal staining of IMR90 cells in the presence or absence of A485 (10 µM). The percentages of SA‐β‐gal+ cells are shown on the right, n = 3. B) Immunoblotting of H3K18la, H3K14la, H3K9la, H3K9ac, Pan Kla, Pan Kac, Lamin B1, p16, p21, and p53 in IMR90 cells in the presence or absence of A485. H3 and GAPDH served as the loading controls. C) Relative band intensity of the immunoblots in B, n = 3. D) SA‐β‐gal staining of IMR90 cells in the presence or absence of MS‐275. The percentages of SA‐β‐gal+ cells are shown on the right, n = 3. E) Immunoblotting of H3K18la, H3K14la, H3K9la, H3K9ac, Pan Kla, Pan Kac, Lamin B1, p16, p21, and p53 in IMR90 cells in the presence or absence of MS‐275 (10 µM). H3 and GAPDH served as the loading controls. F) Relative band intensity of the immunoblots in E, n = 3. G) Immunoblotting of H3K9la and H3K9ac in 293T cells in the presence or absence of lactate (20 mM) or lactate (20 mM) plus acetate (20 mM). H) Relative band intensity of immunoblots in G, n = 3. I) Immunoblotting of H3K9la and H3K9ac in NIH‐3T3 cells in the presence or absence of lactate and lactate plus acetate. J) Relative band intensity of immunoblots in I, n = 3. K) Heatmap showing the expression levels of altered genes and Gene Ontology pathway analysis of these DEGs in IMR90 cells treated with A485. L) Heatmap showing the expression levels of altered genes and Gene Ontology pathway analysis of these DEGs in IMR90 cells treated with MS‐275. M) Venn diagram showing the overlapping genes between genes downregulated upon A485 treatment and those with decreased histone lactylation and downregulation during senescence. Bar plot showing the Gene Ontology pathway analysis of the overlapping genes. N) Venn diagram showing the overlapping genes between genes downregulated upon MS‐275 treatment and those with decreased histone lactylation and downregulation during senescence. Bar plot showing the Gene Ontology pathway analysis of the overlapping genes. The error bars represent the S.D. of independent experiments. Two‐tailed, unpaired Student's t tests were performed. **P < 0.01, ***P < 0.001.
Figure 5
Figure 5
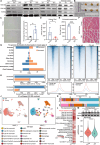
Glycolysis and histone lactylation levels decrease during skeletal muscle aging. A) Protein levels of H3K18la, H3K14la, and H3K9la in the kidney, liver, heart, and hindleg muscle of female mice. H3 served as the loading control. B) SA‐β‐gal staining of skeletal muscle from the gastrocnemius legs of young and old female mice. Three mice were measured in each group. C) SA‐β‐gal staining of skeletal muscle sections from the hindlegs of young and old female mice. Three mice were measured in each group. The percentage of SA‐β‐gal+ staining is shown on the right. D) Rotarod performance test for young and old male mice. The y‐axis represents the persistence time spent on the rotating rod (latency to fall). Five mice were tested in each group. E) Treadmill fatigue test for young and old male mice. The y‐axis represents the time taken to reach fatigue. Five mice were tested in each group. F) H&E staining of skeletal muscle from the hindlegs of young and old female mice. G) Distribution of the altered H3K9la peaks in genomic elements in muscle of young and old mice. H) The number of peaks at whole genome and peaks at promoter in muscle of young and old mice. I) Heatmaps and intensity profiles of H3K9la around ± 3 kb of TSS throughout the genome in muscle of young and old mice. J) UMAP visualization of the 21 major cell types in muscle of young and old mice. The left part shows the UMAP plot of the sample origin (n  =  2 per group). K) Stacked bar chart of the cell proportions in muscle of young and old mice. L) The mRNA expression level of Ldha in the whole skeletal muscle and each cell type of young and old mice. M) Protein levels of LDHA in the skeletal muscle of young and old mice. GAPDH served as the loading control. N) Alterations in the expression of glycolysis hallmark genes in skeletal muscle between young and old mice. The error bars represent the S.D. of independent experiments. Two‐tailed, unpaired Student's t tests were performed. *P < 0.05, ***P < 0.001, ****P < 0.001. TSS, transcription start site.
Figure 6
Figure 6
Decreased histone lactylation in aging muscle dampens DNA repair and proteostasis pathways. A) The expression of genes related to DNA repair in muscle of young and old mice. B) The expression of genes related to proteostasis in muscle of young and old mice. C) Intensity profiles of H3K9la around ± 3 kb of TSS on DNA repair pathway in muscle of young and old mice. D) Intensity profiles of H3K9la around ± 3 kb of TSS on proteostasis pathway in muscle of young and old mice. E) Experimental schema for intramuscular MS‐275 injection in the gastrocnemius muscle. The graphical elements in this study's figures are sourced from BioRender.com. F) Immunoblotting of H3K18la, H3K14la, H3K9la, and Lamin B1 in the gastrocnemius muscle with or without MS‐275 injection. H3 and GAPDH served as the loading controls. G) Relative band intensity of the immunoblots in F, n = 3. H) Distribution of the altered H3K9la peaks in genomic elements in muscle with or without MS‐275 treatment. I) The number of peaks at whole genome and peaks at promoter in muscle with or without MS‐275 treatment. J) Heatmaps and intensity profiles of H3K9la around ± 3 kb of TSS throughout the genome in muscle with or without MS‐275 treatment. K) Gene Ontology pathway analysis of genes with decreased H3K9la peaks at their promoters and corresponding downregulation with MS‐275 treatment. The error bars represent the S.D. of independent experiments. Two‐tailed, unpaired Student's t tests were performed. ****P < 0.001. TSS, transcription start site.
Figure 7
Figure 7
Exercise rescues muscle histone lactylation levels and restores DNA repair as well as proteostasis. A) SA‐β‐gal staining of skeletal muscle from the gastrocnemius legs of sedentary and running female mice. Three mice were measured in each group. B) SA‐β‐gal staining of sedentary and running hindleg skeletal muscle sections from 13‐month‐old female mice. Three mice were measured in each group. The percentage of SA‐β‐gal+ staining is shown on the right. C) Protein levels of H3K18la, H3K14la, and H3K9la in sedentary and running mice. GAPDH and H3 served as loading controls. D) Relative band intensity of immunoblots in C, n = 4. E) Distribution of the altered H3K9la peaks in genomic elements in muscle of sedentary and running mice. F) The number of peaks at whole genome and peaks at promoter in muscle of sedentary and running mice. G) Heatmaps and intensity profiles of H3K9la around ± 3 kb of TSS throughout the genome in muscle of sedentary and running mice. H) UMAP visualization of the 19 major cell types in muscle of sedentary and running mice. The left part shows the UMAP plot of the sample origin (n  =  2 per group). I) Stacked bar chart of the cell proportions in muscle of sedentary and running mice. J) The mRNA expression level of Ldha in the whole skeletal muscle and each cell type of sedentary and running mice. K) Protein levels of LDHA in the skeletal muscle of sedentary and running mice. GAPDH served as the loading control. L) Alterations in the expression of glycolysis hallmark genes in muscle between sedentary and running mice. M) The expression of genes related to DNA repair in muscle of sedentary and running mice. N) The expression of genes related to proteostasis in muscle of sedentary and running mice. O) Intensity profiles of H3K9la around ± 3 kb of TSS on DNA repair pathway in muscle of sedentary and running mice. P) Intensity profiles of H3K9la around ± 3 kb of TSS on proteostasis pathway in muscle of sedentary and running mice. The error bars represent the S.D. of independent experiments. Two‐tailed, unpaired Student's t tests were performed. *P < 0.05, ****P < 0.001.
Figure 8
Figure 8
Schematic illustration. During cellular senescence and muscle aging, a significant decrease in histone lactylation is associated with the inhibition of glycolysis and the subsequent scarcity of lactate and lactyl‐CoA. Hypoxic reprogramming in primary cells can restore the level of histone lactylation, suggesting a positive correlation with a rejuvenated cellular state. Genome‐wide profiling revealed that histone lactylation predominantly occurs at the promoters of genes pivotal to the cell cycle and DNA repair pathways. Furthermore, a reduction in glycolysis leads to decreased histone lactylation during muscle aging. By enhancing glycolysis, exercise elevates histone lactylation levels, underscoring the critical role of exercise in the regulation of aging and the maintenance of muscle function, particularly through the modulation of DNA repair and proteostasis pathways. The graphical elements in this study's figures are sourced from BioRender.com.

References

    1. Kumari R., Jat P., Front Cell Dev. Biol. 2021, 9, 645593. - PMC - PubMed
    1. He S., Sharpless N. E., Cell 2017, 169, 1000. - PMC - PubMed
    1. Lopez‐Otin C., Blasco M. A., Partridge L., Serrano M., Kroemer G., Cell 2023, 186, 243. - PubMed
    1. Yang J. H., Hayano M., Griffin P. T., Amorim J. A., Bonkowski M. S., Apostolides J. K., Salfati E. L., Blanchette M., Munding E. M., Bhakta M., Chew Y. C., Guo W., Yang X., Maybury‐Lewis S., Tian X., Ross J. M., Coppotelli G., Meer M. V., Rogers‐Hammond R., Vera D. L., Lu Y. R., Pippin J. W., Creswell M. L., Dou Z., Xu C., Mitchell S. J., Das A., O'Connell B. L., Thakur S., Kane A. E., et al., Cell 2024, 187, 1312. - PubMed
    1. Lyu G., Guan Y., Zhang C., Zong L., Sun L., Huang X., Huang L., Zhang L., Tian X. L., Zhou Z., Tao W., Nat. Commun. 2018, 9, 2560. - PMC - PubMed

LinkOut - more resources