Review
. 2025 Jun 10;22(4):042001.
doi: 10.1088/1478-3975/adda85.

Methods in quantitative biology-from analysis of single-cell microscopy images to inference of predictive models for stochastic gene expression

Affiliations
Review

Methods in quantitative biology-from analysis of single-cell microscopy images to inference of predictive models for stochastic gene expression

Luis U Aguilera et al. Phys Biol. .

Abstract

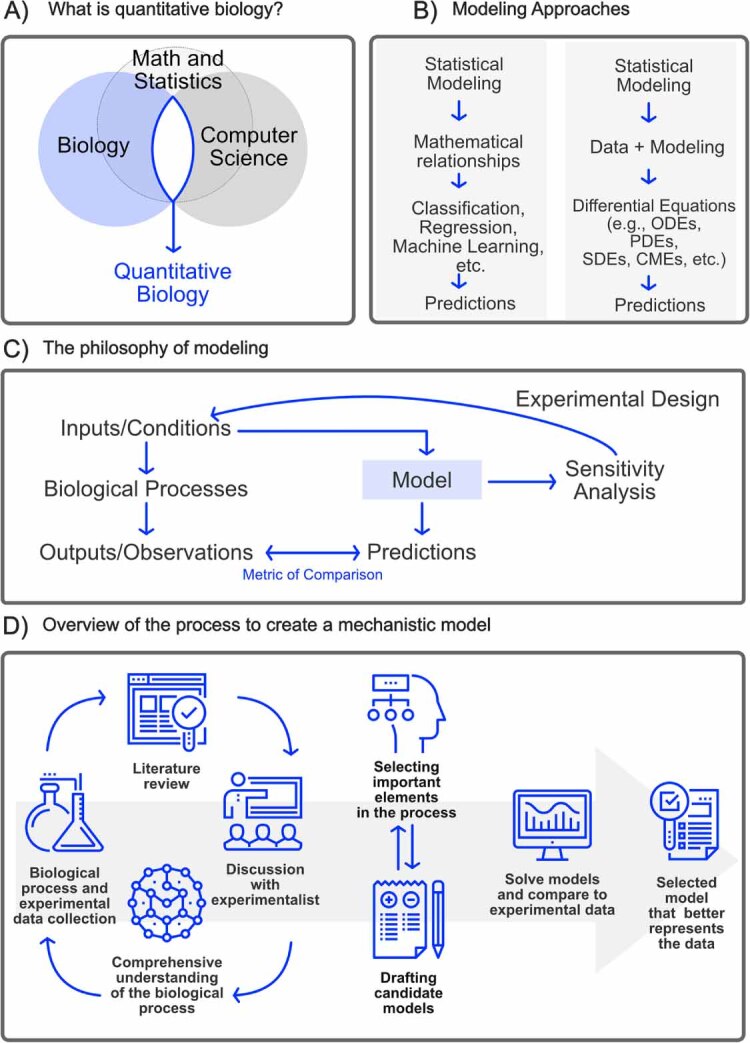
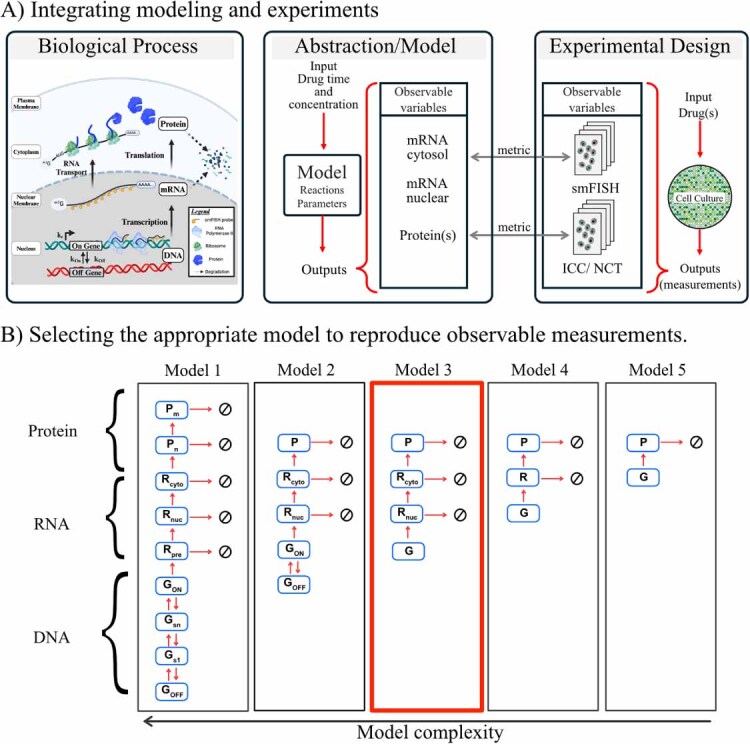
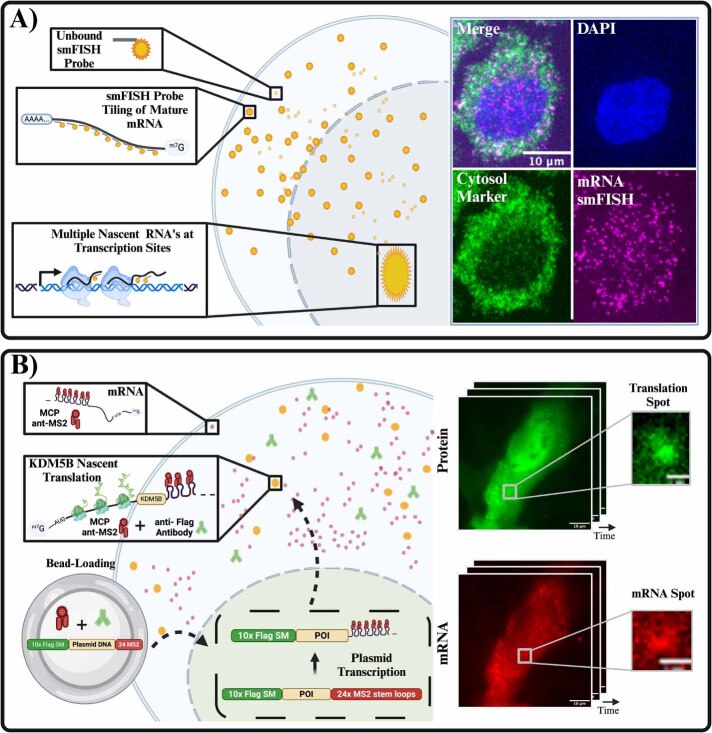
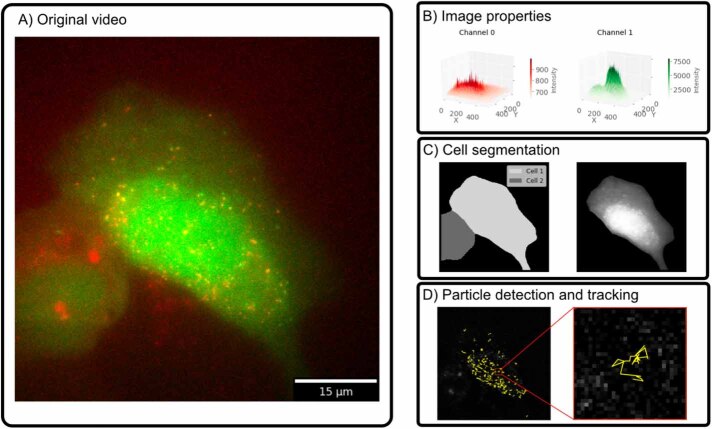
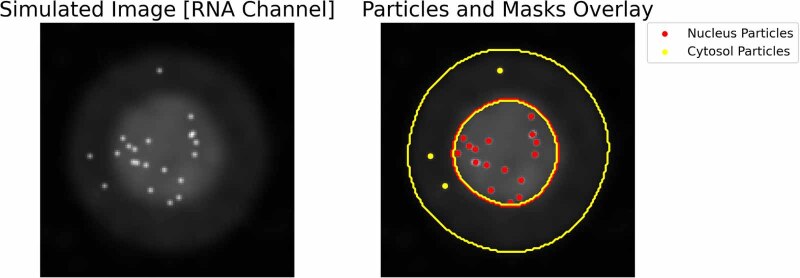
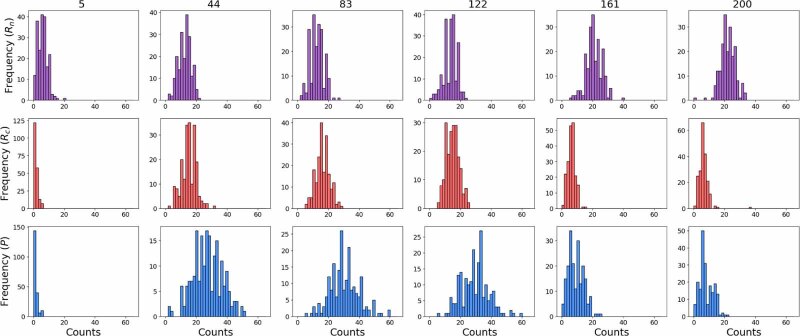
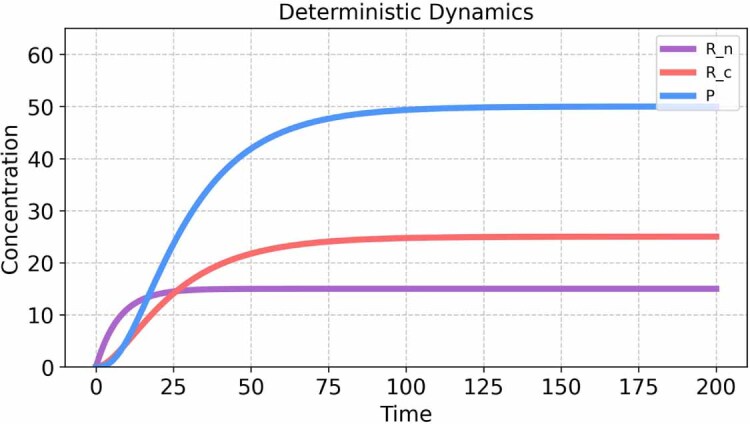
The field of quantitative biology (q-bio) seeks to provide precise and testable explanations for observed biological phenomena by applying mathematical and computational methods. The central goals of q-bio are to (1) systematically propose quantitative hypotheses in the form of mathematical models, (2) demonstrate that these models faithfully capture a specific essence of a biological process, and (3) correctly forecast the dynamics of the process in new, and previously untested circumstances. Achieving these goals depends on accurate analysis and incorporating informative experimental data to constrain the set of potential mathematical representations. In this introductory tutorial, we provide an overview of the state of the field and introduce some of the computational methods most commonly used in q-bio. In particular, we examine experimental techniques in single-cell imaging, computational tools to process images and extract quantitative data, various mechanistic modeling approaches used to reproduce these quantitative data, and techniques for data-driven model inference and model-driven experiment design. All topics are presented in the context of additional online resources, including open-source Python notebooks and open-ended practice problems that comprise the technical content of the annual Undergraduate Quantitative Biology Summer School (UQ-Bio).

Keywords: fluorescence microscopy; mechanistic models; model inference; quantitative biology; single-cell imaging; stochastic gene expression.


Figures

Figure 1.
Figure 1.
Overview of quantitative biology. (A) Quantitative biology lies at the intersection of biology, computer science, math and statistics. (B) Both statistical and mechanistic models attempt to infer relationships between experimental observations. The key difference is that mechanistic models also attempt to constrain these relationships to follow known or hypothesized physical laws or biochemical reactions. (C) Modeling involves an iterative procedure of collecting diverse data sets, making predictions for feasible experiments, constraining models to match resulting data, and analyzing model sensitivities to target more informative experimental conditions that are most likely to glean further insight. (D) The creating of mechanistic models involves close collaboration between experimentalists and computational scientists.
Figure C1.
Figure C1.
Simulated data depicting RNA and protein snapshots at different times. The figure illustrates the spatial distribution of RNA and protein concentrations within a simulated cell at six different time points. The areas enclosed by the circles represent the nucleus and the surrounding cytosol. The top row shows the RNA channel, where RNA molecules are visualized as 2D Gaussian kernels in the image. The bottom row represents the protein channel, showing the accumulation and dynamics of protein molecules synthesized from the RNA. Both rows reveal the temporal progression of gene expression, and the effects of drug-induced inhibition on mRNA transport and its subsequent impact on protein production.
Figure C2.
Figure C2.
Selecting the model scope. (A) Schematic containing the steps during gene expression, including (de)activation, transcription, and translation. The center and right diagrams show how the model and experiments are integrated by comparing observable variables cytosol and nuclear mRNA measured with smFISH experiments and protein measurements with immunocytochemistry (ICC) or Nascent Chain Tracking (NTC). The direct comparison between model variables and experimental variables is achieved by using a metric described in section 6. (B) Models with different complexity. In Model 1, the diagram represents a comprehensive representation of the system including nine species; in the first part of this representation, the Gene (G) can transition between n different states until reaching an active form (GON). Subsequently, multiple forms of mRNA are taken into account, including premature mRNA (Rpre), mature nuclear mRNA (Rn), cytoplasmic mRNA (Rc), nascent Protein (Pn), and mature protein (Pm). All 16 arrows connecting the different chemical species represent the system’s transition rates (parameters). From Models 2 to 5, it can be observed that only some elements are considered in these models, reducing the complexity of the model in this way. In this example, Model 3 is selected for the rest of the exercise as it contains the minimal variables needed to reproduce the observable experimental variables. Created in BioRender. Ron E (2025). https://BioRender.com/e39n811.
Figure 2.
Figure 2.
Methods in single-cell imaging. (A) Schematic representation of smFISH (single-molecule fluorescence in situ hybridization) for detecting mRNA in fixed cells. The top panels show unbound smiFISH probes, hybridization to mRNA via tiling, and visualization of nascent transcripts at transcription sites. Right: Confocal image showing a nucleus stained with DAPI (blue), cytosolic marker (green), and mRNA smiFISH signal (magenta) in a single cell. (B) Cartoon depicting live-cell imaging of translation using nascent chain tracking (NCT). The plasmid construct encodes the protein of interest (POI) fused to a Flag epitope tag and 24× MS2 stem loops. The plasmid is bead-loaded into cells along with fluorescent anti-Flag antibodies and MCP (MS2 coat protein). Transcription of the plasmid produces mRNA containing 24× MS2 stem loops, which bind MCP and are visualized as diffraction-limited red spots. Nascent translation of the mRNA is tracked via the binding of anti-Flag antibodies (green) to the Flag epitope on nascent chains, resulting in colocalized green and red signals (yellow). Insets show time-lapse snapshots of protein and mRNA signals. Created in BioRender. Ron E (2025). https://BioRender.com/e39n811.
Figure 3.
Figure 3.
Processing fluorescence microscopy images and videos. (A) Microscope image that shows an NCT experiment that detects KDM5B RNA molecules in the red channel and nascent proteins in the green channel (see figure 2(B)). (B) Each pixel in a digital image contains an intensity value, representing the properties in the original image. Spots are observed as intensity ‘spikes’, and structures such as the nucleus can be observed as extensive elevations (3D representation showing the intensity values as the z-axis). (C) Cell segmentation involves detecting and labeling the regions corresponding to independent cells. Here, cell segmentation was performed using Cellpose [74] in the green channel. (D) Detected RNA spots were detected for all time frames in the original video; after this, particle trajectories were created by linking particle positions at multiple time points. Here, spot detection and tracking were performed using TrackPy [75].
Figure C3.
Figure C3.
Cell segmentation and spot detection. Representative image illustrating cell segmentation and particle detection in the RNA channel. The left panel displays the original simulated RNA channel image after Gaussian smoothing. The right panel overlays the detected particles and segmentation masks onto the RNA channel image. Inner yellow contour delineates the segmented nucleus, while outside yellow contours outline the segmented cytosol. Detected RNA particles within the nucleus are marked in red, and those within the cytosol are marked in yellow.
Figure C4.
Figure C4.
Histograms of processed data. Histograms illustrating the distributions of recovered counts for the simulated data across six time points. Top panels display the distribution of nuclear mRNA molecules. The middle panels show the distribution of cytosolic mRNA molecules. The bottom panels illustrate the distribution of protein molecules in the cytosol. Each histogram is constructed with 25 bins ranging from 0 to 65 particles.
Figure C5.
Figure C5.
Deterministic simulation output for the biochemical system. Species P, Rn, and Rc rapidly achieve a steady-state concentration, indicating a saturating process or equilibrium is reached quickly. This deterministic approach provides a baseline understanding of the system’s dynamics, allowing for the identification of steady states and thresholds.
Figure C6.
Figure C6.
Stochastic simulation analysis. A set of 100 individual trajectories were run. Each trajectory was used to build the median and standard deviation plotted on the time course in the top-right corner figure. A distribution of the values is given for each variable in the system. The simulation was performed using Gillespy2, [88]. Initial conditions, parameter values, and time span are reported in the tables above. Histograms were built by taking the species concentrations at time 100 of the simulation.
Figure C7.
Figure C7.
Effects of drug perturbation. Simulation of Drug inhibition at tdrug=120 min, kt(t<tdrug)=0.083 min−1, and kt(t>=tdrug)=0.0083 min−1. For stochastic simulations, 100 trajectories were run.
Figure C8.
Figure C8.
FSP Solution and Error. (Left) Simulation of drug inhibition at tdrug=120 min, with kt(t<tdrug)= 0.083 min−1 and kt(ttdrug)=0.0083 min−1. (Right) FSP truncation error vs. time calculated as final term, g(t) in equation (19).
Figure C9.
Figure C9.
The 2-species joint probability contours shown for each combination of the model species (Rn, Rc, P) at tdrug = 120 min.
Figure C10.
Figure C10.
Model fit results. Comparison between deterministic ODEs and Stochastic Simulations using MLE parameters. Solid lines depict the deterministic ODE model predictions for the observable species: nuclear mRNA (Rn), cytosolic mRNA (Rc), and protein (P), based on the estimated parameter values. Data points (dots) represent the synthetic experimental observations for each species at six distinct time points. The shaded regions illustrate the variability across 200 stochastic simulation runs (SSA). Additionally, the vertical dashed line at (t = 120) time units indicates the time of drug application.
Figure C11.
Figure C11.
Model fit comparison between stochastic simulations and synthetic data. Solid blue lines SSA solution for the observable species: nuclear mRNA (Rn), cytosolic mRNA (Rc), and protein (P), based on the estimated parameter values. Data orange histograms represent the synthetic experimental observations for each species at six distinct time points. Histograms were built using 200 SSA runs.
Figure C12.
Figure C12.
Parameter uncertainty. Histograms display the posterior distributions of the estimated parameters obtained from the Metropolis–Hastings Chains. The spread of each histogram reflects the uncertainty associated with each parameter estimate. Narrower distributions indicate higher confidence, while wider distributions suggest greater uncertainty.

Similar articles

References

    1. Peccoud J, Ycart B. Markovian modeling of gene-product synthesis. Theor. Popul. Biol. 1995;48:222–34. doi: 10.1006/tpbi.1995.1027. - DOI
    1. Maier B D, Aguilera L U, Sahle S, Mutz P, Kalra P, Dächert C, Bartenschlager R, Binder M, Kummer U. Stochastic dynamics of type-I interferon responses. PLoS Comput. Biol. 2022;18:e1010623. doi: 10.1371/journal.pcbi.1010623. - DOI - PMC - PubMed
    1. Weinberger L S, Burnett J C, Toettcher J E, Arkin A P, Schaffer D V. Stochastic gene expression in a lentiviral positive-feedback loop: HIV-1 tat fluctuations drive phenotypic diversity. Cell. 2005;122:169–82. doi: 10.1016/j.cell.2005.06.006. - DOI - PubMed
    1. King C R, Berezin C-T, Peccoud J. Stochastic model of vesicular stomatitis virus replication reveals mutational effects on virion production. PLoS Comput. Biol. 2024;20:e1011373. doi: 10.1371/journal.pcbi.1011373. - DOI - PMC - PubMed
    1. Gonze D, Coyte K Z, Lahti L, Faust K. Microbial communities as dynamical systems. Curr. Opin. Microbiol. 2018;44:41–49. doi: 10.1016/j.mib.2018.07.004. - DOI - PubMed

MeSH terms

LinkOut - more resources