. 2025 May 19;16(1):4638.
doi: 10.1038/s41467-025-59818-8.

Engineering anti-BCMA CAR T cells for enhancing myeloma killing efficacy via apoptosis regulation

Affiliations

Engineering anti-BCMA CAR T cells for enhancing myeloma killing efficacy via apoptosis regulation

Thomas Kimman et al. Nat Commun. .

Abstract

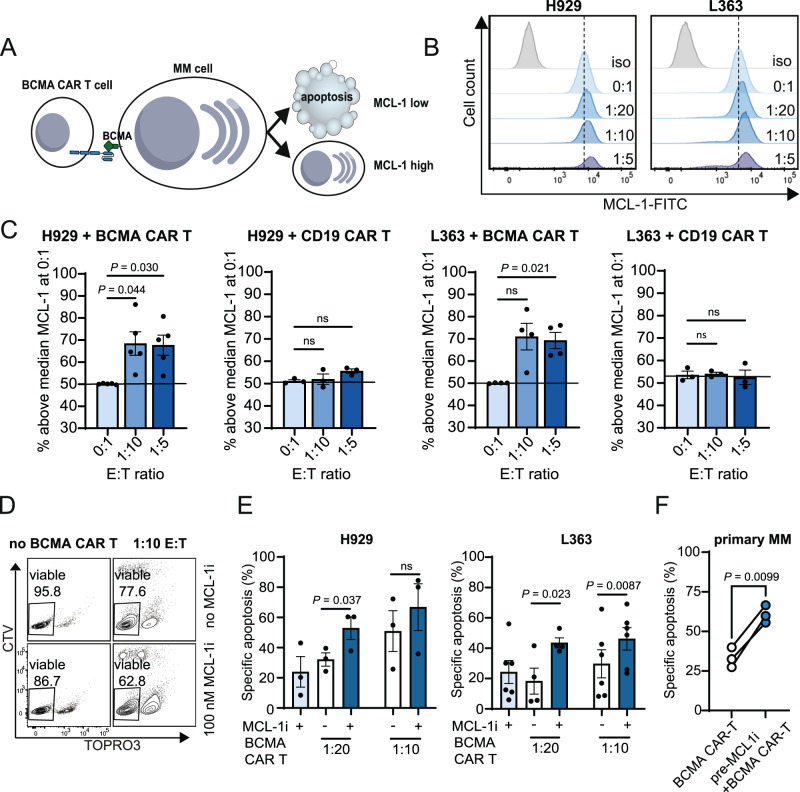
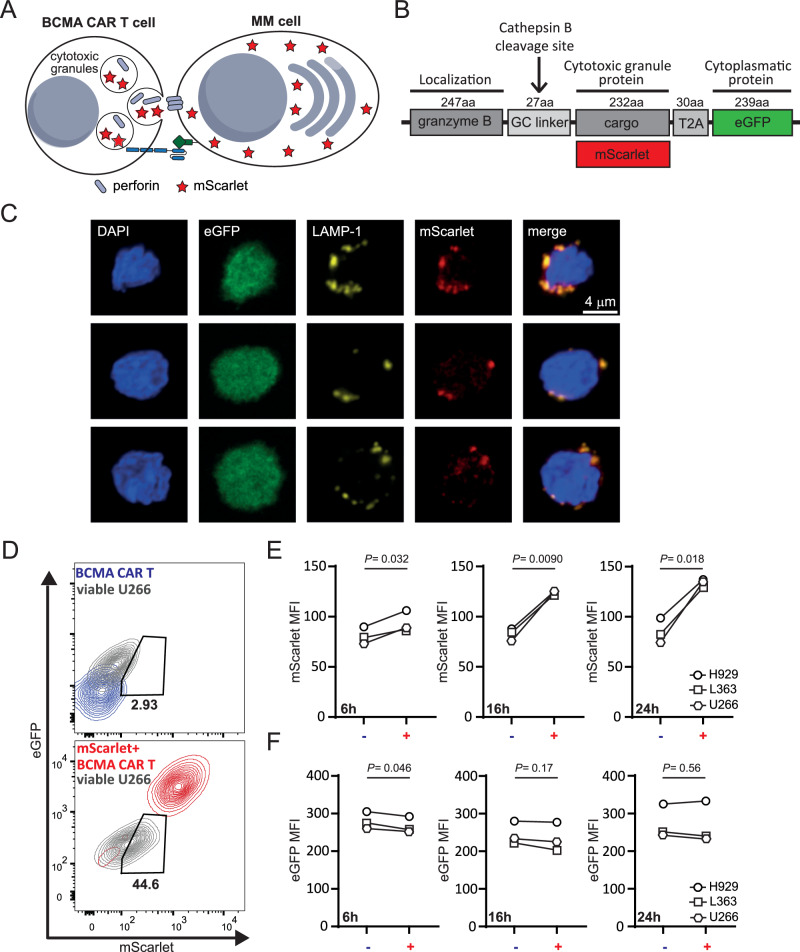
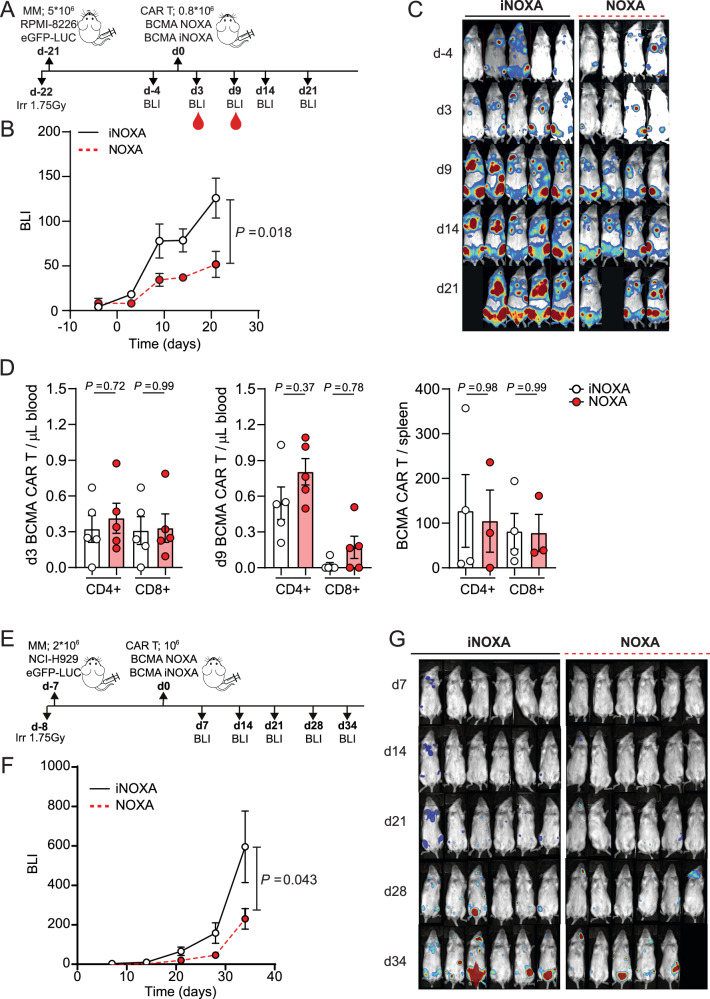
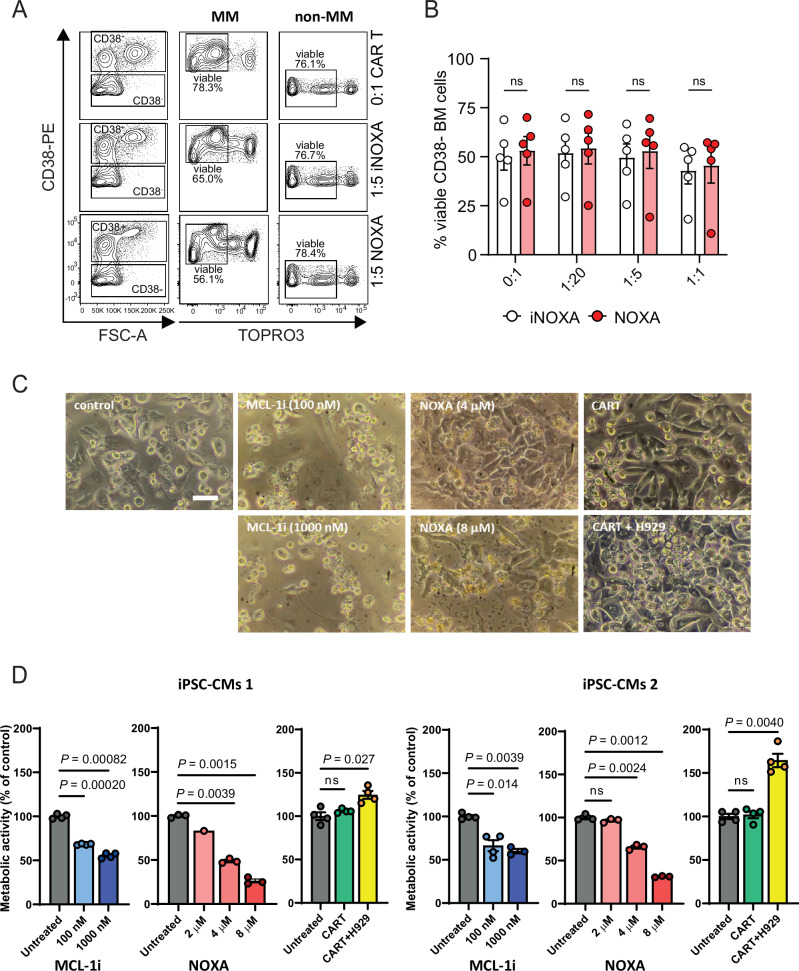
Clinical responses with chimeric antigen receptor (CAR) T cells are encouraging, but primary resistance and relapse after therapy prevent durable remission in many patients with cancer, with apoptosis resistance in cancer cells that limits killing by CAR T cells being a potential cause. Here we aim to boost tumor cell apoptosis induced by CAR T cells and find that anti-B cell maturation antigen (BCMA) CAR T cells over-expressing a granzyme B-NOXA fusion protein show improved killing of multiple myeloma (MM) cells in vitro and in xenograft mouse models in vivo. Mechanistically, such an enhancement is mediated by localizing NOXA to cytotoxic granules that are released into cancer cells upon contact. In MM cells, inhibition of MCL-1, an anti-apoptotic factor, by its natural ligand NOXA effectively induces apoptosis. Our data thus show that endowing granzyme B-NOXA expression to CAR T cells improves their killing efficacy, thereby presenting a potential generalizable enhancement for CAR T-mediated anti-cancer immunity.


Conflict of interest statement

Competing interests: V.P. received royalty payments related to venetoclax. V.P., Z.S., and T.K. are inventors on a patent for improving cytotoxicity of gene engineered T and NK cells. M.C.M. received research funding from Beigene, Janssen Cilag, Speakers fee from Janssen Cilag, Siemens, and Pfizer, and Consultancy fee from Janssen Cilag, Pfizer, BMS, and Hospitality Janssen Cilag, Beigene, all paid to institution. Z.S. and J.K. are inventors on different patents for γδ T-cell receptor sequences, recognition mechanisms, and isolation strategies. J.K. is the founder and shareholder of Gadeta Founders BV. The remaining authors declare no competing interests.

Figures

Fig. 1
Fig. 1. MCL-1 expression limits MM cell killing by anti-BCMA CAR T cells.
A Graphical representation of experimental findings. B Representative histograms showing MCL-1 protein expression measured by intracellular flow cytometry in alive H929 or L363 MM cells after 24 h co-culture with anti-BCMA CAR T cells using the indicated effector to target cell ratio’s (E:T). The dotted line indicates the median fluorescence intensity of MCL-1 in untreated (0:1) L363 or H929 cells. The gray histograms shows isotype control staining (iso). C H929 and L363 cells were co-cultured for 24 h with either anti-BCMA CAR T (H929, n = 5; L363, n = 4) or CD19 CAR T (n = 3) cells at the E:T ratios specified. Graphs show the percentage of viable H929 or L363 with MCL-1 expression above the median expression in untreated cells. Dots represent separate experiments with SEM. Statistical testing was performed using one-way ANOVA, followed by multiple comparison testing. D Representative gating strategy of L363 MM cells co-cultured with CellTrace Violet (CTV)-labeled anti-BCMA CAR T cells and stained with nucleic acid dye TO-PRO-3, and measured by flow cytometry after 24 h of culture. Co-cultures were simultaneously incubated with 100 nM MCL-1 inhibitor S63845 (lower panels) or without (upper panels). Indicated percentages of viable cells are calculated within CTV-negative MM cells. E Quantified specific apoptosis of H929 or L363 cells as detailed for (C) and by using the gating strategy shown in (D). Percentages were calculated based on absolute cell numbers using counting beads. Specific apoptosis was determined by measuring the altered percentage of TO-PRO-3- (live) cells compared with untreated cells and was defined as follows: ([% cell death in treated cells−% cell death in control]/% viable cells control) × 100. For H929 a concentration of 10 nM MCL-1i and for L363 a concentration of 100 nM MCL-1i was used. Dots show averages of separate experiments with H929 (n = 3) or L363 (n = 6) with SEM. Statistical testing was performed using one-way ANOVA, followed by multiple comparison testing. F Specific apoptosis (calculated as in (E)) induced by anti-BCMA CAR T cells in primary MM cells pre-treated with MCL-1i (blue circles) or without pre-treatment (white circles). Bone marrow mononuclear cells (BMNCs) were cultured for 48 h in the presence or absence of MCL-1i (S63845, 100 nM). After pre-treatment, the number of viable MM cells (CD38 + CD138+) on each condition was quantified by FACS following the gating strategy shown in Supplementary Fig. 1c. MCL-1i was washed away and BMNCs cells were subsequently co-cultured with anti-BCMA CAR T cells for 24 h at a 1:5 E:T ratio, calculated based on the number of alive MM cells present on each condition. Data are from 3 independent experiments. Each circle represents a patient sample. Statistical analysis was performed using a two-tailed paired t test. Source data are provided as a Source Data file.
Fig. 2
Fig. 2. Exogenous NOXA induces apoptosis in L363 cells.
A) Representative confocal image (630 × oil magnification) showing L363 MM cells incubated with 10 µM synthetic NOXA-TAMRA with or without 15 ng/ml streptolysin O (SLO). Scale bar, 5 µM. B SDS-PAGE electrophoresis of NP40 lysates from L363 MM cells treated with 15 ng/ml SLO, with or without 10 µM synthetic NOXA, stained for NOXA, MCL-1 and α-tubulin as control. Left panel shows the untreated lysates before immunoprecipitation (pre IP) and the right panel shows the cell lysates after immunoprecipitation with MCL-1 or control (IgG) antibodies (post- IP). C Percentage of viable (DiOC6(3)+TO-PRO-3-) L363 MM cells treated with 15 ng/ml SLO, with or without 8 µM synthetic NOXA and analyzed by flow cytometry following the gating strategy shown in Fig. 1d. Shown are averages of 5 biological replicates with SEM. Statistical analysis was performed using a one-way ANOVA with Geisser-Greenhouse correction. D Apoptosis induced by synthetic NOXA in L363 MM cells treated with 15 ng/ml SLO or without SLO, analyzed by flow cytometry with viability dyes TO-PRO-3 and DiOC6(3). Shown are averages of 5 biological replicates with SEM. Statistical analysis was performed using a two-way ANOVA followed by multiple comparison testing. E Specific apoptosis induced in L363 or U266 MM cells treated with 15 ng/ml SLO, with or without 4 µM synthetic NOXA and analyzed by flow cytometry. Dots represent separate experiments with SEM. Source data are provided as a Source Data file.
Fig. 3
Fig. 3. anti-BCMA CAR T cells can be equipped with fluorescent cargo that is transferred to MM cells upon cell-cell interaction.
A Graphical representation of experimental findings. B Construct design with cargo proteins fused to granzyme B through a GC linker that contains a cathepsin B cleavage site. C Representative confocal images (×630 oil-magnification) of anti-BCMA CAR T cells transduced with the lentiviral construct shown in (B) and stained for late endosomal marker LAMP-1 and DAPI. D Representative image of eGFP and mScarlet fluorescence in viable U266 MM cells (gray) when co-cultured with WT (blue) or mScarlet+ (red) anti-BCMA CAR T cells for 24 h in a 1:5 E:T cell ratio. Fluorescence signals of WT or mScarlet+ anti-BCMA CAR T cells were used as overlay in these plots to indicate range of eGFP and mScarlet expression. E, F Mean fluorescence intensity (MFI) of mScarlet (E) or eGFP (F) in the total viable population of indicated target MM cell lines (n = 3) when co-cultured for 6, 16, or 24 h with WT (−) or mScarlet+ (+) anti-BCMA CAR T cells in a 1:5 E:T cell ratio. The experiment was performed in the presence of 10 µM caspase inhibitor Q-VD-OPh to inhibit apoptosis of target cells. Statistical analysis was performed using a paired, two-tailed t test. Source data are provided as a Source Data file.
Fig. 4
Fig. 4. Anti-BCMA CAR T cells armed with NOXA show improved killing of MM cells.
A Construct design with pro-apoptotic NOXA (active) or mutated (inactive) NOXA (iNOXA) as cargo proteins fused to granzyme B. B Representative image-based flow cytometry image captures by ImageStream at ×1060 magnification of CD8+ anti-BCMA CAR T transduced with the constructs depicted in (A) and stained with antibodies against HA and LAMP-1 or CD8. C Specific apoptosis induced in H929 cells after 24 h of co-culture with NOXA-BCMA CAR T cells or iNOXA-BCMA CAR T cells at indicated E:T cell ratios. Apoptosis was analyzed by flow cytometry following the gating strategy shown in Fig. 1D. Values are average of 7 independent experiments with SEM. Statistical testing was performed using a two-way ANOVA followed by a Sidak’s multiple comparison test. D Specific apoptosis induced in primary CD38+CD138+ MM cells after 48 h of co-culture with NOXA-BCMA CAR T cells or iNOXA-BCMA CAR T cells at indicated E:T cell ratios. Apoptosis was analyzed by flow cytometry following the gating strategy shown in Supplementary Fig. 1c. Each dot represents a different MM patient sample (n = 5). Statistical testing was performed using a two-way ANOVA followed by a Sidak’s multiple comparison test. Source data are provided as a Source Data file.
Fig. 5
Fig. 5. NOXA-BCMA CAR T cells show improved killing of MM cells in vivo.
A Experimental setup of xenograft mouse experiment where NSG mice are i.v. injected with RPMI8226-eGFP-Luc2 MM cells, followed by i.v. injection of indicated anti-BCMA CAR T cells (0.8 × 10⁶, with a 1:1 CD4:CD8 ratio) 21 days later. Blood samples were taken at day 3 and 9 post-CAR T injection. B Average bioluminescence intensity (BLI) (flux p/s) of mice treated with NOXA-BCMA (n = 4) or iNOXA-BCMA CAR T (n = 5) over time with SEM. Statistical testing was performed using a mixed-effect model followed by Sidak’s multiple comparison test. C Corresponding BLI images of mice shown in (B). D Number of CD4+ and CD8+ iNOXA-BCMA or NOXA-BCMA CAR T cells in blood at 3 (left panel) or 9 (center panel) days, or in the spleen (days 25–27, right panel), after i.v. injection in mice as outlined in (A). Cells were analyzed by flow cytometry following the gating strategy shown in Supplementary Fig. 6b. Statistical testing was performed using one-way ANOVA, followed by multiple comparison testing. E Experimental setup of xenograft mouse experiment where NSG mice are i.v. injected with NCI-H929-eGFP-Luc2 MM cells, followed by i.v. injection of indicated anti-BCMA CAR T cells (1.0 × 10⁶, with a 1:1 CD4:CD8 ratio) 7 days later. F Average bioluminescence intensity (BLI) (flux p/s) of mice treated with NOXA-BCMA (n = 6) or iNOXA-BCMA CAR T (n = 6) over time with SEM. Statistical testing was performed using a mixed-effect model followed by Sidak’s multiple comparison test. G Corresponding BLI images of mice shown in (F). Images in (A) and (E) indicating experimental setups were adapted from Sun et al.. Source data are provided as a Source Data file.
Fig. 6
Fig. 6. NOXA cargo does not impair viability of transduced anti-BCMA CAR T cells and does not show off-target toxicity.
Representative density plots showing cell viability (TO-PRO-3 staining) of primary bone marrow stromal cells (CD38-) or MM (CD38+) cells after 48 h of co-culture with iNOXA-BCMA or NOXA-BCMA CAR T cells in a 1:5 E:T cell ratio or without anti-BCMA CAR T cells (0:1 E:T). B Quantification of data shown in (A) with each dot representing a different MM patient sample (n = 5) co-cultured with iNOXA-BCMA or NOXA-BCMA CAR T cells at indicated E:T ratios for 48 h. Dots represent separate experiments with SEM. Statistical testing was performed using a two-way ANOVA followed by Sidak’s multiple comparison test. C Representative microscope images (bright field) of hiPSC-CMs (1 × 10⁵ per well) are shown that are untreated (control), treated for 24 h with indicated dosages of MCL-1i (S63845) or synthetic NOXA, or after a 24 h co-culture with NOXA3X BCMA CAR T cells (0.5 × 10⁵ per well) alone or together with H929 MM cells (0.5 × 10⁵ per well). Scale bar, 200 µM. Matching video files showing the beating rate of indicated conditions are uploaded as Supplementary Movies 1–6. D AlamarBlue assays representing the metabolic activity per well in conditions outlined in (C). Two different hiPSC donors were used. Each dot represents a separate experiment (n = 1–4) with SEM. Statistical testing was performed using one-way ANOVA, followed by multiple comparison testing. Source data are provided as a Source Data file.

References

    1. Majzner, R. G. & Mackall, C. L. Clinical lessons learned from the first leg of the CAR T cell journey. Nat. Med.25, 1341–1355 (2019). - PubMed
    1. Melenhorst, J. J. et al. Decade-long leukaemia remissions with persistence of CD4(+) CAR T cells. Nature602, 503–509 (2022). - PMC - PubMed
    1. Sakemura, R. et al. Targeting cancer-associated fibroblasts in the bone marrow prevents resistance to CART-cell therapy in multiple myeloma. Blood139, 3708–3721 (2022). - PMC - PubMed
    1. Larson, R. C. & Maus, M. V. Recent advances and discoveries in the mechanisms and functions of CAR T cells. Nat. Rev. Cancer21, 145–161 (2021). - PMC - PubMed
    1. Newick, K., O’Brien, S., Moon, E. & Albelda, S. M. CAR T cell therapy for solid tumors. Annu Rev. Med68, 139–152 (2017). - PubMed

MeSH terms