. 2025 May 19;16(1):4633.
doi: 10.1038/s41467-025-59679-1.

Single-cell RNA-sequencing reveals early mitochondrial dysfunction unique to motor neurons shared across FUS- and TARDBP-ALS

Affiliations

Single-cell RNA-sequencing reveals early mitochondrial dysfunction unique to motor neurons shared across FUS- and TARDBP-ALS

Christoph Schweingruber et al. Nat Commun. .

Abstract

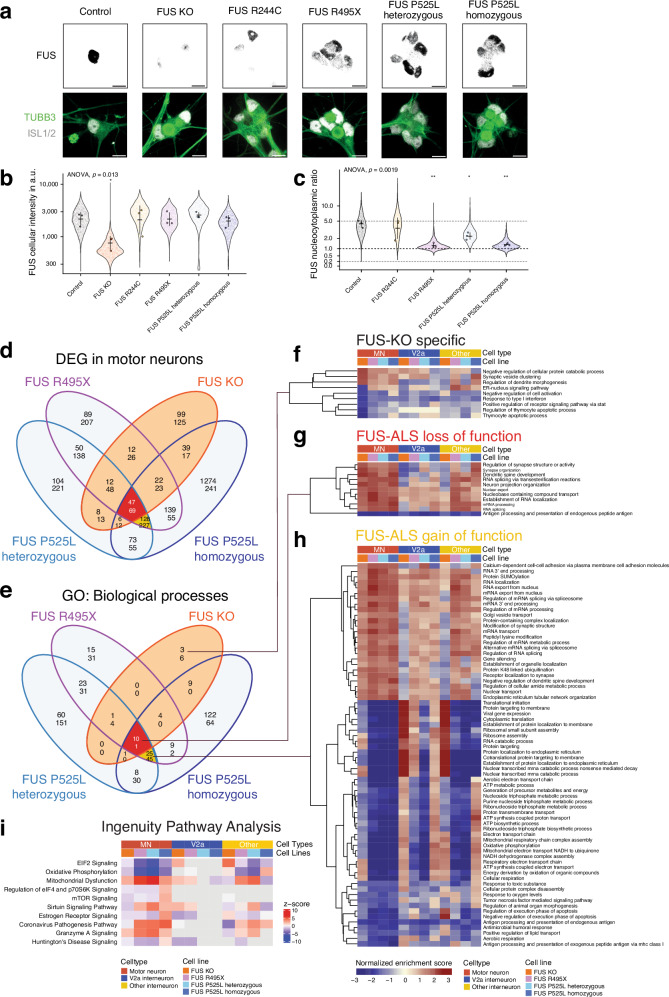
Mutations in FUS and TARDBP cause amyotrophic lateral sclerosis (ALS), but the precise mechanisms of selective motor neuron degeneration remain unresolved. To address if pathomechanisms are shared across mutations and related to either gain- or loss-of-function, we performed single-cell RNA sequencing across isogenic induced pluripotent stem cell-derived neuron types, harbouring FUS P525L, FUS R495X, TARDBP M337V mutations or FUS knockout. Transcriptional changes were far more pronounced in motor neurons than interneurons. About 20% of uniquely dysregulated motor neuron transcripts were shared across FUS mutations, half from gain-of-function. Most indicated mitochondrial impairments, with attenuated pathways shared with mutant TARDBP M337V as well as C9orf72-ALS patient motor neurons. Mitochondrial motility was impaired in ALS motor axons, even with nuclear localized FUS mutants, demonstrating shared toxic gain-of-function mechanisms across FUS- and TARDBP-ALS, uncoupled from protein mislocalization. These early mitochondrial dysfunctions unique to motor neurons may affect survival and represent therapeutic targets in ALS.


Conflict of interest statement

Competing interests: The authors have no competing interests.

Figures

Fig. 1
Fig. 1. Single-cell RNA-Sequencing identifies RNA dysregulation specific to motor neurons with FUS mutations in a dose-dependent manner.
a Schematic showing generation of the different iPSC-lines using CRISPR-Cas9 gene editing, subsequent differentiation into motor neurons and interneurons, sorting and single-cell RNA sequencing. be UMAP projections of all cells of the included cell lines that passed quality control. The two UMAPs on the left are colored by (b) assigned cell type or (c) cell line, the two on the right contain neuronal cells only, again colored by assigned (d) cell type or (e) cell line. f Gene expression heatmaps of all neuronal cells, showing expression data of several (motor-) neuronal marker genes, progenitor markers and housekeeping genes. g Gene expression heatmaps of specific motor- and interneuron subtype marker genes. h Violin plots of the FUS mRNA expression in the control and ALS mutant lines across cell types. The normalized expression is given as log10(RPKM  +  1). Differential expression was performed within cell type, across lines. Error bars show mean ± standard error of the mean (SEM). * p  <  0.05, ** p  <  0.01, *** p  <  0.001, derived from two-sided DEA testing using DESeq2 and corrected for an FDR of 0.05. The p-values are 6.48E-5 for control vs. FUS P525L in motor neurons, and 1.86E-4 for FUS P525L homozygous motor neuron vs. FUS P525L homozygous V2a. i Upset plots of the intersections between DEGs in motor neurons, V2a interneurons and other interneurons between the FUS mutant lines versus the control cell line. Each column represents a section of a Venn diagram of the cell types as indicated in the table below. The corresponding Venn diagram is shown in the insets. The red (top) and blue (bottom) columns represent upregulated and downregulated genes, respectively. Genes with an adjusted p-value of <0.05 were considered differentially expressed.
Fig. 2
Fig. 2. Shared dysregulated pathways in motor neurons across FUS mutations link mainly to gain-of-function.
a Confocal fluorescence microscopy with immunostaining of n-terminal FUS in motor neurons (TUBB3+, ISL1/2+) at day 28 reveals cytoplasmic accumulation of FUS R495X as well as P525L and ablation in the FUS KO line. Schematics with representative patterns of different nuclear and cytoplasmic FUS protein localization in the cell lines used in this study. Scale bars are 10 µm. b, c The intracellular FUS localization was quantified by high-throughput immunofluorescence microscopy by measuring the total cellular (b) and compartmentalized FUS levels in ISL1+ motor neurons in 3d image stacks, followed by calculation of the nucleocytoplasmic ratio of FUS levels (c). Each dot in the violin plot represents measurement in a single cell, the outlined points are the average levels in three independent differentiation rounds using the homogenous protocol. Bar and whiskers show the mean ± standard deviation across the independent differentiation rounds. ANOVA was conducted on average levels in the three independent differentiation rounds across cell lines and post-hoc pairwise two-sided t-tests between the control and mutant lines. * p  <  0.05, ** p  <  0.01, *** p  <  0.001. In panel b, the p-values are 0.012 (FUS KO), 0.917 (FUS R244C), 0.965 (FUS R495X), 0.4557 (FUS P525L heterozygous), and 0.699 (FUS P525L homozygous). In panel C, the p-values are 0.5607 (FUS R244C), 0.0018 (FUS R495X), 0.0147 (FUS P525L heterozygous), and 0.0053 (FUS P525L homozygous). d Venn diagram shows the overlap between DEGs in the different FUS mutant and control motor neurons. Genes with an adjusted p-value of < 0.05 (two-sided DEA test with DESeq2 corrected for an FDR of 0.05) were considered differentially expressed. GO (biological process) pathways enriched or depleted in the different FUS mutant compared to the control motor neurons (using GSEA). For d, e in each Venn compartment, the top number represents upregulated genes/processes, while the bottom number represents downregulated genes/processes. Pathways with an adjusted p-value of < 0.05 were considered significantly up- or downregulated. fh Heatmaps display the normalized enrichment scores (from GSEA) of selected groups of pathways from the Venn diagram in (c). Motor neurons are compared to V2a or other interneurons to show specific or stronger regulation of these pathways in motor neurons. i Top dysregulated pathways across FUS mutant motor neurons using the Ingenuity Pathways Analysis.
Fig. 3
Fig. 3. The TARDBP M337V mutation results in transcriptomic dysregulation unique to motor neurons.
a Schematic of the generation of the TARDBP M337V mutant iPSC line, differentiation into motor neurons and subsequent single-cell sorting and RNA-sequencing. b UMAP projections of all single cells in the study that passed quality control. The two UMAPs are colored by assigned cell type (left) or cell line (right). c UMAP projections of all neuronal cells in the study that passed quality control, again colored by assigned cell type (left) or cell line (right). d TDP-43 is mainly nuclear in the TARDBP M337V line. Confocal fluorescence microscopy with immunostaining of antibodies against TDP-43 and phospho-TDP-43 (S409/S410) in motor neurons (TUBB3 + , ISL1/2 + ) at day 28. Scale bars are 10 µm. e, f Violin plots for the quantitative immunofluorescence measurements of intracellular TDP-43 levels and phospho-TDP-43 levels in ISL1+ TUBB3+ motor neurons. The nucleocytoplasmic ratio for TDP-43 was calculated and shown in (e) and the cytoplasmic levels of phospho-TDP-43 (S409/S410) is shown in (f). The dots with black represent the average per independent differentiation (n = 3), while other dots represent individual well averages. The p-values were obtained from two-sided Wilcoxon rank sum test. g Violin plots of the TARDBP mRNA expression in the control and TARDBP M337V lines across cell types. The normalized expression is given as RPKM. Differential expression was performed within cell type, across lines. Error bars show mean ± SEM, * p  <  0.05, ** p  <  0.01, *** p  <  0.001, derived from two-sided DEA testing using DESeq2 corrected for an FDR of 0.05. The p-value for the V2a to motor neuron comparison in the TARDBP M337V line is 0.11. h Upset plots showing the overlap between DEGs in motor neurons, V2a interneurons and other interneurons between the TARDBP M337V mutant lines versus the control cell line. Each column represents a section of a Venn diagram of the cell types as indicated in the table below. The corresponding Venn diagram is shown in an insert. The red top and blue bottom columns represent upregulated and downregulated genes, respectively. Genes with an adjusted p-value of <0.05 (two-sided DEA with DESeq2) were considered differentially expressed. i Analysis of upstream regulators in the DEGs between TARDBP M337V and control motor neurons using the Ingenuity Pathway Analysis suite. The regulator TARDBP is highlighted with an activation z-score of -3.13, indicative of its inhibition in the TARDBP M337V cell line.
Fig. 4
Fig. 4. Cross-comparisons among FUS-, TARDBP-, and C9orf72-ALS reveal shared dysfunctions that converge on metabolic pathways.
a Strategy to uncover shared dysfunction across familial ALS forms that could uncover convergent pathomechanisms that are intrinsic to motor neurons. Cross-comparison of FUS-ALS and TARDBP-ALS motor neurons across our single-cell RNA-Seq data set (bd) followed by cross-comparison with external bulk RNA-Seq dataset from C9orf72-ALS was thus conducted (e, f). b Venn diagram showing overlap of DEGs between all FUS mutant motor neurons, as well as the TARDBP mutant motor neurons, as compared to control. Genes with an adjusted p-value of <0.05 were considered differentially expressed. c, Venn diagram showing overlap in dysregulated biological processes between FUS LOF lines (all FUS lines), FUS GOF lines (excluding the FUS KO), and the TDP-43 M337V line following GSEA. For b, c in each compartment, the top number represents upregulated genes/pathways, while the bottom number represents downregulated genes/pathways. Pathways with an adjusted p-value of <0.05 (two-sided DEA with DESeq2 corrected for an FDR of 0.05) were considered significantly up- or downregulated. d Heatmaps displaying normalized enrichment scores from GSEA of selected groups of pathways from the Venn diagram in (c). Motor neurons are compared to V2a interneurons to show specific or stronger regulation of these pathways in motor neurons. e Venn diagram depicting the overlap between dysregulated biological processes in TARDBP M337V and the ALS-FUS GOF and LOF groups defined in Fig. 3. f Venn diagram depicting the overlap between dysregulated pathways from the single cells RNA-Seq of ALS mutant motor neurons (FUS R495X, FUS P525L lines and TARDBP M337V) and the bulk RNA-Seq of C9orf72-ALS motor neurons. g Pairwise set comparisons of the dysregulated pathways in the Venn diagram from (f). The odds ratio of the overlap against all dysregulated pathways in the Venn diagram is shown as the bubble colour. The bubble size is the adjusted p-value of the overlap calculated by two-sided Fisher’s exact test; the asterisk indicates comparisons for which the odds ratio is larger than five-fold.
Fig. 5
Fig. 5. Dysregulation in key mitochondrial genes and pathways points to mitochondrial impairment in motor neurons across isogenic ALS lines.
a The mean expression changes of respiratory genes in ALS motor neurons (as mean log2 foldchange of FUS R495X, FUS P525L heterozygous, FUS P525L homozygous, and TARDBP M337V compared to control) were mapped to the protein structures of the mammalian mitochondrial respiratory complexes I–V (PDB entries 5lc5, 1zoy, 1bgy, 1occ, and 5ara) and rendered in UCSF Chimera. The composition was inspired by Sousa et al. The location of genes from expression plots in (c, e, g) are indicated with pointers. b, d, f Modified GSEA plots showing the rank of all genes within this specific GO-term for all mutant motor neurons generated using the homogeneous protocol, according to the GSEA test statistic. The most significantly upregulated gene is on the top and the most significantly downregulated gene on the bottom. c, e, g Violin plots showing normalized expression values (RPKM) of three example genes of the pathway from (b, d, f) in motor neurons generated with the homogeneous protocol. Error bars show mean ± SEM. * p  <  0.05, ** p  <  0.01, *** p  <  0.001 vs. control, derived from two-sided DEA testing in DESeq2 corrected for an FDR of 0.05. The p-values for COX6A1 are 9.5E-3 (FUS KO), 4.3E-7 (FUS R495X), 6.4E-10 (FUS P525L heterozygous), 2.7E-7 (FUS P525L homozygous), and 6.8E-2 (n.s., TARDBP M337V). The p-values for NDUFS6 are 9.1E-1 (n.s., FUS KO), 5.3E-5 (FUS R495X), 1.7E-4 (FUS P525L heterozygous), 5.5E-3 (FUS P525L homozygous), and 3.4E-1 (n.s., TARDBP M337V). The p-values for NDUFA12 are 6.6E-1 (n.s., FUS KO), 4.9E-3 (FUS R495X), 4.4E-4 (FUS P525L heterozygous), 4.5E-6 (FUS P525L homozygous), and 2.6E-3 (TARDBP M337V). The p-values for ATP5MF are 7.8E-1 (n.s., FUS KO), 2.7E-6 (FUS R495X), 4.6E-5 (FUS P525L heterozygous), 1.2E-3 (FUS P525L homozygous), and 2.1E-1 (n.s., TARDBP M337V). The p-values for COX7C are 9.6E-1 (n.s., FUS KO), 1.5E-5 (FUS R495X), 7.6E-6 (FUS P525L heterozygous), 2.0E-3 (FUS P525L homozygous), and 6.1E-1 (n.s., TARDBP M337V). The p-values for NDUFB9 are 3.5E-1 (n.s., FUS KO), 1.3E-4 (FUS R495X), 3.8E-6 (FUS P525L heterozygous), 1.2E-8 (FUS P525L homozygous), and 1.2E-4 (TARDBP M337V).The p-values for MT-CO3 are 2.5E-3 (FUS KO), 2.4E-7 (FUS R495X), 8.5E-4 (FUS P525L heterozygous), 5.1E-9 (FUS P525L homozygous), and 6.0E-7 (TARDBP M337V). The p-values for MT-ND3 are 7.5E-1 (n.s., FUS KO), 5.3E-9 (FUS R495X), 6.2E-10 (FUS P525L heterozygous), 1.8E-1 (n.s., FUS P525L homozygous), and 1.2E-11 (TARDBP M337V). The p-values for MT-ATP6 are 5.3E-1 (n.s., FUS KO), 3.2E-4 (FUS R495X), 1.9E-2 (FUS P525L heterozygous), 3.3E-5 (FUS P525L homozygous), and 1.4E-13 (TARDBP M337V). h Confocal fluorescence microscopy with immunostaining of mitochondrial complex I (NDUFA12) or complex IV (MT-CO1, MT-CO2, MT-CO3) markers was performed in several wells per motor neuron line and in three independent differentiations each. The axons and mitochondria were stained using NEFM and TOM22 markers respectively. Scale bars are 30 µm. The location of example images for panels i-l are indicated by boxes. il Quantitative immunofluorescence of the expression levels of MT-CO1, MT-CO2, MT-CO3, and NDUFA12 in TOM22+ mitochondria in NEFM+ neurites. The violin plots represent the expression levels in individual mitochondria, the dots are the mean in replicate regions, and the colors are three independent motor neuron differentiation with the homogenous protocol. The p-values were calculated with two-sided Wilcoxon rank sum test between mutant and control motor neurons and significance levels are ns p  > = 0.05, * p  <  0.05, ** p  <  0.01, *** p  <  0.001. The p-values for MT-CO1 expressions are 0.0023 (FUS R495X), 0.49 (FUS P525L homozygous), 0.19 (TARDBP M337V). The p-values for MT-CO2 expressions are 0.0014 (FUS R495X), 0.94 (FUS P525L homozygous), 0.085 (TARDBP M337V). The p-values for MT-CO3 expressions are 0.12 (FUS R495X), 0.064 (FUS P525L homozygous), 0.0014 (TARDBP M337V). The p-values for NDUFA12 expressions are 0.0013 (FUS R495X), 0.15 (FUS P525L homozygous), 0.89 (TARDBP M337V). m, n Mitochondria in motor neurons were quantified by the copy number of mitochondrial genomes per nuclear genomes by qRT-PCR on total DNA extracted from cultures at the indicated time-points in motor neurons from the DF6-9-9T.B (m, our lines) and KOLF2.1 J background (l).
Fig. 6
Fig. 6. ALS motor axons show dysfunction in mitochondrial motility.
a Schematic of the mitochondrial motility assays using live fluorescence microscopy. Motor neuron progenitors were attached as neurospheres, followed by terminal differentiation and axon outgrowth. Mitochondria were labeled using TMRM. bd Individual mitochondria become discernable at increasing magnifications (b, c), and were recorded in peripheral axons (d). Scale bars are as indicated, ranging from 500 µm down to 20 µm. e 6-min long timelapses were recorded at 0.5 Hz in 3,4 locations in at least 3 attached neurospheres from several independent differentiations per line (namely control n = 4, FUS KO n  = 5, FUS R244C n = 3, FUS R495X n  = 2, FUS P525L heterozygous n = 4, FUS P525L homozygous n = 5, TARDBP M337V n = 5). Traces were identified using TrackMate 7 with StarDist detector and simple LAP tracer and directional movement was analyzed in R using our package ‘mitotrackR’. f The proportions of stationary and motile mitochondria were calculated. The three axes represent these proportions in the three motility groups in ternary plots. Each bubble represents the number of mitochondria in individual recordings. The dashed lines indicate 50% thresholds in each motility group and the dotted lines are the anterograde-retrograde isoproportional lines (at which the anterograde and retrograde movement are equal). g The influence of the mutation in isogenic motor neurons on the mitochondrial motility (as the proportions of stationary, anterograde and retrograde mobile mitochondria) was assessed by Pearson’s χ2 test (one-sided, χ2  =  88192, df = 12, p <  2.2e-16). The association between isogenic mutants and mitochondrial motility is plotted. The sign of the residuals indicates the direction of the association, with attraction and repulsion colored as red and blue, respectively. The bubble size represents the contribution to the total χ2 score (squared residuals over χ2 statistic). h Mitochondria align across motor axons, such that each mitochondrion has a pair of nearest neighbors in the anterograde and retrograde direction. In the first frame of each recording from (f, g) the Euclidean distances between individual mitochondria as well as the distance from each mitochondrion to the pair of adjacent mitochondria was measured to then calculate the distance across the three mitochondria as well as the absolute difference between the pair of nearest neighbors in the opposing directions. The violin plots represent values for individual mitochondria, the colored dots the average value in each video, and the black dots and whiskers are median ± the confidence interval (α  =  0.05). ANOVA was followed by post-hoc two-sided Wilcoxon rank sum test between mutant and control lines and the significance levels for the p-values are ns p  > = 0.05, * p  <  0.05, ** p  <  0.01, *** p  <  0.001. The p-values for mitochondria spacing are 0.0159 (FUS KO), 0.0159 (FUS R244C), 0.0159 (FUS R495X), 0.0079 (FUS P525L heterozygous), 0.0025 (FUS P525L homozygous), and 0.0079 (TARDBP M337V). The p-values for the distances across adjacent mitochondria are 0.0159 (FUS KO), 0.0159 (FUS R244C), 0.0159 (FUS R495X), 0.0079 (FUS P525L heterozygous), 0.0025 (FUS P525L homozygous), and 0.0079 (TARDBP M337V). The p-values for the absolute difference are 0.0317 (FUS KO), 0.0317 (FUS R244C), 0.0159 (FUS R495X), 0.0079 (FUS P525L heterozygous), 0.0051 (FUS P525L homozygous), and 0.0079 (TARDBP M337V).

References

    1. Nijssen, J., Comley, L. H. & Hedlund, E. Motor neuron vulnerability and resistance in amyotrophic lateral sclerosis. Acta Neuropathol.133, 863–885 (2017). - PMC - PubMed
    1. Schweingruber, C. & Hedlund, E. The cell autonomous and non-cell autonomous aspects of neuronal vulnerability and resilience in amyotrophic lateral sclerosis. Biol. (Basel)11, 1191 (2022). - PMC - PubMed
    1. Swinnen, B. & Robberecht, W. The phenotypic variability of amyotrophic lateral sclerosis. Nat. Rev. Neurol.10, 661–670 (2014). - PubMed
    1. DeJesus-Hernandez, M. et al. Expanded GGGGCC hexanucleotide repeat in noncoding region of C9ORF72 causes chromosome 9p-Linked FTD and ALS. Neuron72, 245–256 (2011). - PMC - PubMed
    1. Vance, C. et al. Mutations in FUS, an RNA processing protein, cause familial amyotrophic lateral sclerosis type 6. Science323, 1208–1211 (2009). - PMC - PubMed

MeSH terms