

The type of food influences the behaviour of Listeria monocytogenes in a food-gastrointestinal-infection model
- PMID: 40389416
- PMCID: PMC12089613
- DOI: 10.1038/s41538-025-00436-5
The type of food influences the behaviour of Listeria monocytogenes in a food-gastrointestinal-infection model
Abstract
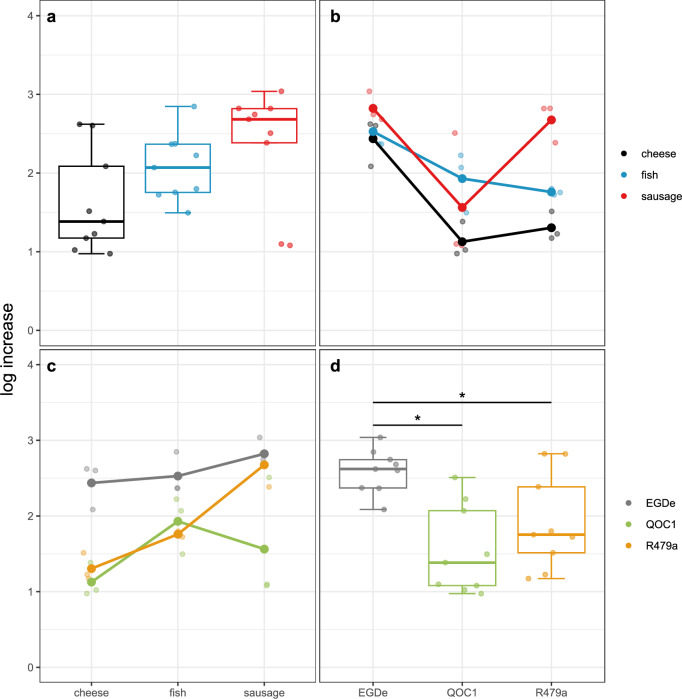
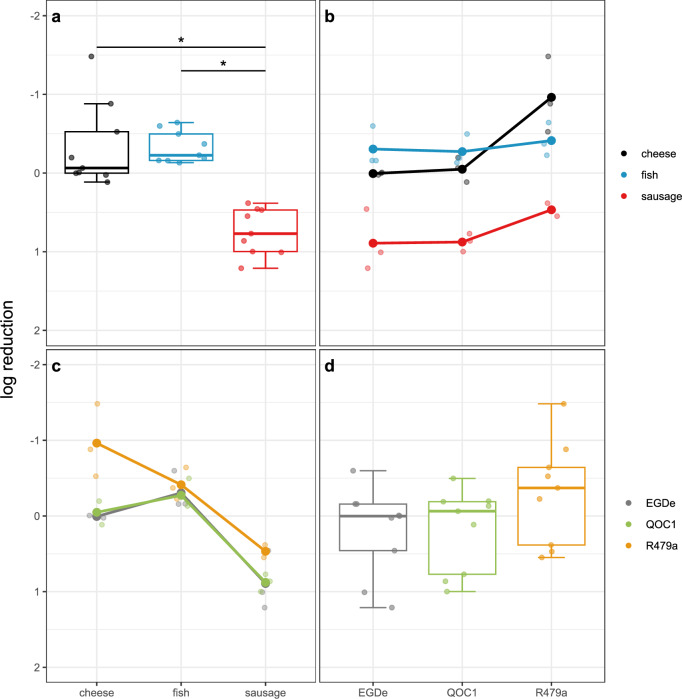
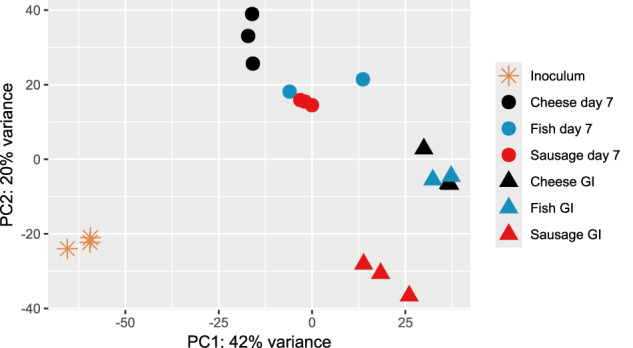
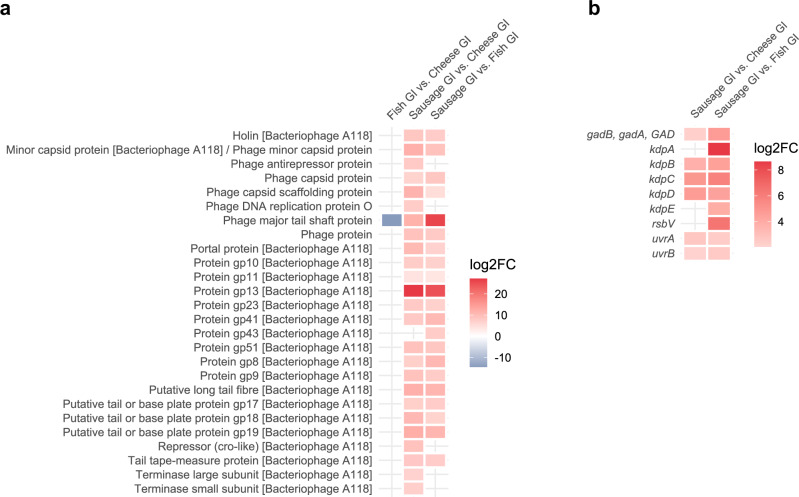
Food contaminated with Listeria (L.) monocytogenes is the main source of human listeriosis, but how different food matrices affect the survival and invasion in the gastrointestinal (GI) tract is still unclear. This study examined three ready-to-eat foods - soft-cheese, smoked salmon, and sausage - using a food-GI-infection model. We observed strain-dependent growth rates, but food matrices did not significantly impact growth. However, nutrient sources altered gene expression. Passage through the GI model upregulated 23 stress genes and 29 virulence genes (e.g., clpE, hly, and plcB). L. monocytogenes survival was higher in cheese and fish compared to sausage, due to their lower buffer capacity. Invasion efficiency into Caco-2 cells was highest in fish, potentially linked to its fatty acid composition. Food matrices and GI conditions influenced the transcriptional profiles of stress-associated and virulence genes. This study highlights the significant role of food matrices in L. monocytogenes survival and infection.
© 2025. The Author(s).
Conflict of interest statement
Competing interests: The authors declare no competing interests.
Figures


References
-
- Pérez-Rodríguez, F., Carrasco, E., Bover-Cid, S., Jofré, A. & Valero, A. Closing gaps for performing a risk assessment on Listeria monocytogenes in ready-to-eat (RTE) foods: activity 2, a quantitative risk characterization on L. monocytogenes in RTE foods; starting from the retail stage. EFSA Support. Publ.14, 1252E (2017).
-
- EFSA Multi-country outbreak of Listeria monocytogenes clonal complex 8 infections linked to consumption of cold-smoked fish products. EFSA Support. Publ.16, 1665E (2019).
-
- Fretz, R. et al. Listeriosis outbreak caused by acid curd cheese ‘Quargel’, Austria and Germany 2009. Eurosurveillance15, 19477 (2010). - PubMed
Grants and funding
- P27920-B22/Austrian Science Fund (FWF)
- P27920-B22/Austrian Science Fund (FWF)
- 881882/The Austrian COMET-K1 competence centre for Feed and Food Quality, Safety and Innovation (FFoQSI) is funded by the Austrian federal ministries BMK, BMDW and the Austrian provinces Lower Austria, Upper Austria and Vienna within the scope of COMET.
- 881882/The Austrian COMET-K1 competence centre for Feed and Food Quality, Safety and Innovation (FFoQSI) is funded by the Austrian federal ministries BMK, BMDW and the Austrian provinces Lower Austria, Upper Austria and Vienna within the scope of COMET.
- 881882/The Austrian COMET-K1 competence centre for Feed and Food Quality, Safety and Innovation (FFoQSI) is funded by the Austrian federal ministries BMK, BMDW and the Austrian provinces Lower Austria, Upper Austria and Vienna within the scope of COMET.
LinkOut - more resources
Full Text Sources
