. 2025 May 19;16(1):4664.
doi: 10.1038/s41467-025-59880-2.

A CRISPR/Cas9-based enhancement of high-throughput single-cell transcriptomics

Affiliations

A CRISPR/Cas9-based enhancement of high-throughput single-cell transcriptomics

Amitabh C Pandey et al. Nat Commun. .

Abstract

Single-cell RNA-seq (scRNAseq) struggles to capture the cellular heterogeneity of transcripts within individual cells due to the prevalence of highly abundant and ubiquitous transcripts, which can obscure the detection of biologically distinct transcripts expressed up to several orders of magnitude lower levels. To address this challenge, here we introduce single-cell CRISPRclean (scCLEAN), a molecular method that globally recomposes scRNAseq libraries, providing a benefit that cannot be recapitulated with deeper sequencing. scCLEAN utilizes the programmability of CRISPR/Cas9 to target and remove less than 1% of the transcriptome while redistributing approximately half of reads, shifting the focus toward less abundant transcripts. We experimentally apply scCLEAN to both heterogeneous immune cells and homogenous vascular smooth muscle cells to demonstrate its ability to uncover biological signatures in different biological contexts. We further emphasize scCLEAN's versatility by applying it to a third-generation sequencing method, single-cell MAS-Seq, to increase transcript-level detection and discovery. Here we show the possible utility of scCLEAN across a wide array of human tissues and cell types, indicating which contexts this technology proves beneficial and those in which its application is not advisable.


Conflict of interest statement

Competing interests: During the course of this project and/or manuscript preparation, J.B., D.D., A.C., K.C., J.D., A.S., S.R., K.B., and J.A. were employees of Jumpcode Genomics. All other authors declare no competing interests.

Figures
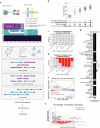
Fig. 1
Fig. 1. Evaluation of scCLEAN performance on human tissues and cell types.
a Schematic representing the scCLEAN-mediated removal of abundant sequences from scRNAseq libraries. A single sgRNA pool was constructed from four unique sgRNA pools: (1) genomic intervals (teal), (2) non-polyadenylated rRNA (seafoam), (3) 90 ribosomal nuclear-encoded protein-coding and 10 mitochondrial genes (Ribo/Mito; purple), and (4) 155 non-variable genes (NVG; light purple). b Distribution of the percentage of reads aligning to targeted regions after iteratively filtering reads corresponding to each of the four sgRNA guide-sets across 14 datasets. The median percentage breakdown is as follows: rRNA = 10%, Ribo/Mito = 34%, Genomic Intervals = 9%, and NVG = 5% for a cumulative sum of 58%. ce Analysis of the 255 gene panel using the Tabula Sapiens Consortium corresponding to 161 unique cell types across 24 organs. c Proportion of 255 targeted genes (red) from the total transcriptome across seven bins ranked according to (normalized variance) ranging from “Not Variable” to “Cell-Type Specific”. Each bin contains an equal interval length between the minimum and maximum variances. The sum of genes in each bin were tallied and proportions of the 255 genes in each bin were evaluated. d Same as in c, except genes were ranked by mean gene expression (log(x + 1) normalized) and binned according to normalized mean gene expression ranging from “Lowest Expression” to “Highest Expression.” e GSEA of the 255 gene panel within the Tabula Sapiens dataset between all 161 cell-types. Genes were ranked by normalized variance with the highest variance genes ranked at the top of the list. The normalized enrichment score (NES) is shown along with the p value and false discovery rate. The location of the 255 targeted genes in the ranked list are indicated as blue dashes. f Gene scatter plot of biological variability (normalized variance) versus mean expression (log(x + 1) normalized). Dotted black line indicates zero variance. The top 8 genes within the 255 targeted gene panel are annotated with variance > 1. g Table summarizing the counts of tissue-specific genes from the 255 gene panel obtained from GTEx. Tissue-specific genes were quantified using the extended tau score metric and the intersection with the 255 gene panel were counted per tissue. Box plots depict the minimum, first quartile (Q1), median, third quartile (Q3), and maximum values for each group. Whiskers extend to the minimum and maximum values within 1.5×IQR from the quartiles. Detailed statistical values are available in Supplementary Data 3. Created in BioRender. Pandey, A. (2025) https://BioRender.com/g46i293.
Fig. 2
Fig. 2. scCLEAN increases cell genetic complexity enhancing PBMC cell type characterization.
a Sankey diagram illustrating the redistribution of the proportion of aligned reads from the standard 10x-V3 workflow (left) to the workflow incorporating scCLEAN (right) separated into three buckets. The ‘Genomic’ bucket (purple) represents non-targeted intergenic reads; “Targeted Intervals” bucket (green) represents reads from scCLEAN-targeted molecules; “Informative Transcriptome” bucket (red) represents reads aligned to the transcriptome excluding targeted molecules. Percentages of each bucket are shown. b Box plots displaying the distribution of UMIs (proportion of total) corresponding to the top 50, 100, 200, 500 expressed genes. Comparisons are between a PBMC sample sequenced to ~80,000 reads per cell (>3-fold deeper), an experimental 10x-V3 sample from the same batch, a PBMC reference atlas compiled from 3 publications using scArches, an in silico modeled scCLEAN condition assuming 100% read removal, and 3 technical experimental replicates of scCLEAN. c Ridge plots comparing the library complexity measured as the ratio of median genes to median UMIs per cell. d Comparative bar plots displaying the optimized number of principal components calculated via random matrix theory to represent the biological signal identified. One scArches dataset was selected to ensure an accurate comparison between samples representing a single batch. e UMAP plots illustrating the cell types detected from query-reference mapping using the Azimuth PBMC dataset; 10x-V3 (left) with scCLEAN (right). 18 cell types with 1 uniquely identified within 10x-V3. 23 cell types with 6 uniquely identified within scCLEAN. f t-SNE clustering output derived from an unsupervised deep learning algorithm (DESC) iteratively spanning 11 different louvain resolutions starting with 0.1 and ending with 2 using 0.1 intervals. Representative t-SNE (top) clustering plots from a chosen resolution (0.8) showing 11 clusters in 10x-V3 and 17 clusters in scCLEAN with assignment probabilities shown below. g, h Metrics for integration accuracy from query-reference latent space projection using scArches. g UMAP plot for 10x-V3 (left) integration. Table for 10x-V3 (right) displaying integration metrics (graph connectivity, kBet, ASW). h Same as in (g), except showing metrics for scCLEAN.
Fig. 3
Fig. 3. scCLEAN improves immune cell type characterization with single-cell MAS-Seq.
a Schematic illustrating experimental workflow to incorporate scCLEAN into the MAS-Seq method. An amplified barcoded-cDNA pool generated with the 10X Genomics Chromium Controller was split and processed with MAS-Seq alone or in combination with scCLEAN (b) Sankey diagram as in Fig. 2a, except showing the flow from the MAS-seq method alone (left) to MAS-Seq with scCLEAN (right). c Transcripts aligning to the 255 gene panel were masked and the subsequent total number of identified transcript counts were binned into four categories via SQANTI3: full splice match (FSM), incomplete splice match (ISM), novel-in-catalog (NIC), and novel-not-in-catalog (NNIC). Differences in transcript quantities between 10x-V3 (blue) and scCLEAN (yellow) for each category were measured using a two-tailed t-test (n = 3; ns = p > 0.05, * = p ≤ 0.05, ** = p ≤ 0.01, *** = p ≤ 0.001). Error bars represent ±SEM. d Transcripts aligning to the 255 gene panel were masked and (left) histograms of the shift in distributions of UMIs per cell and genes per cell comparing 10x-V3 and scCLEAN are shown. (right) Violin plots of UMIs per cell and genes per cell. Each replicate (n = 3) is shown. Significance was quantified using a two-tailed Wilcoxon rank-sum test with Bonferroni correction (**** = p ≤ 0.0001). e UMAP plots representing the query-to-reference labels using the Azimuth PBMC reference. Comparison between 10x-V3 (left), scCLEAN (middle), and the cell types uniquely identified within scCLEAN (right). f Cells labeled as cDC1 within the scCLEAN condition were selected and treated as bulk. Track plots indicate read coverage over top 3 cDC1 markers (COX5A, BTLA, and ENPP1) comparing 10x-V3 (red), scCLEAN (blue), and overlap (purple). Ensembl transcript IDs are annotated below. Box plots depict the minimum, first quartile (Q1), median, third quartile (Q3), and maximum values for each group. Whiskers extend to the minimum and maximum values within 1.5 × IQR from the quartiles. Detailed statistical values are available in Supplementary Data 4.
Fig. 4
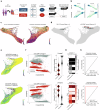
Fig. 4. scCLEAN identifies 2 lineages of VSMCs corresponding with the artery of origin.
a Schematic figure of experimental workflow. A total of ~50,000 VSMCs were isolated from 4 donors and 2 tissue locations: coronary and pulmonary artery. b Normalized density of cells along the force directed layout (FLE) according to their artery of origin comparing 10x-V3 (top) with scCLEAN (bottom). c RNA velocity stream plots along pseudotime (CytoTRACE) mapped onto the FLE embedding. All detected genes are utilized to automatically calculate early pseudotime (black) to late pseudotime (yellow) according to the number of genes expressed. Black arrows indicate direction of transcriptional transition. d The total number of terminal states identified using CellRank comparing 10x-V3 (left) and scCLEAN (right). Number of lineages are shown. Optimal terminal states were found using Schur decomposition (gap in the real portion of eigenvalues) and then refined according to stationary distance of the coarse-grained Markov transition matrix (non-zero distance). e Only scCLEAN is shown (>1 lineage). Absorption probability of each cell belonging to each lineage and thus differentiating along pseudotime into either of the 2 terminal states, corresponding with lineage 1 (top) and lineage 2 (bottom). Yellow represents a 100% probability of that cell belonging to that lineage. f (left) Lineage absorption probability (lineage 1 = top, lineage 2 = bottom) plotted as a function of each cell’s position along the differentiation trajectory (ct pseudotime). Colors reflect tissue origin: coronary (red) or pulmonary (gray) artery. (right) Violin plots of absorption probabilities across coronary and pulmonary arteries for each lineage. g Heat matrix illustrating the relationship between the quantified absorption probability of each cell belonging to each lineage compared to the ground truth arterial identity of that cell. h Receiver operating characteristic (ROC) depicting the classification performance of identifying each artery to each lineage (both pulmonary and coronary lineage AUC = 0.99). Created in BioRender. Pandey, A. (2025) https://BioRender.com/r94y754.
Fig. 5
Fig. 5. Coronary artery lineage of VSMCs uniquely expresses an inflammatory network.
a Genes with the highest correlation associated with each terminal state. Average gene expression sampled from 200 cells with an absorption probability >0.5 associated with each lineage (pulmonary lineage = top, coronary lineage = bottom) and mapped along pseudotime. b Dendrograms representing the principal graph (scFATES) inferred from scCLEAN terminal states. (left) Blue represents early pseudotime and yellow represents late pseudotime. (right) Cells colored according to arterial origin (coronary =  red, pulmonary = gray) projected along pseudotime. c Tree diagram highlighting onset of characteristic gene signatures (red) associated with pulmonary lineage (top) and coronary lineage (bottom). d Gene expression heatmaps of highest specificity (effect > 0.3) depicting early root cells (left), coronary lineage (middle), and pulmonary lineage (right). The smoothed gene expression is shown along pseudotime and colored by expression (low = blue and high = red). Gene specific pseudo-temporal activation to the pulmonary lineage (top; n = 91) and to the coronary lineage (bottom, n = 32). The top 15 genes for each arterial origin are depicted. e Feature plots of log(x + 1) normalized expression on the FLE embedding comparing the expression of 3 representative lineage markers specific to the pulmonary (top) and coronary (bottom) lineages. f Gene transition heatmap of top markers for the pulmonary (top) and coronary (bottom) bifurcation to reflect early decision-making processes prior to separation. The matrix contains inclusion timing for each gene in each probabilistic lineage projection. g Z-scored mean expression of inflammatory genes comparing coronary and pulmonary across three equivalent bins of pseudotime (early, middle, late). h The top five enriched lineage-specific pathways found using GSEA with all lineage-specific genes (correlation greater than 0.3). The combined score (y-axis) incorporates gene overlap and statistical significance. i Top regulons with differential expression between coronary and pulmonary lineages. Binarized regulon activity (SCENIC).

References

    1. Bouland, G. A., Mahfouz, A. & Reinders, M. J. T. Consequences and opportunities arising due to sparser single-cell RNA-seq datasets. Genome Biol.24. 10.1186/s13059-023-02933-w (2023). - PMC - PubMed
    1. Haghverdi, L., Lun, A. T. L., Morgan, M. D. & Marioni, J. C. Batch effects in single-cell RNA-sequencing data are corrected by matching mutual nearest neighbors. Nat. Biotechnol.36, 421–427 (2018). - PMC - PubMed
    1. Lähnemann, D. et al. Eleven grand challenges in single-cell data science. Genome Biol.21. 10.1186/s13059-020-1926-6 (2020). - PMC - PubMed
    1. Hicks, S. C., Townes, F. W., Teng, M. & Irizarry, R. A. Missing data and technical variability in single-cell RNA-sequencing experiments. Biostatistics19, 562–578 (2018). - PMC - PubMed
    1. Phipson, B., Zappia, L. & Oshlack, A. Gene length and detection bias in single cell RNA sequencing protocols. F1000Research6, 595 (2017). - PMC - PubMed

MeSH terms

LinkOut - more resources