. 2025 May 19;16(1):4623.
doi: 10.1038/s41467-025-59916-7.

Intestinal permeability of N-acetylcysteine is driven by gut microbiota-dependent cysteine palmitoylation

Affiliations

Intestinal permeability of N-acetylcysteine is driven by gut microbiota-dependent cysteine palmitoylation

Yu-Hang Zhang et al. Nat Commun. .

Abstract

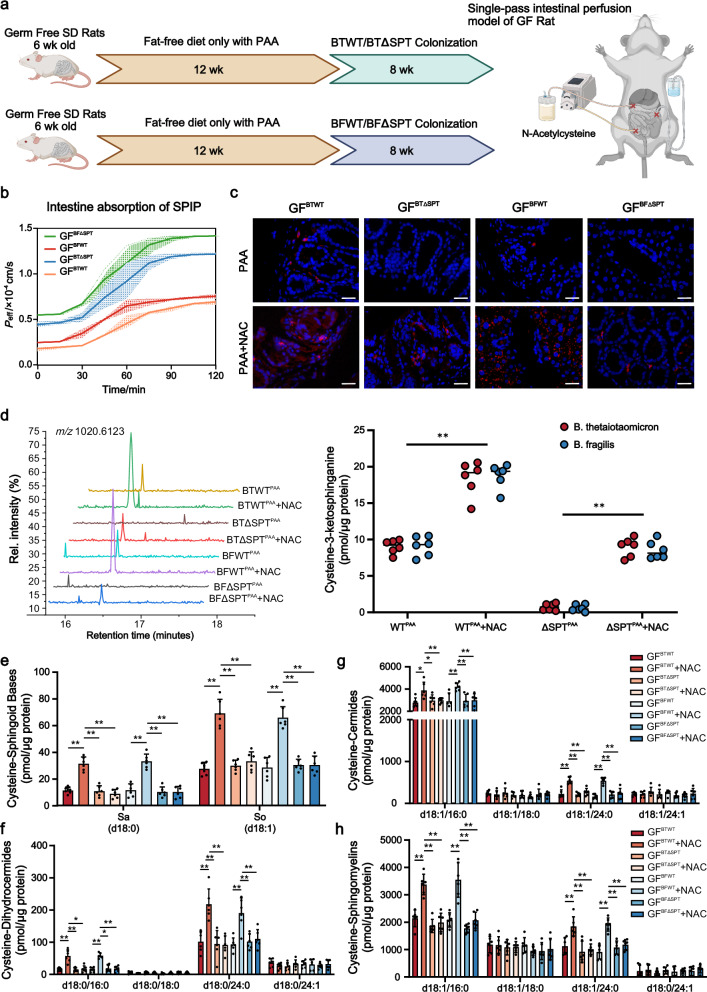
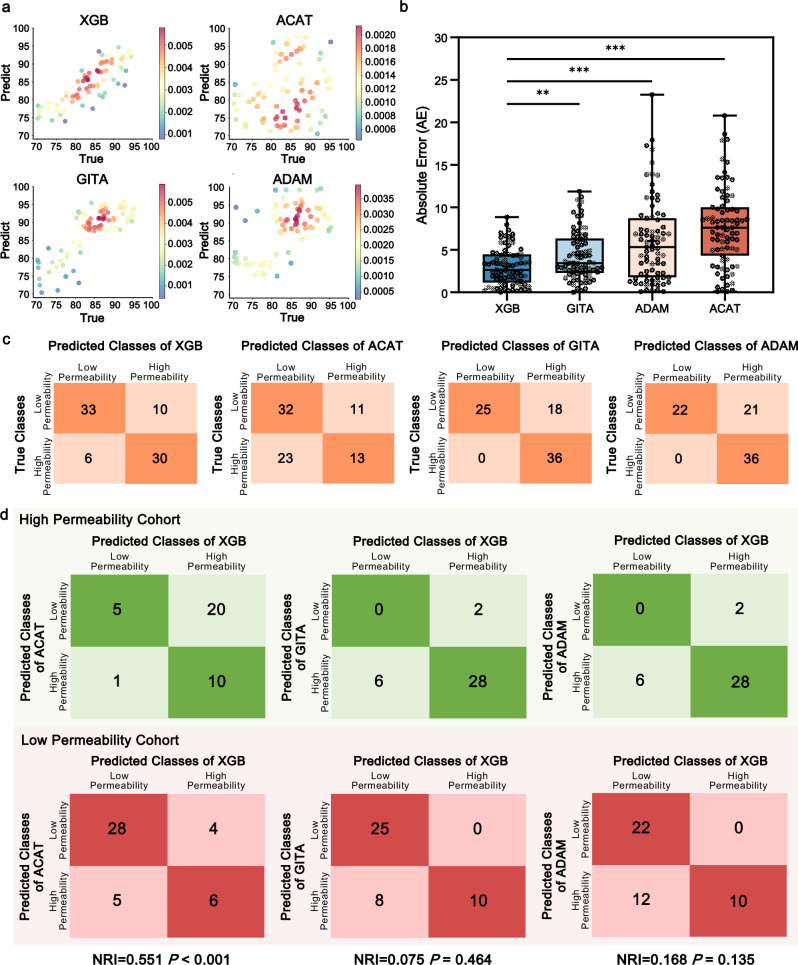
Trillions of intestinal microbiota are essential to the permeability of orally administered drugs. However, identifying microbial-drug interactions remains challenging due to the highly variable composition of intestinal flora among individuals. Using single-pass intestinal perfusion (SPIP) platform, we establish the microbiota-based permeability screening framework involving germ-free (GF) and specific-pathogen-free (SPF) rats to compare in-situ Peff-values and metabolomic profiles of 32 orally administered drugs with disputable classifications of permeability, prior to the verifications of bioorthogonal chemistry and LC-MS/MS. In contrast with SPF controls, N-Acetylcysteine (NAC) exhibits significantly increased permeability in GF rats, which is inversely related to reduced cysteine-3-ketosphinganine by Bacteroides. To further validate these microbiome features, we integrate clinical descriptors from a prospective cohort of 319 participants to optimize a 15-feature eXtreme Gradient Boosting (XGB) model, which reveal that cysteine palmitoylation by intestinal microbiota has significantly affected NAC permeability. By comparison of net reclassification improvement (NRI) index, this machine learning (ML) model of clinical prediction model encompassing intestinal microbial features outperforms other three commercial models in predicting NAC permeability. Here we have developed an intestinal microbiota-based strategy to evaluate uncharacterized NAC permeability, thus accounting for its discordant biopharmaceutics classification.


Conflict of interest statement

Competing interests: The authors declare no competing interests.

Figures

Fig. 1
Fig. 1. Intestinal microbiota-mediated drug permeability screening revealed the potential dependency on microbiota for N-acetylcysteine (NAC).
a Schematic workflow of the microbiota-mediated oral drug permeability screening platform. Created in BioRender. Dai, C. (2025) https://BioRender.com/r8tvfj3. For each drug with individual variable permeability, single-pass intestinal perfusion (SPIP) model was conducted in age-matched specific pathogen-free (SPF) and germ-free (GF) rats. n  =  6 per group (the same applies hereinafter). After 2 h perfusion at 15-min intervals, the perfused and unperfused intestinal segments of rats were collected for microbiological detection, and the permeability of drugs was determined by SPIP. b Microbiota-drug-metabolite interaction network identified in this study. Left network: Effects of intestinal bacteria on drug permeability. Significant interactions in two independent screenings (n = 3 per screen) were validated in a follow-up assay (n = 3; FDR-corrected P < 0.05) are shown (Spearman’s rank tests). Right network: Differential intestinal metabolites between SPF and GF rats of drug exposure detected by two independent screenings (Spearman’s rank tests). c Z factor of intestinal microbiota effect on the given drugs in each SPF-GF rats pair, n = 6SPF * 6GF = 36. The value of Z factor > 0.5 indicates the positive effect. d 2 h of intestinal Peff-values for NAC (top panel), Lithium carbonate (middle panel) and Penicillin vk (bottom panel) were monitored at 15-min intervals. Data are the means ± SD. Source data are provided as a Source Data file.
Fig. 2
Fig. 2. B. thetaiotaomicron or B. fragilis leveraged on sphingolipids biosynthesis to hinder NAC permeability.
a Heat-map analysis of top 21 metabolites in intestinal fluid-derived metabolites between NAC-perfused GF and SPF rats. Each column represents one independent sample, and each row represents one metabolite. The color indicates the relative abundance of metabolites in each group. b Volcano plots to illustrate metabolites difference between NAC-perfused GF and SPF rats. Dots corresponding to significant lipids (P < 0.05, Student’s t tests) were colored, in which lipids with increased fold change were colored as red, and sphingolipids with decreased fold change pertained to green. c Histogram presentation of the KEGG pathway. A total of 99 differentiated functional pathways were successfully annotated and grouped into 10 functional categories. P values were determined using two-sided Fisher’s exact tests with Benjamini-Hochberg correction for multiple testing. d Summary of genus and species taxonomic changes in the gut microbiome of SPF rats following perfusion with 30 mg/L NAC. Taxonomic cladogram (e) and histogram (f) were generated by LEfSe of metagenomic analysis data in intestinal fluid samples derived from NAC-perfused and NAC-unperfused segments of SPF rats. g RT-qPCR to determine the 16S rRNA of B. thetaiotaomicron (left coordinate) and B. fragilis (right coordinate) absolute abundance in each group. n  =  6 per group. Data are the means ± SD, *P < 0.05, **P < 0.01 (Student’s t tests). h Correlation heat-map of microbial species abundance and metabolites after NAC perfusion in the intestine. Statistical significance was assessed using two-sided Pearson correlation analyses, with *P < 0.05, **P < 0.01, ***P < 0.001 indicating significant differences. i Cysteine-SL de novo synthesis pathway. SPT (serine palmitoyl transferase), KDSR (3-keto-dihydrosphignosine reductase), DES (desaturase), CerS (ceramide synthase), CDase (ceramidases). j Liquid chromatography-tandem mass spectrometry (LC-MS/MS) was utilized to identify and quantify palmitoyl-CoA (left panel) and cysteine-3-ketosphinganine (middle panel). The curve of left panel is representative image of each group. Data of right panel are presented as mean ± SD. Statistical significance was assessed using one-way ANOVA, with *P < 0.05, **P < 0.01 indicating significant differences. Source data are provided as a Source Data file.
Fig. 3
Fig. 3. Compared with wild-type intestinal B. thetaiotaomicron or B. fragilis, SPT deficiency enhanced NAC permeation.
a LC-MS/MS to quantify palmitoyl-CoA and cysteine-3-ketosphinganine in the separated BTWT/BFWT or BTΔSPT/BFΔSPT treated by 25 μM palmitoyl-CoA and 10 μM NAC. Data are the means ± SD. One-way ANOVA: *P < 0.05, **P < 0.01. b Schematic representation of the three-well co-culture system. Created in BioRender. Dai, C. (2025) https://BioRender.com/r8tvfj3. NAC is transferred through BTWT/BFWT or BTΔSPT/BFΔSPT cells in the upper well to differentiated Caco-2 cells in the middle well, followed by infiltration into the basal well for concentration measurement. c The reaction of azide-tagged SLs with cyclooccyne-tagged Alexa Flour 647 by strain-promoted azide-alkyne cycloaddition (SPAAC) principle, which facilitates the visualization and quantification of sphingolipid uptake and transport across the intestinal epithelium. d, e Exposed to 10 μM NAC, each group of azide-tagged lipids were continuously recorded with their relative immunofluorescent intensity changes (d). Representative images with the most significant inter-group differences of relative immunofluorescent intensity, selecting the dotted line of (d) at the time point of 3.227 h. Azide-tagged lipids were detected by Alexa Fluor 647 (red) and DNA was stained using DAPI (blue). Images are representative of three independent experiments, with the scale bar of 50 μm (e). n = 6 per group. f LC-MS/MS to quantify cysteine-3-ketosphinganine azide of the co-cocultured differentiated Caco-2 cells in each group. The curve is representative image of each group. g Correlation scatter plot of cysteine-3-ketosphinganine azide with Papp values in BTWTPAA + NAC group and BFWTPAA + NAC group (Pearson correlation analyses, n = 50). Source data are provided as a Source Data file.
Fig. 4
Fig. 4. SL-production capacity of colonized B. thetaiotaomicron and B. fragilis affected intestinal absorption of NAC.
a Experimental setting: age-matched GF rats were simultaneously fed with 12 weeks of fat-free diet with PAA (palmitoyl-CoA alkyne) before 8 weeks of BTWT/BFWT or BTΔSPT/BFΔSPT colonization. Then SPIP model of 30 mg/L NAC was conducted in each group. Created in BioRender. Dai, C. (2025) https://BioRender.com/r8tvfj3. b Monitoring of intestinal Peff-values over a 2-h period for each group, with measurements taken at 15-min intervals. Data are the means ± SD. c Intestinal tissue of GF rats inoculated with BTWT/BFWT or BTΔSPT/BFΔSPT grown in PAA. PAA-based metabolites were detected with Alexa Fluor 647 azide (red) using click chemistry, and nuclei of the intestinal epithelial cells were stained using DAPI (blue). Scale bar is 20 µm. Each experiment was repeated 6 times independently. The curve of left panel is representative image of each group. d LC-MS/MS to quantify cysteine-3-ketosphinganine alkyne across the groups. Data are the means ± SD. One-way ANOVA: *P < 0.05, **P < 0.01. Cysteine-sphinganine (cysteine-Sa) (d18:0) and cysteine-sphingosine (cysteine-So) (d18:1) (e), cysteine-dihydroceramides (cysteine-DHCer) (f), cysteine-ceramides (cysteine-Cer) (g) and cysteine-sphingomyelin (cysteine-SM) (h) in the NAC-perfused intestines of each group. Bar charts represent SL abundance ± SD for 6 rats per condition (two-way ANOVA, Tukey’s multiple comparison test, *P  <  0.05, **P  <  0.01). Source data are provided as Supplementary Fig. 5 and a Source Data file.
Fig. 5
Fig. 5. Machine learning (ML) model generated for clinically predicting NAC permeability.
a A total of 240 healthy participants were enrolled for the training and test of ML models, with 192 (80%) participants as training set for feature selection and hyperparameter optimization, and 48 (20%) participants as test set for evaluation. b Participant characteristics of test set. Each column represents an individual participant with the potential determinants correlated with NAC absorption. Participants were ranked by true values of NAC Fsys from high to low (left to right) and divided by Fsys of 85% for biopharmaceutics classification. c Box-whisker plot summaries the overall predictive performance of various ML models. The data represent the absolute error (AE) of fraction of dose entering the systemic circulation (Fsys) predictions obtained in test set (n = 48). The mean absolute error (MAE) and median AE of each model are displayed in the boxes as black “+” and black dashed lines, respectively. The first and third quartiles are shown by the upper and lower edges of the respective boxes, with the minima and maxima by the upper and lower solid lines. XGB eXtreme Gradient Boosting, LGBM Light Gradient Boosting Machine, k-NN k-Nearest Neighbors, SVR Support Vector Regressor, RF Random Forest, MLR Multiple Linear Regression, NN Neural Network, DT Decision Tree, PLS Partial Least Squares. d Receiver operating curve (ROC) for predicting NAC Fsys by XGB, LGBM, SVR and k-NN, with the area under the curve (AUC) values of 0.867, 0.838, 0.798 and 0.720, respectively. e Swarm plot illustrates the impact of each feature on Fsys according to their SHapley Additive exPlanation (SHAP) values. The color of the dots denotes the relative value of the feature within dataset (high-to-low depicted as pink-to-blue). The horizontal position of each dot represents whether the effect of each feature value contributes positively or negatively to the prediction instance. f Decision path taken for each Fsys prediction, illustrating how the XGB model combines the relative contribution of each feature to predict Fsys. g Rotate the force plot of all participants in the cohort 90° counterclockwise and obtain a global picture of the NAC Fsys prediction, clustered by similar risk factor combinations. Common characteristics of subpopulations of participants are referred to high (red) or low (blue) prediction probabilities. Source data are provided as a Source Data file.
Fig. 6
Fig. 6. The Fsys predictive performance of the XGB model outperformed advanced compartmental absorption and transit (ACAT), gastrointestinal transit and absorption (GITA) and advanced dissolution, absorption and metabolism (ADAM) models.
a Error scatter density plots to evaluate the predicted Fsys with true Fsys of XGB, ACAT, GITA and ADAM models. The dots color is determined by the kernel density estimation values (low-to-high correlation pertains to blue-to-red color). b Box-whisker plot summaries the predictive performance of the XGB, ACAT, GITA and ADAM models, which represent the AE of Fsys predictions of 79 participants. The MAE and median AE of each model were displayed in the boxes as black “+” and black dashed lines, respectively. The first and third quartiles are shown by the upper and lower edges of the respective boxes, with the minima and maxima by the upper and lower solid lines. One-way ANOVA: **P < 0.01, ***P < 0.001. c Confusion matrices of the dataset by XGB, ACAT, GITA and ADAM models. The numbers in each colored box represent the number of instances between the true and predicted classes obtained from the models. d Confusion matrices of predicted results comparing XGB models with ACAT, GITA and ADAM models, respectively. The numbers in each colored box indicate the instances between the predicted classes of XGB model and the other model. The green confusion matrices are derived from the high permeability cohorts (denoted as a1, b1, c1 and d1 from upper left to lower right, respectively), and the red ones derived from the low permeability cohorts (denoted as a2, b2, c2 and d2 from upper left to lower right, respectively). N1 = a1 + b1 + c1 + d1; N2 = a2 + b2 + c2 + d2. NRI = (c1-b1)/N1 + (b2-c2)/N2. Z=NRIb1+c1N12+b2+c2N22. P = (1-Z)*2. Source data are provided as a Source Data file.

Similar articles

References

    1. Garcia-Sanchez, S. et al. A new methodology to estimate drug cost avoidance in clinical trials: Development and application. Front. Oncol.12, 889575 (2022). - PMC - PubMed
    1. Ezeji, J. C. et al. Parabacteroides distasonis: intriguing aerotolerant gut anaerobe with emerging antimicrobial resistance and pathogenic and probiotic roles in human health. Gut Microbes13, 1922241 (2021). - PMC - PubMed
    1. Amidon, G. L., Lennernas, H., Shah, V. P. & Crison, J. R. A theoretical basis for a biopharmaceutic drug classification: The correlation of in vitro drug product dissolution and in vivo bioavailability. Pharm. Res.12, 413–420 (1995). - PubMed
    1. Samineni, R., Chimakurthy, J. & Konidala, S. Emerging role of biopharmaceutical classification and biopharmaceutical drug disposition system in dosage form development: a systematic review. Turk. J. Pharm. Sci.19, 706–713 (2022). - PMC - PubMed
    1. Bootz-Maoz, H. et al. Ex vivo intestinal permeability assay (X-IPA) for tracking barrier function dynamics. npj Biofilms Microbi9, 44 (2023). - PMC - PubMed

LinkOut - more resources