. 2025 May 19;16(1):4628.
doi: 10.1038/s41467-025-59759-2.

LLPS REDIFINE allows the biophysical characterization of multicomponent condensates without tags or labels

Affiliations

LLPS REDIFINE allows the biophysical characterization of multicomponent condensates without tags or labels

Mihajlo Novakovic et al. Nat Commun. .

Abstract

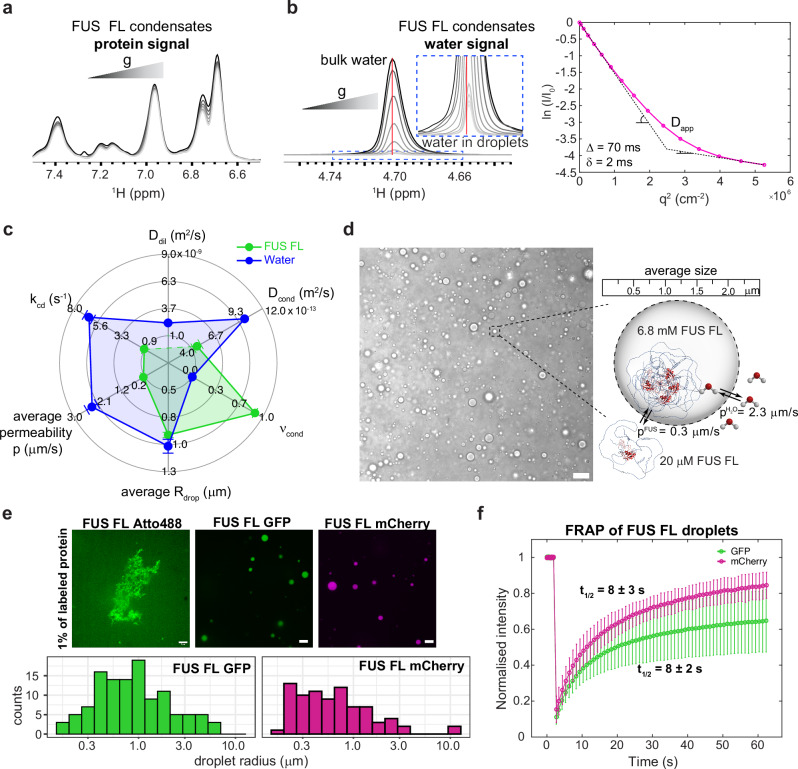
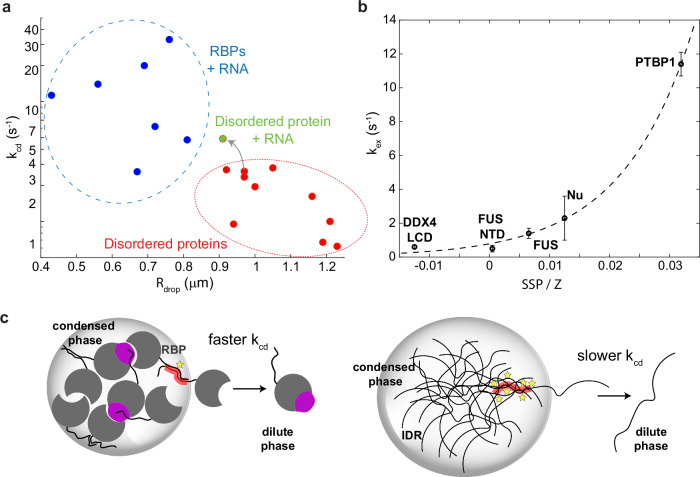
Liquid-liquid phase separation (LLPS) phenomenon plays a vital role in multiple cell biology processes, providing a mechanism to concentrate biomolecules and promote cellular reactions locally. Despite its significance in biology, there is a lack of conventional techniques suitable for studying biphasic samples in their biologically relevant form. Here, we present a label-free and non-invasive approach to characterize biomolecular condensates termed LLPS REstricted DIFusion of INvisible speciEs (REDIFINE). Relying on diffusion NMR measurements, REDIFINE exploits the exchange dynamics between molecules in the condensed and dispersed phases to determine not only diffusion constants and the fractions in both phases but also the average radius of the condensed droplets and the exchange rate between the phases. Observing proteins, RNAs, water, as well as small molecules, and even assessing the concentrations of biomolecules in both phases, REDIFINE analysis allows a rapid biophysical characterization of multicomponent condensates which is important to understand their functional roles. In comparing multiple systems, REDIFINE reveals that folded RNA-binding proteins form smaller and more dynamic droplets compared to the disordered ones.


Conflict of interest statement

Competing interests: The authors declare no competing interests.

Figures

Fig. 1
Fig. 1. FUS NTD characterization.
a A series of 1D proton spectra showing signal decay with increasing gradient strength in diffusion NMR experiment acquired on fresh FUS NTD sample using different diffusion times. Resonance highlighted in green contains an overlapping signals of tyrosine aromatic protons from both protein in dilute and condensed phase dispersed in agarose. b Decay of the integral of tyrosine signals plotted as I/I0=f(g) and ln(I/I0)=f(q2) illustrating the influence of diffusion time on droplet fraction and diffusion coefficients. c LLPS REDIFINE model and the ensuing fitting of the FUS NTD diffusion data set. Following parameters are determined: Ddil = 8.0 ± 0.2 × 10−11 and Dcond = 8.9 ± 0.7 × 10−13 m2/s, νcond = 0.753 ± 0.002, Rdrop = 1.21 ± 0.03 μm, p = 0.405 ± 0.007 μm/s and kcd = 1.00 ± 0.03 s−1 is derived from Rdrop and p. d Spider chart summarizes the properties of FUS NTD condensate and represents its REDIFINE fingerprint. 10 ms gradient length was used in (a, b). The final value for minimization function χ indicating the goodness of the fit is shown in (c). The uncertainties for each parameter are calculated using covariance matrix and report on the ambiguity of determined values. e FRAP experiment performed on FUS NTD spiked with 1% Atto488-labeled FUS NTD in 0.5% agarose. Scale bar is 5 μm. Data are presented as mean values +/− the standard deviation from the measurements on 4 different droplets. Source data are provided as a Source Data file.
Fig. 2
Fig. 2. Application of LLPS REDIFINE to full-length FUS condensates.
a A series of 1D proton spectra showing full-length FUS signal with increasing gradient strength in NMR diffusion experiment. Non-decaying signal implies a very high population of slow-diffusing FUS in the droplet. b Similarly, a series of 1D proton spectra showing the water signal from the same FUS sample. Note that based on different chemical shifts, there is a distinct population of bound water in the droplets. Water diffusion also exhibits biexponential behavior. c Summary of LLPS REDIFINE data set acquired on both protein and water signal, providing multicomponent characterization of FUS FL condensate. d LLPS REDIFINE allows us to “visualize” the FUS FL condensates, providing average droplet size, interface permeabilities, and concentrations in corresponding phases. Scale bar is 10 μm. e Fluorescent images acquired on FUS FL sample using different fluorescent tags. Analysis of droplet sizes could be performed in the case of GFP and mCherry tags, while the addition of 1% of Atto488-labeled protein causes aggregation. Scale bar is 5 μm. f FRAP recovery time course for GFP and mCherry tags. Data are presented as mean values +/− the standard deviation from the measurements on 4 different droplets. Experiments in (a) are acquired using 75 ms diffusion encoding time and 10 ms gradient length while in (b) for water 70 ms and 2 ms respectively. The uncertainties for each parameter in (c) are calculated using a covariance matrix and report on the ambiguity of determined values. The representative images are from three independent experiments. Source data are provided as a Source Data file.
Fig. 3
Fig. 3. Application of LLPS REDIFINE to structured proteins that phase separate upon addition of RNA.
a Nucleocapsid:A6 condensates prepared at 1:6 protein:RNA ratio. Both protein and RNA peaks are visible in NMR spectrum and are analyzed separately by LLPS REDIFINE. Spectra are acquired using 75 ms diffusion time and a gradient length of 10 ms for protein and 3.5 ms for RNA. b LLPS REDIFINE results obtained from both Nucleocapsid and RNA side. c Overlay of condensate properties obtained on condensates formed by Nucleocapsid protein and structured s2m RNA and by another structured protein, PTBP1 in the presence of 3 × UCUCU RNA. The uncertainties for each parameter are calculated using covariance matrix and report on the ambiguity of determined values. Source data are provided as a Source Data file.
Fig. 4
Fig. 4. Structured and disordered proteins exhibit distinct differences in condensate properties.
a A correlation plot of chemical exchange vs. the average radius of the droplets showing that disordered proteins make larger droplets that exchange slower to the dilute phase compared to RNA-binding structured proteins. The latter cover much broader space with much more heterogeneous interphase chemical exchange. Addition of RNA to one of the FUS samples shifted the position in the plot closer to RBPs suggesting that the RNA makes droplets more dynamic (green dot). b A plot of average global exchange rate determined by LLPS REDIFINE with respect to the ratio between protein secondary structure prediction factor SSP and protein net charge Z. An obvious correlation could be deduced. Values presented for FUS NTD, FUS and Nu condensates are the averages with standard deviation of the results from multiple (n > 3) different samples containing these proteins while for DDX4 and PTBP1 are the fitting uncertainties. c A potential explanation for such behavior. RBDs are mostly folded proteins that protect their hydrophobic parts with their fold and can engage in far less polyvalent binding interactions compared to IDPs. Therefore, IDPs have larger affinity to be in the condensed, interaction-reach phase. Source data are provided as a Source Data file.
Fig. 5
Fig. 5. Application of REDIFINE beyond LLPS.
a REDIFINE with dispersed complexes. If biomolecules coexist in solution in multiple exchanging states with different diffusion coefficient (protein/RNA and a complex), then PGSTE curve contains exchange averaged information of all the states present in solution. If exchange happens to be in intermediate regime, REDIFINE approach can be used to calculate Kd and kon rate based on fitted koff and the complex population parameters. b Fitting of REDIFINE data for PTBP1 : 3 × UCUCU. Kd of 500 ± 100 nM is determined. Values of the parameters are the average values of two independent measurements and two independent processing (different integration regions) with the standard error. c Native gel showing the 3 × UCUCU RNA shift upon binding to PTBP1 protein and ensuing fitting of the protein-RNA complex band formation. Kd of 490 ± 20 nM is determined which is in agreement with the REDIFINE. The Kd value is the mean of three independent EMSA experiments with standard error. Source data are provided as a Source Data file.

Similar articles

Cited by

References

    1. Banani, S. F., Lee, H. O., Hyman, A. A. & Rosen, M. K. Biomolecular condensates: organizers of cellular biochemistry. Nat. Rev. Mol. Cell Biol.18, 285–298 (2017). - PMC - PubMed
    1. Alberti, S. Phase separation in biology. Curr. Biol.27, R1097–R1102 (2017). - PubMed
    1. Mehta, S. & Zhang, J. Liquid–liquid phase separation drives cellular function and dysfunction in cancer. Nat. Rev. Cancer22, 239–252 (2022). - PMC - PubMed
    1. Mitrea, D. M. & Kriwacki, R. W. Phase separation in biology; functional organization of a higher order. Cell Commun. Signal.14, 1 (2016). - PMC - PubMed
    1. Brangwynne, C. P., Mitchison, T. J. & Hyman, A. A. Active liquid-like behavior of nucleoli determines their size and shape in Xenopus laevis oocytes. Proc. Natl. Acad. Sci. USA108, 4334–4339 (2011). - PMC - PubMed

LinkOut - more resources