. 2025 May 19;11(1):79.
doi: 10.1038/s41522-025-00715-9.

Gender differences in global antimicrobial resistance

Affiliations

Gender differences in global antimicrobial resistance

Mahkameh Salehi et al. NPJ Biofilms Microbiomes. .

Abstract

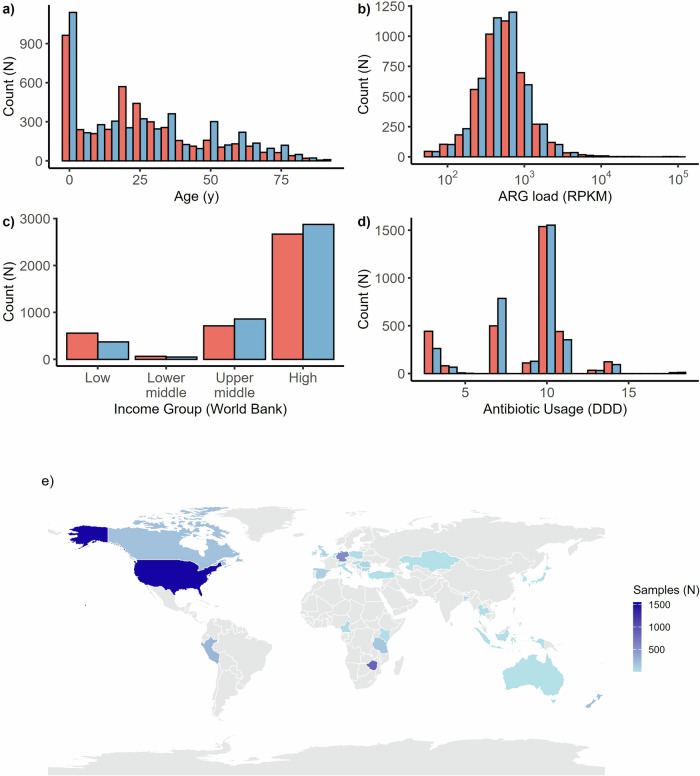
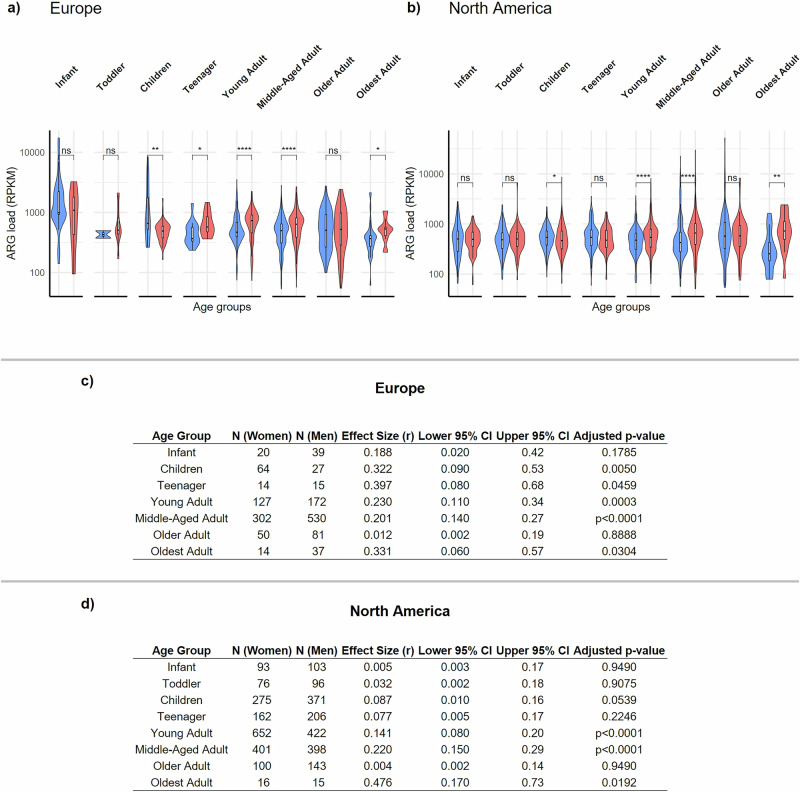
Antimicrobial resistance is one of the leading causes of mortality globally. However, little is known about the distribution of antibiotic resistance genes (ARGs) in human gut metagenomes, collectively referred to as the resistome, across socio-demographic gradients. In particular, limited evidence exists on gender-based differences. We investigated how the resistomes differ between women and men in a global dataset of 14,641 publicly available human gut metagenomes encompassing countries with widely variable economic statuses. We observed a 9% higher total ARG load in women than in men in high-income countries. However, in low- and middle-income countries, the difference between genders was reversed in univariate models, but not significant after adjusting for covariates. Interestingly, the differences in ARG load between genders emerged in adulthood, suggesting resistomes differentiate between genders after childhood. Collectively, our data-driven analyses shed light on global, gendered antibiotic resistance patterns, which may help guide further research and targeted interventions.


Conflict of interest statement

Competing interests: The authors declare no competing interests.

Figures

Fig. 1
Fig. 1. Overview of demographic, economic, and antibiotic resistance data (N = 14,641).
a Age distribution (men: blue, women: red). b Antibiotic resistance gene (ARG) load distribution (log RPKM). c World Bank income groups (low income, lower-middle income, upper-middle income (low- and middle-income countries, LMICs), and high income (high-income countries, HICs)). d Antibiotic use (daily defined doses, DDD per 1000 inhabitants). e Geographic distribution of the samples on a world map.
Fig. 2
Fig. 2. Population variation in resistome composition by age and income groups, and gender.
a The top panel shows the five most abundant antibiotic resistance gene (ARG) classes across gender and income groups (HIC: n = 5544; LMIC: n = 2611). b Women and men have a similar resistome composition across the different age and income groups (men: blue, women: red). Gender explains only a relatively small, albeit significant, fraction of the overall variation in resistome composition (0.28%; p < 0.001). Principal Coordinates Analysis ordination (PCoA) illustrates the dissimilarity between samples in terms of their overall resistome composition, summarized along the two principal axes (PC1-2; N = 8590 samples with age and gender information, see Supplementary Table 11 for sample sizes; Bray-Curtis dissimilarity index) that explain 14.95% and 10.34% of the overall population-level variation, respectively. The ordination includes all samples, with their distribution along the axes displayed separately for each age-income subgroup. HIC high-income countries, LMIC low- and middle-income countries. For definitions of the age categories, see “Methods”.
Fig. 3
Fig. 3. Antibiotic resistance gene (ARG) load and diversity by income and gender.
a ARG load (RPKM) b ARG diversity (Shannon index). The income groups include low- and middle-income countries (LMIC) and high-income countries (HIC) (men: blue, women: red). The boxes indicate medians and interquartile range (IQR) whiskers. The violin plots show the overall population distribution. Statistical significance for group-wise comparisons was determined using the Wilcoxon test. c Summary of gender differences in ARG load, and ARG diversity within each income group, including sample sizes, effect sizes (r) with 95% confidence intervals, and adjusted p-values. d Summary table reports the Wilcoxon test results for ARG load and diversity by income group, including effect sizes (r) with 95% confidence intervals and adjusted p-values.
Fig. 4
Fig. 4. Age, gender, and Antibiotic resistance gene (ARG) load in high-income countries.
Gender-specific variation in ARG load from young to old age in high-income countries in a Europe and b North America. Our data shows that both regions were represented across the entire lifespan. Statistical comparisons of ARG load between genders across age groups (men: blue, women: red), with effect sizes, lower and upper confidence intervals and adjusted p-values, for c Europe and d North America. The boxes display the median values and interquartile range (IQR) whiskers. For age category definitions, see Methods. Statistical significance is denoted as follows: ns: Not significant, p > 0.05. *: p ≤ 0.05, **: p ≤ 0.01, ***: p ≤ 0.001,****: p ≤ 0.0001. Summary statistics for gender comparisons in c Europe and d North America, including sample sizes, effect sizes (r), and their 95% confidence intervals. Statistical analyses were not performed for age groups with insufficient sample sizes (european Toddler group with only 2 male participants). P-values were adjusted for multiple comparisons using the Benjamini-Hochberg method.
Fig. 5
Fig. 5. Drivers of antibiotic resistance gene (ARG) load and diversity in high-income countries (HIC) and low- and middle-income countries (LMIC).
Probabilistic 95% credible intervals (CI) for the effect size of socio-economic variables on ARG load (blue, modeled using log-normal regression), and Shannon diversity (orange, standard linear regression; see Supplementary Tables 2 and 3). The baseline categories are Europe (in HIC) and Asia (in LMIC), and middle-aged adults for age. The effect sizes were mapped to percentages for easier interpretation, using the transform 100×(exp(x) - 1).

References

    1. Antimicrobial Resistance Collaborators Global burden of bacterial antimicrobial resistance in 2019: a systematic analysis. Lancet Lond. Engl.399, 629–655 (2022). - PMC - PubMed
    1. Naghavi, M. et al. Global burden of bacterial antimicrobial resistance 1990–2021: a systematic analysis with forecasts to 2050. Lancet404, 1199–1226 (2024). - PMC - PubMed
    1. Joos, R. et al. Examining the healthy human microbiome concept. Nat. Rev. Microbiol.23, 192–205 (2025). - PubMed
    1. Organization, W. H. Tackling antimicrobial resistance (AMR) together: working paper 5.0: enhancing the focus on gender and equity. (2018).
    1. Collignon, P., Beggs, J. J., Walsh, T. R., Gandra, S. & Laxminarayan, R. Anthropological and socioeconomic factors contributing to global antimicrobial resistance: a univariate and multivariable analysis. Lancet Planet Health2, e398–e405 (2018). - PubMed

Substances

LinkOut - more resources