

Feasibility of machine learning-based modeling and prediction to assess osteosarcoma outcomes
- PMID: 40389469
- PMCID: PMC12089500
- DOI: 10.1038/s41598-025-00179-z
Feasibility of machine learning-based modeling and prediction to assess osteosarcoma outcomes
Abstract
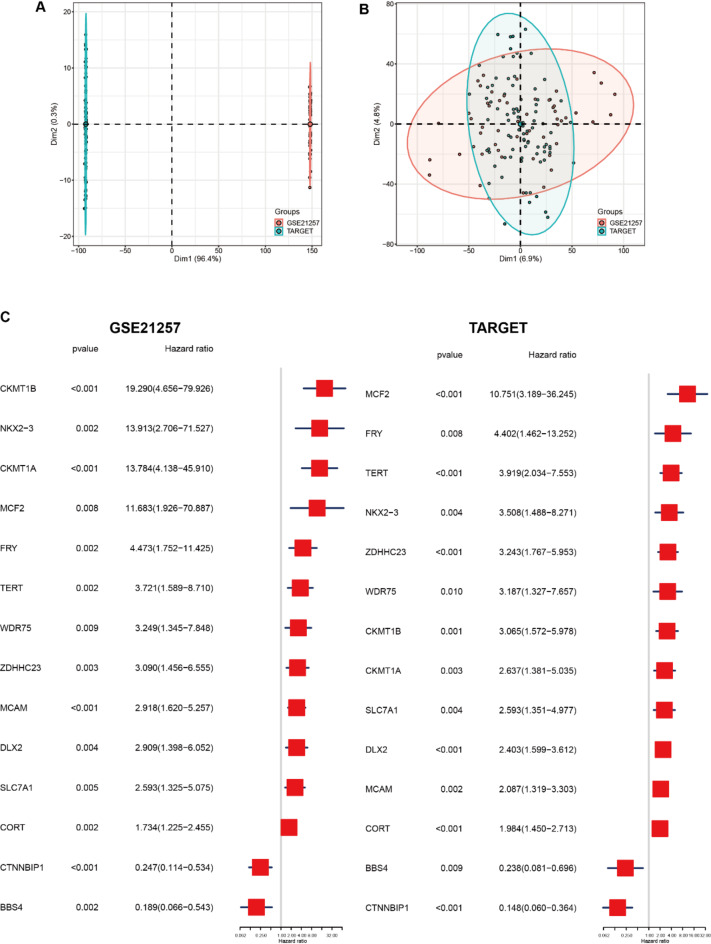
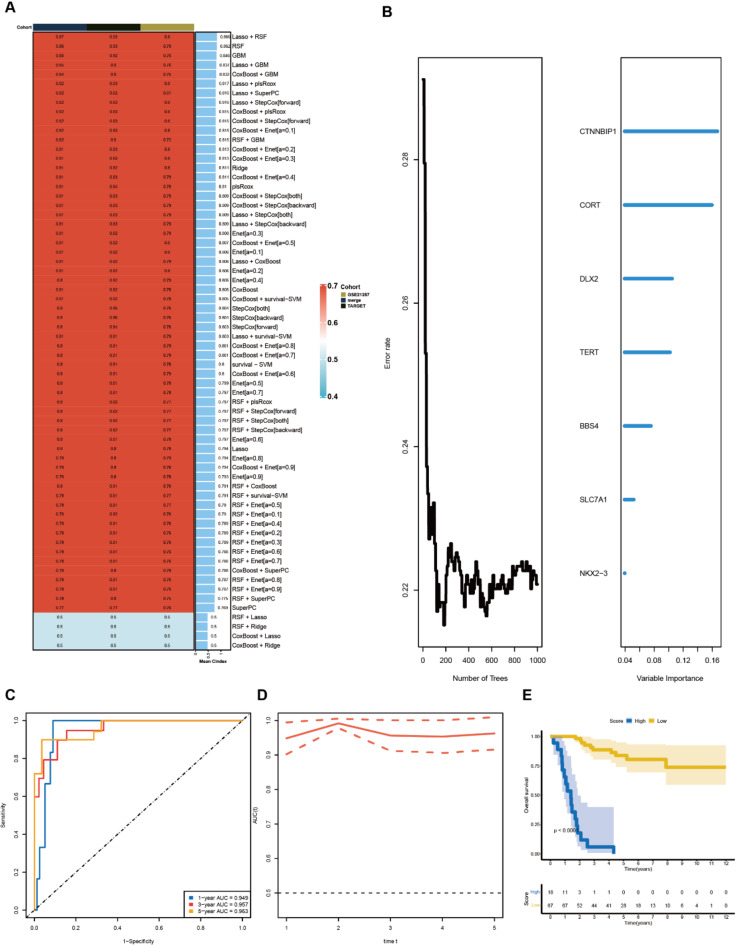
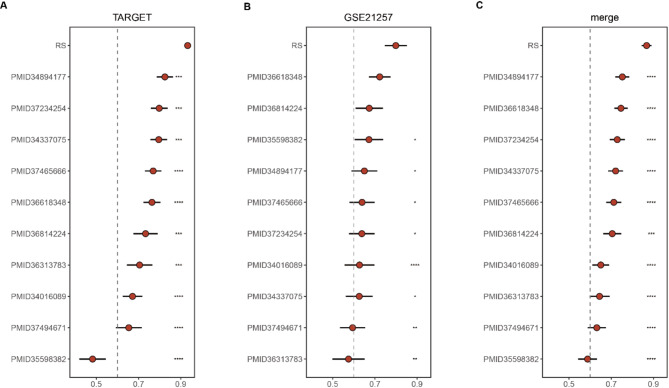
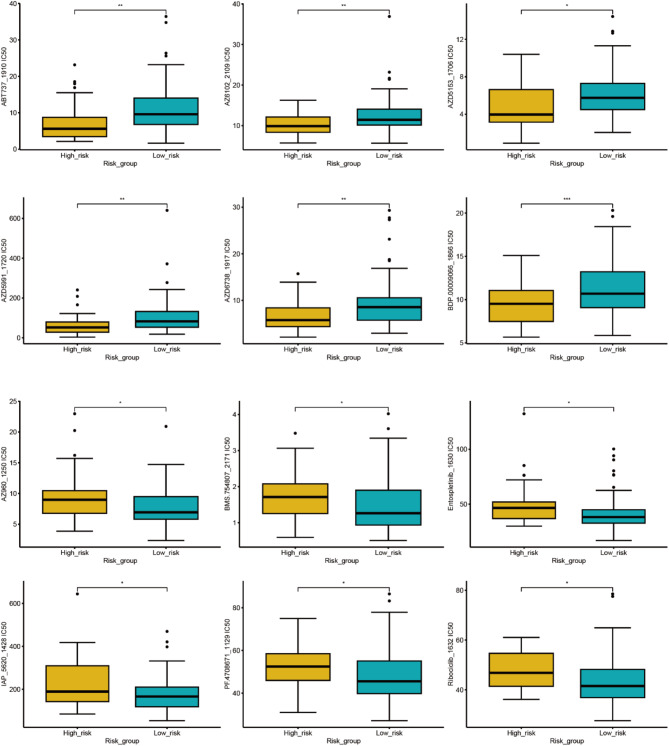
Osteosarcoma, an aggressive bone malignancy predominantly affecting children and adolescents, is characterized by a poor prognosis and high mortality rates. The development of reliable prognostic tools is critical for advancing personalized treatment strategies. However, identifying robust gene signatures to predict osteosarcoma outcomes remains a significant challenge. In this study, we analyzed gene expression data from 138 osteosarcoma samples across two multicenter cohorts and identified 14 consensus prognosis-associated genes via univariate Cox regression analysis. Using 66 combinations of 10 machine learning (ML) algorithms, we developed a machine learning-derived prognostic signature (MLDPS) optimized by the average C-index across TARGET, GSE21257, and merged cohorts. The MLDPS effectively stratified osteosarcoma patients into high- and low-risk score groups, achieving strong predictive performance for 1-, 3-, and 5-year overall survival (AUC range: 0.852 - 0.963). The MLDPS, comprising seven genes (CTNNBIP1, CORT, DLX2, TERT, BBS4, SLC7A1, NKX2-3), exhibited superior predictive accuracy compared to 10 established gene signatures. The findings of the MLDPS carry significant clinical implications for osteosarcoma treatment. Patients with a high-risk score demonstrated worse prognosis, increased metastasis risk, reduced immune infiltrations, and greater sensitivity to immunotherapy. Conversely, low-risk patients exhibited prolonged survival and distinct drug sensitivities. These findings underscore the potential of MLDPS to guide risk stratification, inform personalized therapeutic strategies, and improve clinical management in osteosarcoma.
Keywords: Machine learning; Osteosarcoma; Prognosis; Risk score; Tumor immunotherapy.
© 2025. The Author(s).
Conflict of interest statement
Declarations. Competing interests: The authors declare no competing interests.
Figures


Similar articles
-
Machine learning survival prediction using tumor lipid metabolism genes for osteosarcoma.Sci Rep. 2024 Jun 5;14(1):12934. doi: 10.1038/s41598-024-63736-y. Sci Rep. 2024. PMID: 38839983 Free PMC article.
-
Importance of CD8 Tex cell-associated gene signatures in the prognosis and immunology of osteosarcoma.Sci Rep. 2024 Apr 29;14(1):9769. doi: 10.1038/s41598-024-60539-z. Sci Rep. 2024. PMID: 38684858 Free PMC article.
-
A novel prognostic signature related to programmed cell death in osteosarcoma.Front Immunol. 2024 Jul 1;15:1427661. doi: 10.3389/fimmu.2024.1427661. eCollection 2024. Front Immunol. 2024. PMID: 39015570 Free PMC article.
-
Develop a Novel Signature to Predict the Survival and Affect the Immune Microenvironment of Osteosarcoma Patients: Anoikis-Related Genes.J Immunol Res. 2024 Mar 27;2024:6595252. doi: 10.1155/2024/6595252. eCollection 2024. J Immunol Res. 2024. PMID: 39431237 Free PMC article.
-
The prognostic value of elevated ezrin in patients with osteosarcoma.Tumour Biol. 2014 Feb;35(2):1263-6. doi: 10.1007/s13277-013-1168-2. Epub 2013 Sep 7. Tumour Biol. 2014. PMID: 24014052
References
-
- Bielack, S. S. et al. Prognostic factors in high-grade osteosarcoma of the extremities or trunk: an analysis of 1,702 patients treated on neoadjuvant cooperative osteosarcoma study group protocols. J. Clin. Oncol.20 (3), 776–790 (2002). - PubMed
-
- Siegel, R. L., Miller, K. D. & Jemal, A. Cancer statistics, 2020. CA Cancer J. Clin.70 (1), 7–30 (2020). - PubMed
-
- Rainusso, N., Wang, L. L. & Yustein, J. T. The adolescent and young adult with cancer: state of the Art -- bone tumors. Curr. Oncol. Rep.15 (4), 296–307 (2013). - PubMed
MeSH terms
Substances
Grants and funding
- No. SZYYB20231890/Jiangxi Traditional Chinese Medicine Science and Technology Program
- No. 2022A136/Jiangxi Traditional Chinese Medicine Science and Technology Program
- No. 2023NS326774/"Technology+Medical" - Targeted Project of the First Affiliated Hospital of Gannan Medical University
- No. 202311903/Science and Technology Plan of Health Commission of Jiangxi Province
- No. 202310736/Science and Technology Plan of Health Commission of Jiangxi Province
- GZWJW202402043/the City-Level Scientific Research Program of the Ganzhou Health Commission
- No. 82260422/National Natural Science Foundation of China
- No. 202310050/the Science and Technology Program of Jiangxi Provincial Health Commission, China
- No. 2023LNS36838/the Science and Technology Program of Ganzhou, China
- No. 20242BAB26154/the Key Project of Jiangxi Provincial Natural Science Foundation
- 2023A0217/the General Program of the Jiangxi Administration of Traditional Chinese Medicine
LinkOut - more resources
Full Text Sources
Medical
