. 2025 May 19;16(1):4656.
doi: 10.1038/s41467-025-59930-9.

Transcriptional and epigenetic rewiring by the NUP98::KDM5A fusion oncoprotein directly activates CDK12

Affiliations

Transcriptional and epigenetic rewiring by the NUP98::KDM5A fusion oncoprotein directly activates CDK12

Selina Troester et al. Nat Commun. .

Abstract

Nucleoporin 98 (NUP98) fusion oncoproteins are strong drivers of pediatric acute myeloid leukemia (AML) with poor prognosis. Here we show that NUP98 fusion-expressing AML harbors an epigenetic signature that is characterized by increased accessibility of hematopoietic stem cell genes and enrichment of activating histone marks. We employ an AML model for ligand-induced degradation of the NUP98::KDM5A fusion oncoprotein to identify epigenetic programs and transcriptional targets that are directly regulated by NUP98::KDM5A through CUT&Tag and nascent RNA-seq. Orthogonal genome-wide CRISPR/Cas9 screening identifies 12 direct NUP98::KDM5A target genes, which are essential for AML cell growth. Among these, we validate cyclin-dependent kinase 12 (CDK12) as a druggable vulnerability in NUP98::KDM5A-expressing AML. In line with its role in the transcription of DNA damage repair genes, small-molecule-mediated CDK12 inactivation causes increased DNA damage, leading to AML cell death. Altogether, we show that NUP98::KDM5A directly regulates a core set of essential target genes and reveal CDK12 as an actionable vulnerability in AML with oncogenic NUP98 fusions.


Conflict of interest statement

Competing interests: J.Z. is a founder, shareholder, and scientific advisor of Quantro Therapeutics GmbH. J.Z. and the Zuber laboratory receive research support and funding from Boehringer Ingelheim. P.V. received consultancy honoraria from Pfizer, AOP Orphan, Delbert, Novartis, and Blueprint. The other authors declare no conflict of interest.

Figures

Fig. 1
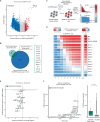
Fig. 1. Epigenomic analysis of AML patient data reveals NUP98 fusion-specific patterns.
A Principal component (PC) analysis of ATAC-seq data from pediatric and adult AML patients and samples from healthy blood cells, including HSCs, progenitor cells, and mature myeloid cells. B Minimum spanning tree of distances between ATAC-seq signals of NUP98 fusion-expressing and other pediatric AML samples and samples of healthy blood cells. C ATAC-seq profile plots showing 1921 more accessible regions in NUP98 fusion-expressing AML vs. GMPs. D Heatmap and profile plots of ATAC-seq, H3K27ac, and H3K4me3 CUT&Tag data showing 1921 genomic regions that are more accessible in NUP98 fusion-expressing AML vs. GMPs. E Heatmap showing ATAC-seq unsupervised clustering of 893 differentially accessible regions in NUP98 fusion-expressing AML patient samples compared to NUP98 wild-type pediatric AML patient samples (HSC hematopoietic stem cell, MPP multipotent progenitor, CMP common myeloid progenitor, MEP Megakaryocyte-erythrocyte progenitor, GMP granulocyte-monocyte progenitor). Source data are provided as a Source Data file.
Fig. 2
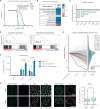
Fig. 2. Induced NUP98::KDM5A degradation causes terminal differentiation of AML blasts.
A Schematic overview of the constructs used for the generation of the dTAG-NUP98::KDM5A cell line. B Representative plots of flow cytometric analysis of intracellular NUP98::KDM5A protein levels upon treatment with dTAG13 or DMSO. (Blue, dTAG-NUP98::KDM5A cell line; grey, untagged NUP98::KDM5A control cell line (Table 1)). C Intracellular flow cytometric analysis of NUP98::KDM5A protein levels after treatment of dTAG-NUP98::KDM5A cells with indicated concentrations of dTAG13 for 18 h (n = 3 biological replicates, mean ± SD, two-sided, unpaired t-test), D and after treatment with 35 nM dTAG13 for indicated time points (n = 3 biological replicates, mean ± SD, two-sided, unpaired t-test). E Flow cytometric analysis of cell cycle distribution of dTAG-NUP98::KDM5A cells after treatment with dTAG13 (35 nM) and DMSO for 3 days (n = 3 biological replicates, mean ± SD, two-sided, unpaired t-test), including representative histogram plots (right). F Flow cytometric analysis of apoptosis after treatment of dTAG-NUP98::KDM5A cells with dTAG13 (35 nM) and DMSO for 3, 7, and 10 days (n = 3 biological replicates, mean ± SD, two-sided, unpaired t-test). G Representative cytospin images showing the morphology of dTAG-NUP98::KDM5A cells after treatment with dTAG13 (35 nM) or DMSO for 3 and 5 days. Scale bar = 20 μm. Representative images of n = 2 samples. H Flow cytometric analysis of surface expression of c-Kit, (I) Gr-1 and (J) Mac-1 of dTAG-NUP98::KDM5A cells after treatment with dTAG13 (35 nM) and DMSO for 7 days (n = 3 biological replicates, mean ± SD, two-sided, unpaired t-test), including representative histogram plots (bottom). Parts of the figure were created in BioRender. Grebien, F. (2025) https://BioRender.com/d32l249. Source data are provided as a Source Data file.
Fig. 3
Fig. 3. NUP98::KDM5A actively maintains H3K27ac marks on target genes.
A H3K27ac ChIP-qPCR in dTAG-NUP98::KDM5A cells for Hoxa9 and Meis1 after treatment with dTAG13 for indicated time points compared to DMSO and a negative control genomic region (n = 2 technical replicates, mean ± SD). B Heatmaps and profile-plots of H3K27ac CUT&Tag data of dTAG13 (35 nM) and DMSO-treated dTAG-NUP98::KDM5A cells showing 161 significantly downregulated sites compared to 1000 random sites with no significant changes (n = 3, FDR < 0.05). C Representative tracks of H3K27ac CUT&Tag data (dTAG13 and DMSO). D Time-series plots showing cluster analysis of up and downregulated transcripts from RNA-seq data of dTAG-NUP98::KDM5A cells treated with dTAG13 (35 nM) for 8 h or 24 h compared to DMSO (0 h) (n = 4 biological replicates per time point). The upper and lower ends of the bars represent the minimum and maximum expression values for the respective group. The lines represent the mean expression profile across replicates for each group. E Heatmap of RNA-seq data in dTAG-NUP98::KDM5A cells after 8 h and 24 h of dTAG13 treatment compared to DMSO, showing 249 significantly differentially expressed genes at 24 h dTAG13 treatment (n = 4, log2FC > 1 or < −1, padj < 0.05, statistical analysis and p-value calculations were performed using DESeq2). F Scatter plot showing log2FC values in gene expression (QUANT-seq) and H3K27ac levels (CUT&Tag) upon dTAG13 treatment (35 nM, 8 h) compared to DMSO. G Hockey stick plot of H3K27ac CUT&Tag data in dTAG-NUP98::KDM5A cells (left). Genes are ranked according to normalized read signal, including a quantitative box plot representation (right, target genes n = 38, other genes n = 24,415, two-sided Wilcoxon rank sum test with continuity correction, p-value < 2.2e-16). Data are presented as boxplots where the center line represents the median, the bounds of the box indicate the first (25th percentile) and third (75th percentile) quartiles and the whiskers extend to 1.5 × inter-quartile range from the hinges. Data points beyond this range are shown as individual dots and represent outliers. Source data are provided as a Source Data file.
Fig. 4
Fig. 4. Identification of direct transcriptional target genes of NUP98::KDM5A.
A Schematic representation of the experimental setup for nascent RNA-seq (SLAM-seq) (4SU, 4-thiouridine). B Volcano plot of SLAM-seq data in dTAG-NUP98::KDM5A cells showing log2FC and –log10(p-value) values after dTAG13 (35 nM, 2 h) vs. DMSO treatment (statistical analysis and p-value calculations were performed using DESeq2). C Heatmap showing gene expression changes of the 45 direct target genes 2 h (SLAM-seq), 8 h and 24 h (RNA-seq) after dTAG13 treatment compared to DMSO treatment. D Hockey stick plot of ChIP-seq data of NUP98::KDM5A chromatin binding. All genes were ranked according to their normalized read counts and 45 direct targets are highlighted in color. E HA-NUP98::KDM5A ChIP-seq data showing normalized read signal of the 45 direct target genes compared to all other genes. F H3K27ac and H3K4me3 CUT&Tag data from dTAG-NUP98::KDM5A cells showing normalized read signal of the 45 direct target genes compared to all other genes. G H3K27ac CUT&Tag data from dTAG-NUP98::KDM5A cells showing normalized read signal for the 45 direct target genes after 8 h dTAG13 treatment compared to DMSO. H RNA-seq data showing gene expression levels of the 45 direct targets compared to all other genes in murine NUP98::KDM5A AML cells compared to control cells expressing a NUP98 N-terminal fragment (all genes n = 18,899, direct targets n = 45, two-sided Mann–Whitney U test, p-value < 0.0001). Horizontal bars represent the mean, error bars +/− SD. I Expression of 42 human homologs of direct NUP98::KDM5A target genes in pediatric AML patients from the St. Jude Cloud data repository. Data are presented as boxplots where the center line represents the median, the bounds of the box indicate the first (25th percentile) and third (75th percentile) quartiles and the whiskers extend to 1.5 × inter-quartile range from the hinges. Data points beyond this range are shown as individual dots and represent outliers. Parts of the figure were created in BioRender. Grebien, F. (2025) https://BioRender.com/w52j392. Source data are provided as a Source Data file.
Fig. 5
Fig. 5. Genome-wide CRISPR/Cas9 screening identifies 12 essential direct target genes of NUP98::KDM5A.
A Volcano plot of genome-wide CRISPR/Cas9 screen data from NUP98::KDM5A-expressing cells showing the log2FC and –log10(p-value) values of mean sgRNA abundance at the screen endpoint vs. the sgRNA pool (log2FC > 2.25 and <−2.25, statistical analysis and p-value calculations were performed using MAGeCK). B Intersection of SLAM-seq and genome-wide CRISPR screen data. C Scheme of competition-based proliferation assay (Dox doxycycline, AUC area under curve). D Heatmap representation of proliferation assay data after shRNA-mediated target knockdown (2× shRNAs/gene) showing mean percent of iRFP670-positive cells over 21 days, with positive controls shown at the top and the negative control shown at the bottom (n = 2, biological replicates). E Scatter plot of SLAM-seq and H3K27ac CUT&Tag data showing log2FC values upon dTAG13 (35 nM) treatment compared to DMSO and essential direct target genes are highlighted in color. F Hockey stick plot of H3K27ac CUT&Tag data from primary material of a NUP98::KDM5A PDX model (left). Genes are ranked according to normalized read signal and essential direct target genes are highlighted in color including a quantitative box plot representation (right, essential direct targets n = 12, all genes n = 26,917, two-sided Wilcoxon rank sum test with continuity correction, p-value = 0.0001632). Data are presented as boxplots where the center line represents the median, the bounds of the box indicate the first (25th percentile) and third (75th percentile) quartiles and the whiskers extend to 1.5 × inter-quartile range from the hinges. Data points beyond this range are shown as individual dots and represent outliers. Parts of the figure were created in BioRender. Grebien, F. (2025) https://BioRender.com/n44f632. Source data are provided as a Source Data file.
Fig. 6
Fig. 6. CDK12 is a direct essential target gene of NUP98::KDM5A.
A Gene expression data for CDK12 of 2487 pediatric cancer patients, AML patients (n = 320), AML with NUP98 rearrangements (n = 11) and AML with NUP98::KDM5A (n = 4) from the St. Jude Cloud data repository (two-sided, unpaired t-test). Data are presented as boxplots, where the center line represents the median, and the bounds of the box indicate the first (25th percentile) and third (75th percentile) quartiles. The whiskers extend down to the 10th percentile and up to the 90th percentile. Data points beyond this range are shown as individual dots and represent outliers. B Representative IGV tracks of H3K27ac CUT&Tag data and SLAM-seq data from dTAG-NUP98::KDM5A cells, and HA-NUP98::KDM5A ChIP-seq data showing the murine Cdk12 locus (top). H3K27ac and H3K4me3 CUT&Tag data in NUP98::KDM5A PDX cells showing the human CDK12 locus (bottom) (PDX patient-derived xenograft). C Competition-based proliferation assay upon doxycycline-inducible shRNA-mediated knockdown of Cdk12 in a murine NUP98::KDM5A (rtTA3) AML cell line, showing percentage of iRFP670-positive cells over 24 days (n = 3 biological replicates). The upper and lower ends of the bars represent the minimum and maximum percent of iRFP670+ cells (normalized to shRen and day 3) for the respective point. D Competition-based proliferation assay upon doxycycline-inducible shRNA-mediated knockdown of Cdk12 in dTAG-NUP98::KDM5A cells stably expressing exogenous CDK12 wild type and CDK12D873N, showing percentage of iRFP670-positive cells on days 2, 7, and 11 on doxycycline (n = 3 biological replicates, mean ± SD, two-sided, unpaired t-test). E Schematic representation of the experimental setup for in vivo shRNA-induced knockdown of Cdk12. F Kaplan–Meier curve of sublethally irradiated recipient mice transplanted with doxycycline-inducible shCdk12-expressing NUP98::KDM5A (rtTA3) AML cells (n = 5 biological replicates, Log-rank (Mantel-Cox) test). G Flow cytometric analysis of CD45.2/iRFP670+ AML blasts from bone marrow of moribund mice showing the percentage of c-Kit surface marker expression (n = 5, mean ± SD, two-sided, unpaired t-test). Source data are provided as a Source Data file.
Fig. 7
Fig. 7. CDK12-controlled DNA repair is a vulnerability in NUP98::KDM5A-driven leukemia.
A Cell viability assay of primary human NUP98-rearranged AML cells, healthy donor BM MNC and CD34+ progenitors treated with indicated concentrations of THZ531 for 3 days (n = 3 technical replicates). B GI50 values from cell viability assays of murine AML cells treated with THZ531 for 3 days. C RT-qPCR analysis of dTAG-NUP98::KDM5A cells treated with THZ531 (2 µM, 24 h) showing log2FC values (n = 3 technical replicates). D Gene set enrichment analysis of RNA-seq data from a doxycycline-controlled NUP98::KDM5A cell line (Tet-Off) after 5 days of doxycycline-induced NUP98::KDM5A downregulation compared to DMSO. E Time series plot of Tet-Off RNA-seq data showing gene expression levels of DNA double strand break repair genes at day 3 and day 5 after NUP98::KDM5A downregulation normalized to NUP98::KDM5A-expressing cells, highlighting selected genes (left), with a density plot of normalized expression of all genes (right). F Proliferation assay of dTAG-NUP98::KDM5A cells stably expressing exogenous CDK12 wild type and CDK12D873N, showing the cumulative cell number on days 2, 7, and 11 of dTAG13 treatment (initial dTAG13 concentration, 35 nM, maintained at 3,5 nM after day 2) (n = 3 biological replicates, mean ± SD, two-sided, unpaired t-test). G Representative images of γH2A.X immunofluorescence staining of dTAG-GFP-NUP98::KDM5A cells treated with THZ531 (2 µM, 24 h) (left) and quantification of γH2A.x signal (right). Midline represents the median, bounds of the box represent the inter-quartile range (Q1 to Q3), and whiskers represent minimum and maximum values (DMSO: n = 125 nuclei (technical replicates), THZ531: n = 131 nuclei (technical replicates) two-sided, unpaired t-test, right). Representative images of n = 8 samples. Source data are provided as a Source Data file.

Similar articles

References

    1. Bolouri, H. et al. The molecular landscape of pediatric acute myeloid leukemia reveals recurrent structural alterations and age-specific mutational interactions. Nat. Med.24, 103–112 (2018). - PMC - PubMed
    1. Michmerhuizen, N. L., Klco, J. M. & Mullighan, C. G. Mechanistic insights and potential therapeutic approaches for NUP98-rearranged hematologic malignancies. Blood136, 2275–2289 (2020). - PMC - PubMed
    1. Gough, S. M., Slape, C. I. & Aplan, P. D. NUP98 gene fusions and hematopoietic malignancies: common themes and new biologic insights. Blood118, 6247–6257 (2011). - PMC - PubMed
    1. Rasouli, M. et al. NUP98 oncofusions in myeloid malignancies: an update on molecular mechanisms and therapeutic opportunities. HemaSphere8, e70013 (2024). - PMC - PubMed
    1. Van Zutven, L. J. C. M. et al. Identification of NUP98 abnormalities in acute leukemia: JARIDIA (12p13) as a new partner gene. Genes Chromosom. Cancer45, 437–446 (2006). - PubMed

MeSH terms

LinkOut - more resources