

Abrogating the adenine methylation ability of Lacticaseibacillus paracasei improves its freeze-drying and storage resistance
- PMID: 40389488
- PMCID: PMC12089573
- DOI: 10.1038/s41538-025-00409-8
Abrogating the adenine methylation ability of Lacticaseibacillus paracasei improves its freeze-drying and storage resistance
Abstract
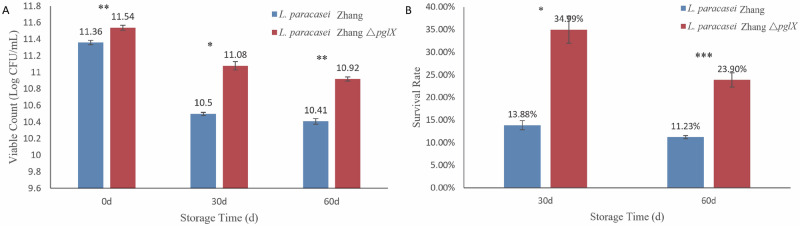
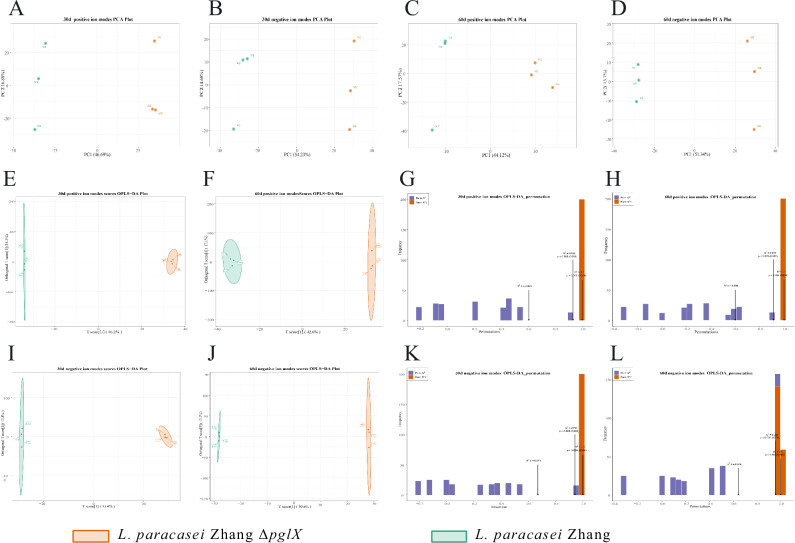
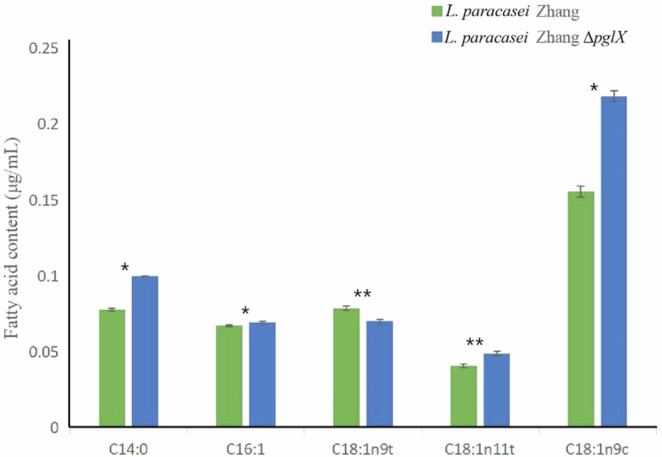
Freeze-drying is a widely adopted method for the long-term storage of starter cultures in the food industry but can cause cell instability and a decline in post-storage viability. We used an unmethylated Lacticaseibacillus paracasei Zhang mutant lacking adenine-specific DNA-methyltransferase. This mutant was subjected to freeze-drying and stored at 30 °C for two distinct durations (30 and 60 days), Our analysis revealed the unmethylated mutant outperformed the wild-type in cell viability and survival following freeze-drying and post-freeze-drying storage. And significant metabolic pathway differences between the stored mutant and wild-type bacteria. These differences were evident in the phosphotransferase system, carbohydrate, and amino acid metabolism, and fatty acid biosynthesis, and were consistent across transcriptomic, proteomic, and metabolomic analyses. This is achieved by modulating key metabolic pathways within the bacteria. This study contributes to the limited literature on the role of bacterial adenine methylation in industrial strain application and starter culture storage.
© 2025. The Author(s).
Conflict of interest statement
Competing interests: The authors declare no competing interests.
Figures


Similar articles
-
Characterization of Key Lipid Components in the Cell Membrane of Freeze-Drying Resistant Lacticaseibacillus paracasei Strains Using Nontargeted Lipidomics.J Agric Food Chem. 2025 Jan 29;73(4):2696-2711. doi: 10.1021/acs.jafc.4c11237. Epub 2025 Jan 9. J Agric Food Chem. 2025. PMID: 39787005
-
Impact of different cryoprotectants on the survival of freeze-dried Lactobacillus rhamnosus and Lactobacillus casei/paracasei during long-term storage.Benef Microbes. 2015;6(3):381-6. doi: 10.3920/BM2014.0038. Benef Microbes. 2015. PMID: 25380798
-
Improving the drying of Propionibacterium freudenreichii starter cultures.Appl Microbiol Biotechnol. 2021 May;105(9):3485-3494. doi: 10.1007/s00253-021-11273-3. Epub 2021 Apr 22. Appl Microbiol Biotechnol. 2021. PMID: 33885925 Review.
-
Protective effect of sugars on storage stability of microwave freeze-dried and freeze-dried Lactobacillus paracasei F19.J Appl Microbiol. 2018 Oct;125(4):1128-1136. doi: 10.1111/jam.13935. Epub 2018 Jul 17. J Appl Microbiol. 2018. PMID: 29851297
-
Alternative drying processes for the industrial preservation of lactic acid starter cultures.Biotechnol Prog. 2007 Mar-Apr;23(2):302-15. doi: 10.1021/bp060268f. Epub 2007 Feb 17. Biotechnol Prog. 2007. PMID: 17305363 Review.
References
-
- Leroy, F. & De Vuyst, L. Lactic acid bacteria as functional starter cultures for the food fermentation industry. Trends Food Sci. Technol.15, 67–78, 10.1016/j.tifs.2003.09.004 (2004).
-
- Bensch, G. et al. Flow cytometric viability assessment of lactic acid bacteria starter cultures produced by fluidized bed drying. Appl. Microbiol. Biotechnol.98, 4897–4909, 10.1007/s00253-014-5592-z (2014). - PubMed
-
- Broeckx, G., Vandenheuvel, D., Claes, I. J., Lebeer, S. & Kiekens, F. Drying techniques of probiotic bacteria as an important step towards the development of novel pharmabiotics. Int J Pharm.505, 303–318, 10.1016/j.ijpharm.2016.04.002 (2016). - PubMed
-
- Begum, R. et al. Isolation and characterization of lactic acid bacteria from indigenous dairy product and preparation of starter culture by freeze-drying. BRC3, 302–308, 10.1016/j.smallrumres.2021 (2017).
-
- Wang, Z. et al. A comprehensive review on stability of therapeutic proteins treated by freeze-drying: induced stresses and stabilization mechanisms involved in processing. Dry. Technol.40, 3373–3388, 10.1080/07373937.2022.2048847 (2022).
LinkOut - more resources
Full Text Sources
