. 2025 May 19;11(1):80.
doi: 10.1038/s41522-025-00694-x.

Dental biofilms contain DNase I-resistant Z-DNA and G-quadruplexes but alternative DNase overcomes this resistance

Affiliations

Dental biofilms contain DNase I-resistant Z-DNA and G-quadruplexes but alternative DNase overcomes this resistance

Dominique C S Evans et al. NPJ Biofilms Microbiomes. .

Abstract

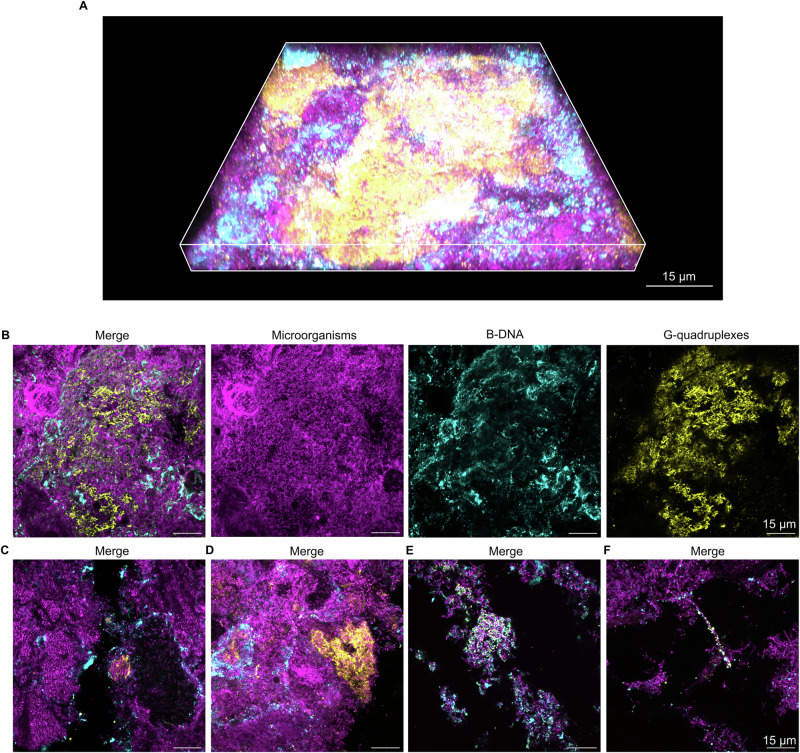
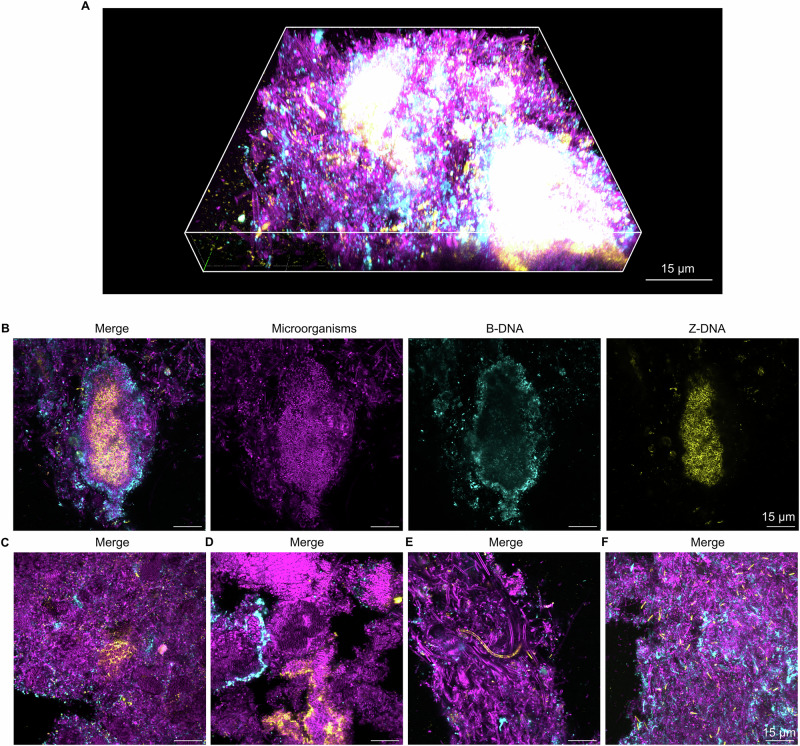
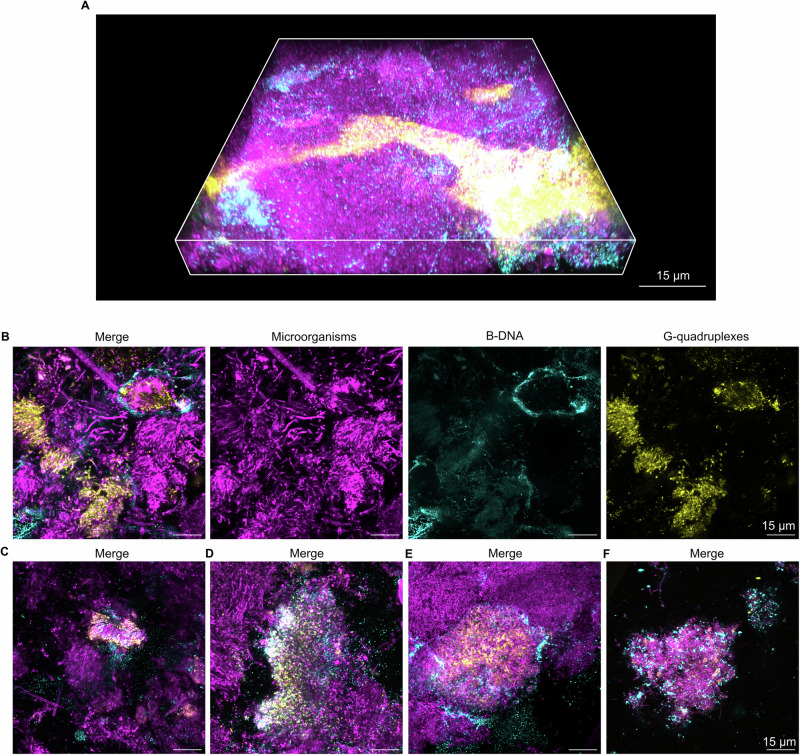
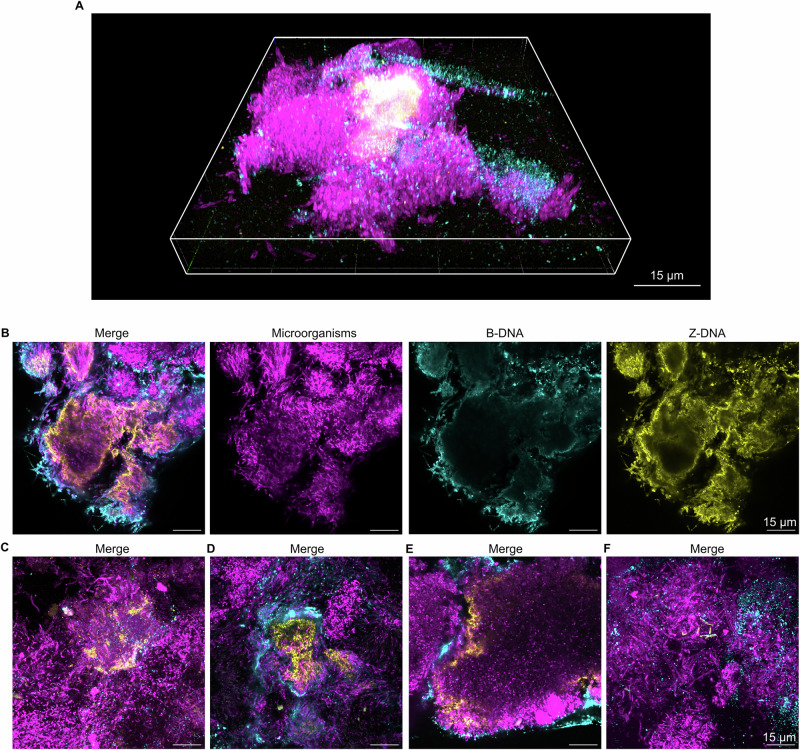
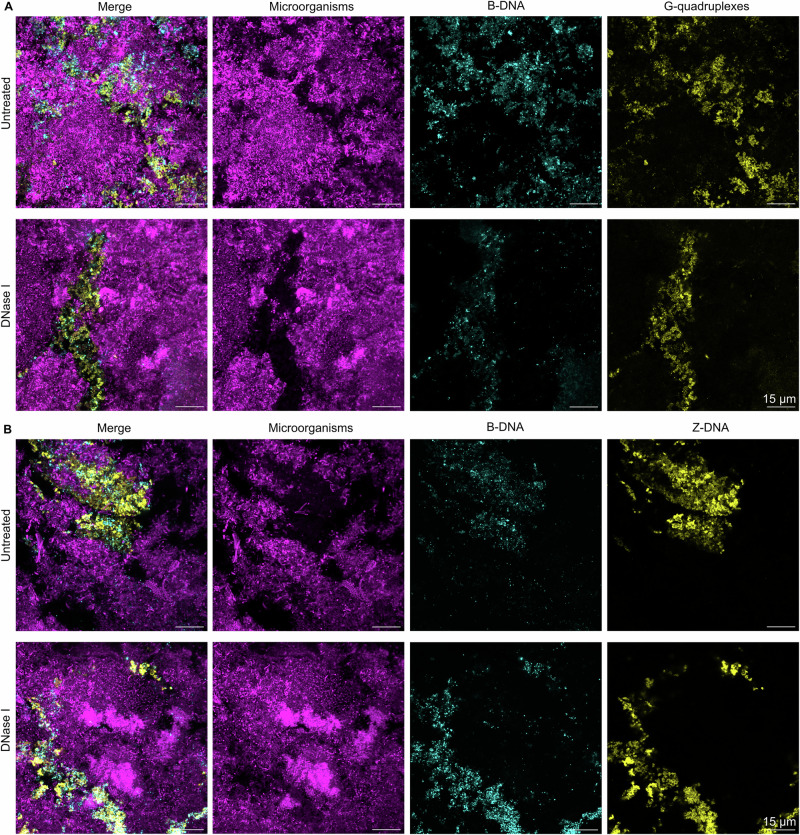
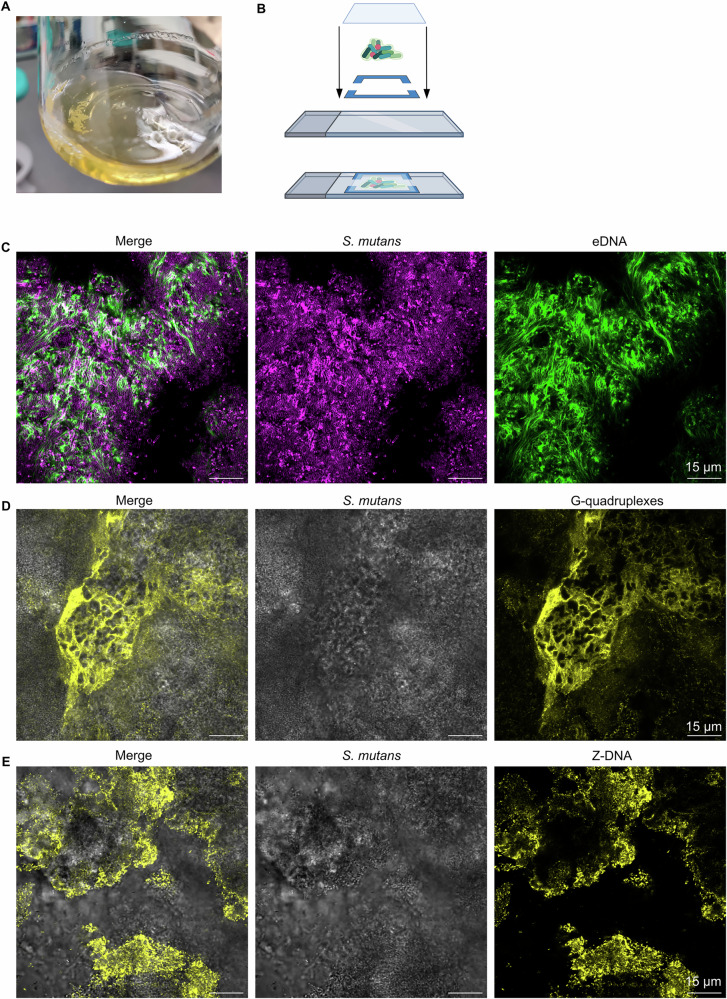
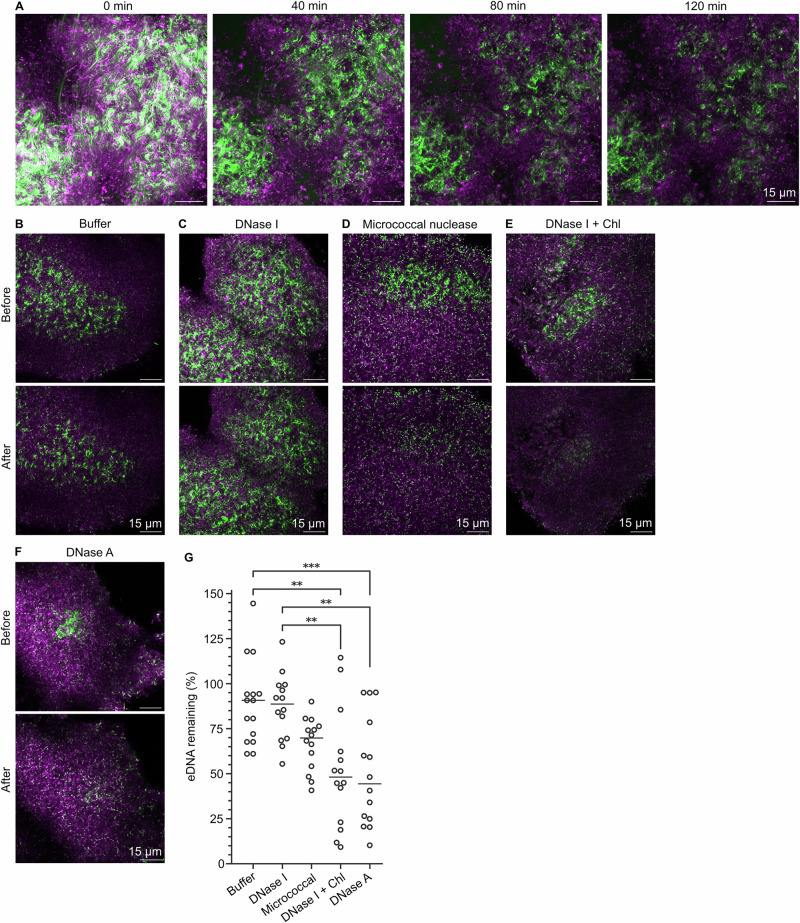
Extracellular DNA (eDNA) in bacterial biofilms can form non-canonical structures like Z-DNA and G-quadruplex (G4), which enhance biofilm resilience by providing protection against mammalian DNases. However, the conformation of eDNA in dental biofilms remains unexplored. Using fluorescence immunolabeling and confocal microscopy, we examined dental biofilms from healthy and caries-active subjects, revealing B-DNA, G4-, and Z-DNA structures surrounding clusters of bacteria, with some structures directly associated with the bacterial cell surface. We demonstrated that these non-canonical DNA structures were resistant to mammalian DNase I. Using a Streptococcus mutans biofilm model, we visualised fluorescently labelled eDNA during enzyme treatment and identified both an experimental nuclease and a DNase I-chloroquine combination capable of removing eDNA that was resistant to DNase I. These findings suggest that G4 and Z-DNA structures represent novel targets for improved enzyme formulations in controlling dental biofilms and potentially other biofilms containing these secondary DNA structures.


Conflict of interest statement

Competing interests: This research was partially funded by Novonesis A/S Denmark. Novonesis A/S Denmark also produced the experimental enzyme used in this study. D.C.S.E., L.G.P., M.K.T., and I.K. were all employees of Novonesis A/S during the time of conducting research and writing. The other authors declare no financial or non-financial competing interests.

Figures

Fig. 1
Fig. 1. Extracellular G4 structures in dental biofilms from healthy subjects.
Confocal microscopy images show microorganisms (FM4-64 membrane stain, magenta), B-DNA (anti-dsDNA antibody, cyan), and G4 (BG4 antibody, yellow) in dental biofilms. A 3D merged confocal image of an example of a G4 structure in a dental biofilm from a healthy subject. B Single channel and merged 2D confocal images of G4 structures in a dental biofilm from a healthy subject. CF Merged 2D images showing further examples of G4 in dental biofilms from healthy subjects. The image in (A) was prepared in Zen Blue (Zeiss) and the images in (CF) are images of single planes in biofilms that were prepared in Fiji ImageJ.
Fig. 2
Fig. 2. Extracellular Z-DNA structures in dental biofilms from healthy subjects.
Confocal microscopy images show microorganisms (FM4-64 membrane stain, magenta), B-DNA (anti-dsDNA antibody, cyan), and Z-DNA (Z22 antibody, yellow) in dental biofilms. A 3D merged confocal image of an example of a Z-DNA structure in a dental biofilm from a healthy subject. B Single channel and merged 2D confocal images of a Z-DNA structure in a dental biofilm from a healthy subject. CF Merged 2D images showing further examples of G4 in dental biofilms from healthy subjects. The image in (A) was prepared in Zen Blue (Zeiss) and the images in (C–F) were prepared in Fiji ImageJ. CE are images of single planes within biofilms, and (F) is a maximum intensity Z-projection.
Fig. 3
Fig. 3. Extracellular G4 structures in dental biofilms from caries-active patients.
Confocal microscopy images show microorganisms (FM4-64 membrane stain, magenta), B-DNA (anti-dsDNA antibody, cyan), and G4 (BG4 antibody, yellow) in dental biofilms from caries-active subjects. A Merged 3D image of an example G4 structure in a dental biofilm from a caries-active subject. B Single channel and merged 2D images of G4 structures in a dental biofilm from a caries-active subject. CF Merged 2D images of G4 structures in dental biofilms from caries-active subjects. The image in (A) was prepared in Zen Blue (Zeiss) and the images in (CF) are images of single planes in biofilms that were prepared in Fiji ImageJ.
Fig. 4
Fig. 4. Extracellular Z-DNA structures in dental biofilms from caries-active patients.
Confocal microscopy images show microorganisms (FM4-64 membrane stain, magenta), B-DNA (anti-dsDNA antibody, cyan), and Z-DNA (Z22 antibody, yellow) in dental biofilms from caries-active subjects. A Merged 3D image of an example Z-DNA structure in a dental biofilm from a caries-active subject. B Single channel and merged 2D images of a Z-DNA structure in a dental biofilm from a caries-active subject. CF Merged 2D images of Z-DNA structures in dental biofilms from caries-active subjects. The image in (A) was prepared in Zen Blue (Zeiss) and the images in (CF) are images of single planes in biofilms that were prepared in Fiji ImageJ.
Fig. 5
Fig. 5. Extracellular DNA structures remain in dental biofilms after treatment with DNase I.
Confocal microscopy images show microorganisms (FM4-64 membrane stain, magenta), B-DNA (anti-dsDNA antibody, cyan), and Z-DNA (Z22 antibody, yellow) or G4 (BG4 antibody, yellow) in dental biofilms from a healthy subject visualised by confocal microscopy. A Single channel and merged 2D images of G4 in dental biofilms with and without treatment with DNase I. B Single channel and merged 2D images of Z-DNA in dental biofilms with and without treatment with DNase I. G4, Z-DNA, and also B-DNA structures remained in the dental biofilms after a 1 h treatment with DNase I. All images in this figure were collected using the same microscope settings, and the brightnesses of all images were adjusted equally in Fiji ImageJ.
Fig. 6
Fig. 6. eDNA rich S. mutans aggregate biofilm model.
A S. mutans aggregate biofilms grown in brain heart infusion medium supplemented with 1 % sucrose and 200 mM NaCl. B Diagram representing how S. mutans aggregate biofilms were immobilised in a sandwich chamber. Panel B was created in BioRender. Evans, D. (2025) https://BioRender.com/j96w607. C Representative 2D confocal image of an S. mutans aggregate biofilm with eDNA. Cells are stained with FM 4-64 (magenta), and eDNA is stained with SYTOX Green (green). D S. mutans aggregate biofilm (brightfield, grey) with G4 (BG4 antibody, yellow). E S. mutans aggregate biofilm (brightfield, grey) with Z-DNA (Z22 antibody, yellow). The brightnesses of each image were adjusted individually in Fiji ImageJ.
Fig. 7
Fig. 7. Enzyme removal of recalcitrant eDNA in S. mutans biofilms.
A S. mutans aggregate biofilm (FM 4-64, magenta) treated with DNase I for 120 min and imaged every 2 min with time-lapse confocal microscopy. Pockets of eDNA (SYTOX Green, green) that were recalcitrant to DNase I remained after 120 min incubation. A maximum intensity Z-projection of a 5.3 μm Z-stack is shown. In subsequent experiments, S. mutans biofilms were pre-treated for 120 min with DNase I, followed by a second 60 min treatment with (B) buffer, C DNase I, D micrococcal nuclease, E DNase I combined with chloroquine (Chl), and an experimental DNase (F) DNase A. Biofilms were visualised before and after the subsequent treatment. Analysis was performed on 5 2D FOV from each sample. Experiments were performed in triplicate under identical conditions and imaging settings. G Fraction of DNase I-recalcitrant eDNA remaining after each enzyme treatment. The technical variation was greater than the biological variation therefore all replicates were treated as true replicates. Each point corresponds to results from 1 FOV and black bars represent group medians. The data were tested for normality, then analysed with a one-way ANOVA followed by a Tukey’s test. *** denotes p < 0.001 and ** denotes p < 0.01 significance levels. The brightnesses of each image presented were adjusted in Fiji ImageJ. The adjustments were identical for the “before” and “after” images (BF) and for all timepoints (A).
Fig. 8
Fig. 8. Analysis of biofilm acidity in response to enzyme treatment.
S. mutans aggregate biofilms were labelled with C-SNARF-4 and the biofilms acidified their surroundings after exposure to sucrose. Images were recorded after 20 and 30 min, and the pH was calculated as the ratio of pixel values in the medium surrounding the biofilm in the green and red channels. A False colouring to represent biofilm pH. B The results showed that all biofilms were highly acidic, and this was unchanged by treatment with enzymes. The pH in all samples started at 7 and dropped in response to exposure to sucrose irrespective of whether biofilms were treated with enzymes prior to the measurement. Experiments were performed in triplicate with 5 FOV recorded per biological replicate.

Similar articles

Cited by

References

    1. Jakubovics, N. S., Goodman, S. D., Mashburn-Warren, L., Stafford, G. P. & Cieplik, F. The dental plaque biofilm matrix. Periodontol 200086, 32–56 (2021). - PMC - PubMed
    1. Lamont, R. J., Koo, H. & Hajishengallis, G. The oral microbiota: dynamic communities and host interactions. Nat. Rev. Microbiol.16, 745–759 (2018). - PMC - PubMed
    1. Nyvad, B. & Takahashi, N. Integrated hypothesis of dental caries and periodontal diseases. J. Oral Microbiol.1210.1080/20002297.2019.1710953 (2020). - PMC - PubMed
    1. Kassebaum, N. J. et al. Global burden of untreated caries: a systematic review and metaregression. J. Dent. Res.94, 650–658 (2015). - PubMed
    1. Schwendicke, F. et al. Socioeconomic inequality and caries: a systematic review and meta-analysis. J. Dent. Res.94, 10–18 (2015). - PubMed

MeSH terms

LinkOut - more resources