. 2025 Jul;22(7):776-790.
doi: 10.1038/s41423-025-01288-5. Epub 2025 May 19.

Targeting Lp-PLA2 inhibits profibrotic monocyte-derived macrophages in silicosis through restoring cardiolipin-mediated mitophagy

Affiliations

Targeting Lp-PLA2 inhibits profibrotic monocyte-derived macrophages in silicosis through restoring cardiolipin-mediated mitophagy

Shifeng Li et al. Cell Mol Immunol. 2025 Jul.

Abstract

Monocyte-derived macrophages (MoMacs) are the most important effector cells that cause pulmonary fibrosis. However, the characteristics of MoMac differentiation in silicosis and the mechanisms by which MoMacs affect the progression of pulmonary fibrosis remain unclear. Integration of single-cell and spatial transcriptomic analyses revealed that the silicosis niche was occupied by a subset of MoMacs, identified as Spp1hiMacs, which remain in an immature transitional state of differentiation during silicosis. This study investigated the mechanistic foundations of mitochondrial damage induced by the lipoprotein-associated phospholipase A2 (Lp-PLA2, encoded by Pla2g7)-acyl-CoA:lysocardiolipin acyltransferase-1 (ALCAT1)-cardiolipin (CL) signaling pathway, which interferes with Spp1hiMac differentiation. We demonstrated that in SiO2-induced MoMacs, Lp-PLA2 induces abnormal CL acylation through the activation of ALCAT1, resulting in impaired mitochondrial localization of PINK1 and LC3B and mitochondrial autophagy defects. Simultaneously, lysosomal dysfunction causes the release of the lysosomal protein cathepsin B into the cytoplasm, which involves M1 and M2 macrophage polarization and the activation of proinflammatory and profibrotic pathways. Furthermore, we assessed the efficacy of the Lp-PLA2 inhibitor darapladib in ameliorating silica-induced pulmonary fibrosis in a murine model. Our findings enhance our understanding of silicosis pathogenesis and offer promising opportunities for developing targeted therapies to mitigate fibrotic progression and maintain lung function in affected individuals.

Keywords: Cardiolipin; Lipoprotein-associated phospholipase A2; Mitophagy; Monocyte-derived macrophages; Pulmonary fibrosis.


Conflict of interest statement

Competing interests: The authors declare no competing interests.

Figures

Fig. 1
Fig. 1
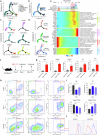
Cellular composition and macrophage subclusters in silicotic lungs. a Flow chart of the study design and analysis. (b) UMAP plots showing the identified cell types annotated by known cell biomarkers (Supplementary Fig. S1). c Macrophage clusters (including AM and IM in (b)) were identified via Lyz2, as shown on UMAP feature plots, and the intensity of expression is indicated by purple color. d Clusters of cells expressing Lyz2 were subsets from the main dataset and reclustered, revealing five subclusters, including TRAMs, MertkhiMacs, Spp1hiMacs, S100a8/9hiMacs, and recMacs. e The percentage of macrophage subclusters in lung tissue as silicosis progresses. f Gene expression of key markers in each macrophage subcluster. g Predicted distribution of five macrophage subclusters in pulmonary niches
Fig. 2
Fig. 2
Trajectory analysis of macrophage subclusters in silicosis revealed distinct features. Differentiation trajectory of macrophages in all lung samples with points colored by a macrophage subcluster and b pseudotime. c Differentiation trajectory of each macrophage subcluster. d Differentiation trajectory of macrophages in the control (0 d), inflammation (3 d and 7 d), and fibrosis (14 d, 28 d, and 56 d) groups. e Pseudoheatmap showing the various genes involved in the differentiation process of macrophages, which were clustered into 4 clusters related to fibrosis, inflammation, antigens, and translation. f Schematic diagram of the silicosis mouse model. g mRNA expression levels of Spp1, Mmp12, Pla2g7, Il17r, and Il1rn in AM subclusters sorted from silicosis and control mouse lung tissue, n = 3 per group. h, i Proportion of IM subclusters and AM subclusters in silicosis mouse lungs analyzed by FC. n = 3 per group. j Fluorescence of Cx3cr1 and Lp-PLA2 between SiglecFloAMs and SiglecFhiAMs. The data are presented as the means ± SDs; *p < 0.05, **p < 0.01, ***p < 0.001, ns p ≥ 0.05
Fig. 3
Fig. 3
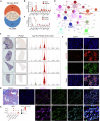
Expression of the key gene Pla2g7 in macrophages from silicosis lung tissue. a Venn diagram showing the intersection of the characteristic genes of the silicosis niche detected by ST-seq with the characteristics of the fibrosis module in pseudotime and the key fibrotic genes. b mRNA expression of key fibrotic genes in lung tissue from silicosis patients and donors. n = 5 per group. c mRNA expression of key fibrotic genes in lung tissue from control and silicosis mice. n = 5 per group. d Gene interaction network and functional enrichment analysis of the genes characteristic of the silicosis niche detected by ST-seq. e Expression of Pla2g7 in different lung tissue niches detected by ST-seq. f Codistribution of Lp-PLA2 and CD68 in the lung tissues of silicosis model mice, as determined by immunofluorescence staining; scale bar = 50 μm. g Codistribution of Lp-PLA2, Cx3cr1, and SiglecF in the lung tissues of silicosis patients, as determined by immunofluorescence staining; scale bar = 50 μm; zoom bar = 10 μm. h Expression of Pla2g7 in macrophage subsets during the normal fibrotic (0 days), inflammatory (3–7 days) and fibrotic (14–56 days) stages, as detected via scRNA-seq. The data are presented as the means ± SDs; *p < 0.05, **p < 0.01, ***p < 0.001
Fig. 4
Fig. 4
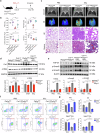
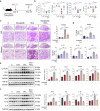
Effects of macrophage-specific Pla2g7 knockout on silicosis fibrosis and macrophage subsets in mice. a Crelyz2Pla2g7fl/fl and Pla2g7fl/fl mice were treated with a single intratracheal administration of silica to induce silicosis or with PBS as a control, and the mice were sacrificed on the 28th day after administration. b Lung function of the FRCs, PEFs, Cchords, and VCs of the mice in different experimental groups. n = 9 per group. c Micro-CT image, lung tissue oxygenation, HE, and Masson staining of Crelyz2Pla2g7fl/fl and Pla2g7fl/fl mice stimulated with SiO2. Scale bar = 1 mm; zoom bar = 50 μm. d The protein expression of α-SMA and Col I in the lung tissue of Crelyz2Pla2g7fl/fl and Pla2g7fl/fl mice stimulated with SiO2. n = 3 per group. e The protein expression of TGF-β1, p-Smad2, and p-Smad3 in the lung tissue of Crelyz2Pla2g7fl/fl and Pla2g7fl/fl mice stimulated with SiO2. n = 3 per group. f, g Proportion of macrophage subsets in mice detected by FC; n = 3 per group. The data are presented as the means ± SDs; *p < 0.05, **p < 0.01, ***p < 0.001, ns p ≥ 0.05
Fig. 5
Fig. 5
Loss of Pla2g7 attenuated M1 and M2 polarization in macrophages. a Classification of macrophage subsets by M0/M1/M2-like gene signatures detected by scRNA-seq. b FC analysis of M1 and M2 macrophages in the lung tissue of Crelyz2Pla2g7fl/fl and Pla2g7fl/fl mice stimulated with SiO2, n = 3. c, d Colocalization of Lp-PLA2 with TNF-α and Lp-PLA2 with Arg1 in the lung tissues of silicosis mice as detected by immunofluorescence; scale bar = 100 μm. e Protein expression of iNOS, IL-1β, Arg 1, and IL-10 in the lung tissue of Crelyz2Pla2g7fl/fl and control Pla2g7fl/fl mice treated with SiO2; n = 3. f Western blot analysis of iNOS, IL-6, IL-1β, Arg 1, p-Stat6, and Stat6 expression in SiO2-stimulated BMDMs transfected with scrambled (si-NC) or Pla2g7 siRNA (si-Pla2g7), n = 3. g, h Expression of α-SMA in MLE12 alveolar epithelial cells and primary fibroblasts cocultured with SiO2-stimulated BMDMs transfected with si-NC or si-Pla2g7; scale bar = 25 μm. The data are presented as the means ± SDs; *p < 0.05, **p < 0.01, ***p < 0.001, ns p ≥ 0.05
Fig. 6
Fig. 6
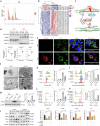
Effect of the Lp-PLA2-cardiolipin (CL) pathway on SiO2-induced mitochondrial damage in macrophages. a The saturation degree of different carbon units in the CL. b Heatmap of CL acylation levels. c Schematic diagram of the Lp-PLA2-Cl-mediated mitochondrial damage model. d Expression of Lp-PLA2 and ALCAT1 in the mitochondria and cytoplasm of SiO2-induced RAW264.7 cells, n = 4. e Colocalization of Lp-PLA2 and the mitochondrial marker protein COX IV detected by immunofluorescence. f Mitochondrial damage in the lung macrophages of control and silicosis mice was detected via TEM. g Western blot analysis of ALCAT1 expression in SiO2-induced BMDMs transfected with si-NC or si-Pla2g7; n = 3. h The mitoSOX level in macrophages treated with SiO2 and si-Pla2g7; n = 4. i The mitochondrial membrane potential of macrophages treated with SiO2 or si-Pla2g7; n = 4. j MitoSOX levels in macrophages treated with OE-Pla2g7 or si-Alcat1, n = 4. k Mitochondrial membrane potential of macrophages treated with OE-Pla2g7 or si-Alcat1, n = 4. l Western blot analysis of OPA1, MFN2, DRP1, and FIS1 expression in macrophages transfected with OE-Pla2g7 or si-Alcat1, n = 3. The data are presented as the means ± SDs; *p < 0.05, **p < 0.01, ***p < 0.001, ns p ≥ 0.05
Fig. 7
Fig. 7
The Lp-PLA2-CL pathway induced mitophagy dysfunction in SiO2-induced macrophages and in SiglecFloAM. a Protein expression of Pink1 and LC3B in the mitochondria of RAW264.7 cells treated with SiO2 and si-Pla2g7; n = 3. b Pink1 and LC3B expression in the mitochondria of macrophages treated with OE-Pla2g7 or si-Alcat1; n = 3. c Ubiquitination levels of proteins in RAW264.7 cells treated with SiO2 and si-Pla2g7, n = 3. d Ubiquitination levels of proteins in RAW264.7 cells treated with OE-Pla2g7 and si-Alcat1, n = 3. e The protein expression of NLRP3, IL-1β, caspase-1, cleaved caspase-1, GSDMD, GSNMDNT, cGAS, and Sting in RAW264.7 cells treated with OE-Pla2g7 and si-Alcat1. f Autophagosome acidification levels in macrophages treated with SiO2 and si-Pla2g7; scale bar = 10 μm. g Autophagosome acidification levels in macrophages treated with OE-Pla2g7 and si-Alcat1; scale bar = 10 μm. h HE and Masson staining of lung tissue from Crelyz2Pla2g7fl/fl and control Pla2g7fl/fl mice intratracheally treated with SiO2 and the autophagy inhibitor Baf A1 (scale bar = 20 μm). i The populations of SiglecFloAMs in different experimental groups were analyzed via flow cytometry. j The protein expression of LC3I/II, TOM20, cytochrome C, and cathepsin B in macrophages treated with SiO2 and si-Pla2g7; n = 3. k Immunostaining of cathepsin B and LAMP1 in RAW264.7 cells treated with OE-Pla2g7 or si-Alcat1 (scale bar = 10 μm). l The protein expression of Col I, α-SMA, TOM20, and cytochrome C in the lung tissue of the mice in the different experimental groups. n = 3 per group. m The protein expression of Col I, α-SMA, TOM20, and cytochrome C in the lung tissue of the mice in the different experimental groups. n = 3 per group. Data are presented as the means ± SDs, *p < 0.05, **p < 0.01, ***p < 0.001, ns p ≥ 0.05
Fig. 8
Fig. 8
Antifibrotic effect of the Lp-PLA2 specific inhibitor darapladib on silicotic mice. a Schematic diagram of silicotic mice treated with darapladib. b Lung function measurements of FRC, PEF, Cchord, and VC in mice from different experimental groups. n = 9 per group. c Lung tissue morphology and collagen deposition detected by HE and Masson staining; scale bar = 1 mm; zoom bar = 50 μm. d The protein expression levels of iNOS, Arg 1, IL-1β, and IL-6 in mouse lung tissues were examined via ELISA. n = 6 per group. e Western blot analysis was performed to detect the expression of Lp-PLA2, α-SMA and Col I in mouse lung tissues, n = 3. f Western blot analysis was performed to detect the expression of iNOS, Arg 1, IL-1β, and IL-6 in mouse lung tissues. n = 3 per group. The data are presented as the means ± SDs; *p < 0.05, **p < 0.01, ***p < 0.001, ns p ≥ 0.05

Similar articles

References

    1. Hoy RF, Chambers DC. Silica-related diseases in the modern world. Allergy. 2020;75:2805–17. - PubMed
    1. Li T, Yang X, Xu H, Liu H. Early Identification, Accurate Diagnosis, and Treatment of Silicosis. Can Respir J. 2022;2022:3769134. - PMC - PubMed
    1. Elderbrook M, Harrison R, Grajewski B, Tomasallo C, Meiman J. Silicosis: Emerging Trends and How to Screen for Early Detection. WMJ. 2023;122:114–7. - PubMed
    1. Zhu Y, Duan XY, Cheng YQ, Yao XJ, Xu H, Zhang KS, et al. Evaluation of differential serum expression of three factors and pulmonary function in patients with silicosis. Int J Occup Med Environ Health. 2021;34:527–40. - PubMed
    1. Hou Z, Zhang X, Gao Y, Geng J, Jiang Y, Dai H, et al. Serum Osteopontin, KL-6, and Syndecan-4 as Potential Biomarkers in the Diagnosis of Coal Workers’ Pneumoconiosis: A Case‒Control Study. Pharmgenomics Pers Med. 2023;16:537–49. - PMC - PubMed

LinkOut - more resources