. 2025 Aug;20(8):1119-1130.
doi: 10.1038/s41565-025-01922-3. Epub 2025 May 19.

Tumour-derived microparticles obtained through microwave irradiation induce immunogenic cell death in lung adenocarcinoma

Affiliations

Tumour-derived microparticles obtained through microwave irradiation induce immunogenic cell death in lung adenocarcinoma

Yali Wu et al. Nat Nanotechnol. 2025 Aug.

Abstract

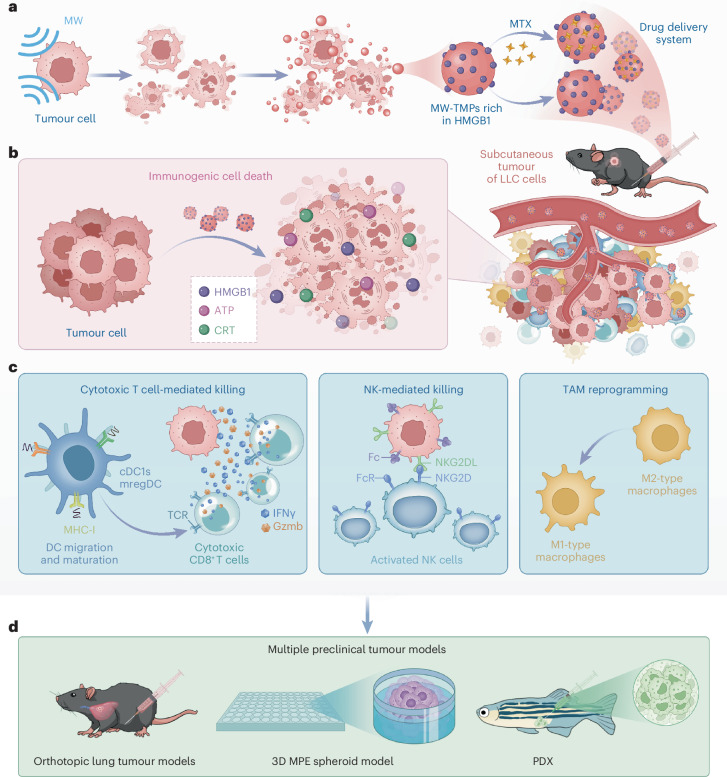
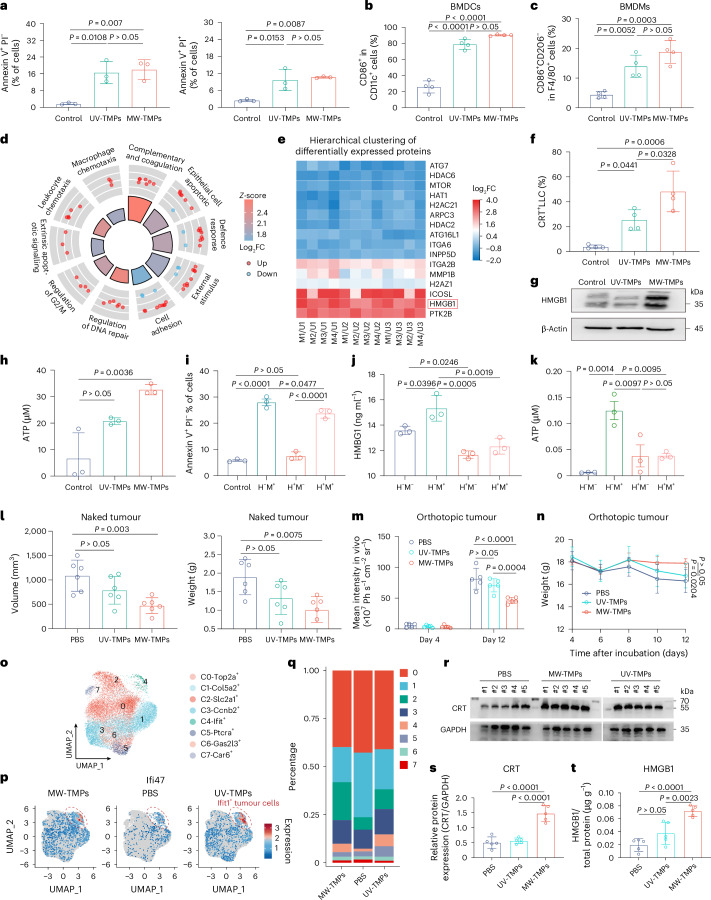
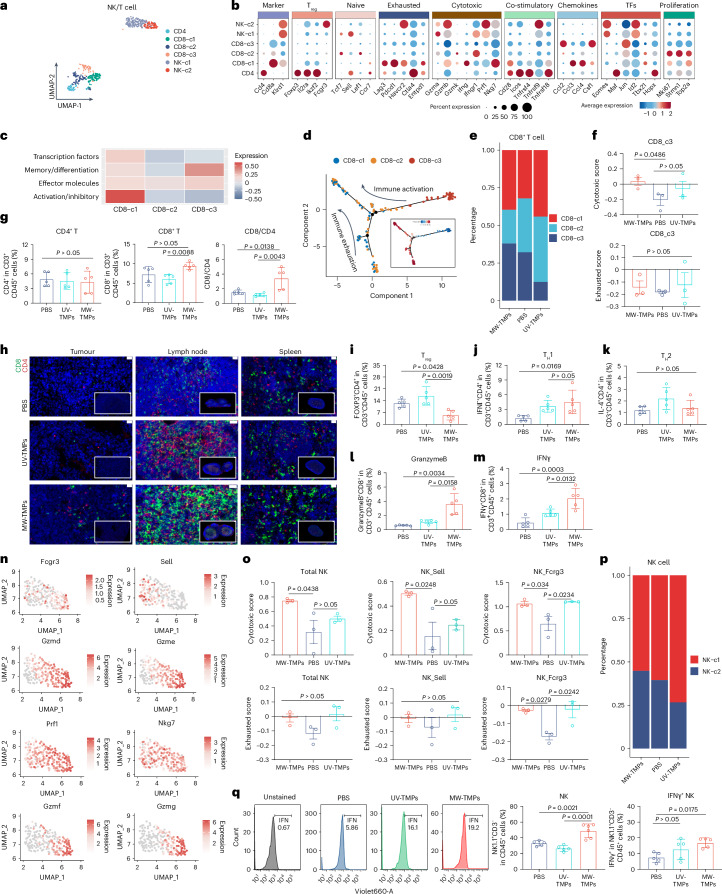
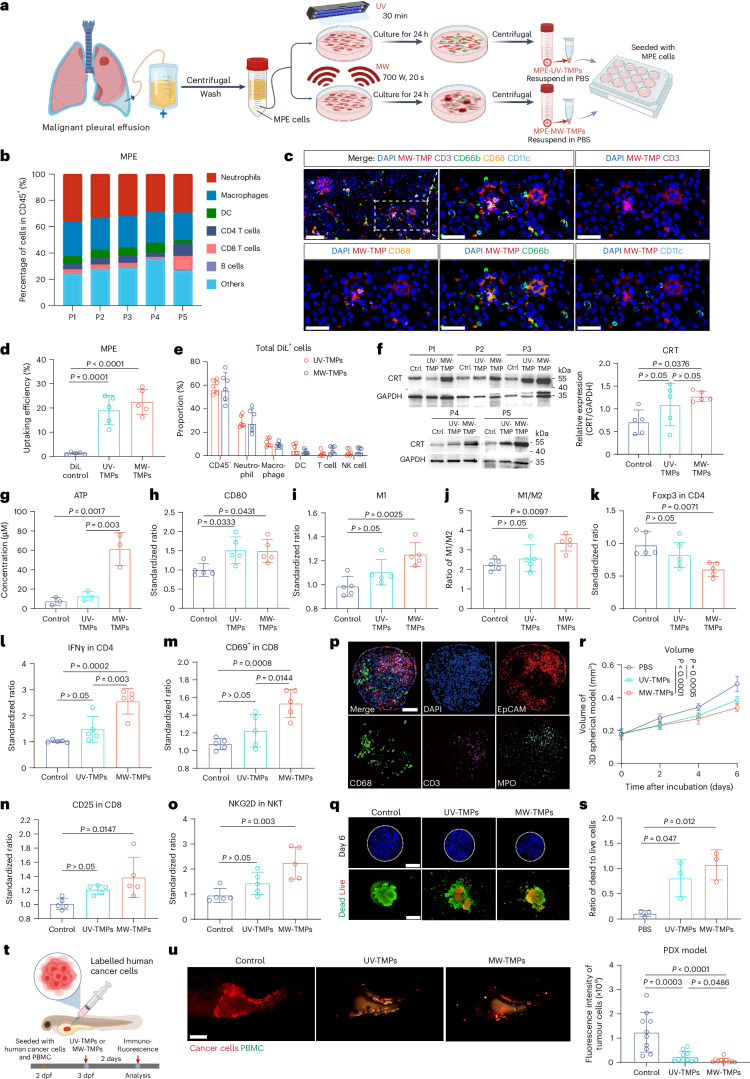
Tumour-derived microparticles (TMPs), extracellular vesicles traditionally obtained upon ultraviolet (UV) radiation of tumour cells, hold promise in tumour immunotherapies and vaccines and have demonstrated potential as drug delivery systems for tumour treatment. However, concerns remain regarding the limited efficacy and safety of UV-derived TMPs. Here we introduce a microwave (MW)-assisted method for preparing TMPs, termed MW-TMPs. Brief exposure of tumour cells to short-wavelength MW radiation promotes the release of TMPs showing superior in vivo antitumour activity and safety compared with UV-TMPs. MW-TMPs induce immunogenic cell death and reprogramme suppressive tumour immune microenvironments in different lung tumour models, enabling dual targeting of tumour cells by natural killer and T cells. We show that they can efficiently deliver methotrexate to tumours, synergistically boosting the efficacy of PD-L1 blockade. This MW-TMP development strategy is simpler, more efficient and safer than traditional UV-TMP methods.


Conflict of interest statement

Competing interests: The authors declare no competing interests.

Figures

Fig. 1
Fig. 1. Schematic illustration of MW-TMPs as an effective immunotherapy and drug delivery platform for LUAD treatment.
a, MW-TMPs, derived from MW-stimulated dying LLC cells, are enriched with HMGB1 and can effectively deliver small-molecule drugs, such as MTX. b, MW-TMPs induce ICD and prime the subsequent chain reaction of antitumour immunity in the TME. c, MW-TMPs enable dual targeting of tumour cells by NK and T cells and reprogramme TAMs into antitumour subtypes. d, Multiple preclinical tumour models. TCR, T cell receptor.
Fig. 2
Fig. 2. MW-induced cell death and EV secretion.
a, SEM images of LLC cells without stimulation (control) or exposed to UV or MW stimulation (n = 3). b, Western blots show the protein levels of EEA1, CLCN3, SH3GL3, ZBP1, CASP4 and GSDMD in the LLCs stimulated with UV or MW (n = 3). c, Characteristics of cell surface detected by atomic force microscope (n = 3). d, Schematic representation of MW-TMP preparation and isolation, created in BioRender. Y, Z. (2025) https://BioRender.com/s46r100. e, Representative transmission electron microscopy images of MW-TMPs and UV-TMPs (n = 3). Scale bars, 100 nm. f, Sodium dodecyl sulfate–polyacrylamide gel electrophoresis gel staining with Coomassie brilliant blue of LLC, UV-TMPs and MW-TMPs (n = 4). g,h, Concentration (g) and size distribution (h) of MW-TMPs induced by multiple MW conditions detected by NTA (n = 3). L10, L20 and L30 represent MW-stimulating cells under 175 W 10 s, 20 s and 30 s, respectively. H10, H20 and H30 refer to MW conditions of 700 W 10 s, 20 s and 30 s, respectively. i, The size distribution of MW-TMPs and UV-TMPs (n = 3). j, Fluorescence intensity of Annexin V within MW-TMPs by FCM (n = 3). The data in g and h are shown in analytic plots as mean ± s.d., and ordinary one-way ANOVA was used. The exact P value was noted. Source data
Fig. 3
Fig. 3. MW-TMPs are enriched with HMGB1 and facilitate ICD.
a, Apoptotic analysis of LLC cells treated with MW-TMPs or UV-TMPs by FCM analysis (n = 3). b, Quantitative data of CD86 expression in DC cells under the indicated treatment (n = 4). c, The percentages of CD86 (standing for M1 type macrophages) in BMDMs treated with MW-TMPs (n = 4). d, The circular diagram illustrating the enrichment analysis of the pathways of interest (n = 3). Statistical significance was defined as log2FC > 2, adjusted P value < 0.05. e, Heat map of cluster analysis for proteomic profiling in MW-TMPs and UV-TMPs samples (n = 3). f, FCM analysis of CRT expression in LLC cells under the indicated treatment (n = 4). g, WB analysis of HMGB1 expression in LLC cells under the indicated treatment (n = 3). h, ATP concentrations in the supernatant of LLC cells under the indicated treatment for 24 h (n = 3). ik, After the treatment of MW-TMPs (HM+), HMGB1 inhibitor glycyrrhizic acid (H+M) or both of them (H+M+), the apoptosis of LLC cells (i), HMGB1 levels (j) and ATP concentrations in LLC supernatant (k) were analysed (n = 3). l, Assessment of naked tumour volume and weight in subcutaneous tumour models under indicated treatment (n = 6). m, The quantitative analysis of orthotopic lung tumour models at 4 and 12 days (n = 5). n, Body weight measurements of orthotopic tumour models during the administration (n = 6). o, Umap showing re-clustered subgroups in malignant cells. p, Umap showing Ifit1 in MW, PBS and UV group (n = 3). q, The proportion of cells in each population in their respective groups (n = 3). r, WB analysis of the expression of CRT in subcutaneous tumours from mice after the intervention of PBS, UV-TMPs or MW-TMPs (n = 5). s, The statistical analysis of WB results in r. t, The HMGB1 release profile detected with ELISA (n = 5). The data in ac, f, hm, s and t are shown in analytic plots as mean ± s.d., and ordinary one-way ANOVA was used for data in ac, f, hl, s and t. Two-way ANOVA was used for m and n. The exact P value was noted. Source data
Fig. 4
Fig. 4. MW-TMPs activate DCs for enhanced antigen presentation and reprogramme TAM to antitumour phenotype in the TME.
a, The proportion analysis of CD45+ cells in the three groups (n = 3). b, Umap plot of DCs coloured by clusters. c, The developmental trajectory analysis of DCs. d, The proportion of the DC subtypes in PBS, UV-TMP and MW-TMP groups. e, Cell-to-cell communication analysis of cDC1s, cDC2s and mregDCs. f, Representative immunofluorescence graphs of tumours, spleens and lymph nodes (n = 5). Green, CD11c; red, CD86. Scale bars, 20 μm. g,h, DC infiltration and the ratios of CD86+ DCs (g) and CD80+ DCs (h) in tumours via FCM (n = 5). i, Distribution of CD8a+ cDC1s in tumour tissues by FCM (n = 5). j, The proportion of MHCII in CCR7+ mregDCs by FCM in tumour sites (n = 5). MFI, mean fluorescence intensity. k, Umap plot of monocytes/macrophages coloured by clusters among PBS, UV-TMPs and MW-TMPs. l, The proportion of six subgroups in specific groups. m, M0, M1 and M2 signature scores based on the gene signatures from CIBERSORT. n, The developmental trajectory analysis of monocytes/macrophages. o, The specific marker gene expression in developmental trajectory. p,q, The proportions of M1-like (p) and M2-like (q) macrophages by FCM in tumour sites (n = 5). The data in a, gj, p and q are shown in analytic plots as mean ± s.d., and ordinary one-way ANOVA was used for data in gj, p and q. Two-way ANOVA was used for a. The exact P value was noted. Source data
Fig. 5
Fig. 5. MW-TMPs promote cytotoxic T/NK cell expansion.
a, The umap plot of NK and T cells. b, Heat map of normalized expression of NK and T cell classical genes among six clusters. TFs, Transcription factors. c, The gene signature scores of memory/differentiation, activation/inhibitory, effector and transcription factor expression in CD8-c1, CD8-c2 and CD8-c3. d, The developmental trajectory analysis of CD8+ T cells. e, The distribution of CD8-subtypes among groups treated with respective intervention. f, The cytotoxic and exhausted gene signature scores among PBS, MW-TMP and UV-TMP groups (n = 3). g, Ratios of CD8+ T, CD4+ T cells in tumours via FCM (n = 5). h, Representative immunofluorescence graphs of tumours, spleens and lymph nodes (n = 5). Green, CD8; red, CD4. Scale bars, 20 μm. i, The proportions of Treg cells in tumours (n = 5). j,k, The proportions of Th1 (j) and Th2 (k) cells in tumours (n = 5). l,m, Cytotoxic CD8+ T cells in tumours secrete higher percentages of Gzmb (l) and IFNγ (m) with the treatment of MW-TMPs (n = 5). n, The umap plot of cytotoxic effector genes coloured by cluster in the NK group. o, The cytotoxic and exhausted gene signatures for the two NK subclusters (n = 3). p, The proportion of NK subgroups in the untreated and treated groups (n = 5). q, The proportions of total NK cells and activated subgroups (IFNγ+ NK) in tumours (n = 5). The data in f, g, im, o and q are shown in analytic plots as mean ± s.d., and ordinary one-way ANOVA was used for data in f, g, im, o and q. The exact P value was noted. Source data
Fig. 6
Fig. 6. Autologous MW-TMPs effectively enhance the antitumour immune response in human MPE.
a, Schematic illustration of the treatment process of MPE from patients with lung cancer, created in BioRender. Y, Z. (2025) https://BioRender.com/lgc5c9p. b, FCM analysis of the cell composition within human MPE (n = 5). c, Representative immunofluorescence images showing uptake of autologous MW-MPs (n = 5). Scale bars, 100 μm for the wider perspective. Scale bars, 50 μm for the smaller perspective. d, The proportion of cells taking up autologous MW-MPs in MPE (n = 5). e, Cellular composition of cells taking MPs (n = 6). f, WB analysis of the expression of CRT (n = 5). g, The concentrations of ATP in the supernatant of MPE cells (n = 3). ho, The ratios of CD80+ DCs (h), the proportions of M1-like (i), the ratios of M1/M2 (j), the cytokine levels of Foxp3 (k) and IFNγ (l) in CD4+ T cells, the proportions of CD69 (m) and CD25 (n) in CD8+ T cells in MPE and the levels of NKG2D in NKT cells (o) (n = 5). p, The representative illustration of 3D spherical models constructed by MPE cells (n = 3). Scale bar, 200 μm. q, The representative images of the spherical size after 6-day stimulation and live/dead fluorescence staining of 3D spherical models (n = 3). Scale bars, 200 μm. r, The volume curve of 3D spherical models (n = 3). s, The statistical analysis of live/dead fluorescence staining of 3D spherical models (n = 3). t, Schematic illustrating the establishment and treatment of zebrafish PDX models, created in BioRender. Y, Z. (2025) https://BioRender.com/0g7gooc. u, The representative images and fluorescence intensity analysis of tumour cells in PDX models (n = 10). Scale bar, 50 μm. The data in dq, t, u and w are shown in analytic plots as mean ± s.d., and ordinary one-way ANOVA was used for data in d, fq and u. Two-way ANOVA was used for e and t. The exact P value was noted. Source data
Extended Data Fig. 1
Extended Data Fig. 1. Microwave-induced cell death and extracellular vesicle secretion, related to Fig. 2.
(a) The top up-regulated GO pathways in MW-induced LLC cells compared to control, including three categories of biology: biological process (BP), cellular component (CC) and molecular function (MF) (n = 3). (b) Heat maps of DEGs related to cell death. (c) mRNA expressions related to EV secretion (Eea1, Clcn3 and Sh3gl3) and cell death (Casp4, Zbp1 and Gsdmd) in the LLCs stimulated with UV or MW (n = 3). (d) Heat maps of DEGs associated with EV exocytosis (n = 3). The data in (d) are shown in analytic plots as mean ± s.d., and ordinary one-way ANOVA was used. The exact p value was noted. Source data
Extended Data Fig. 2
Extended Data Fig. 2. MW-TMPs facilitate ICD in vitro, related to Fig. 3.
(a) Representative FCM plots of apoptotic analysis for LLC cells treated with MW-TMPs or UV-TMPs by FCM analysis (n = 3). b) FCM analysis of HMGB1 expression in UV-TMPs and MW-TMPs (n = 3). (c, d) Representative FCM plots and quantitative analysis of CD86+ BMDCs (c) and T cell distribution (d) following co-culture of BMDCs and T cells with LLC cells pretreated with either UV-TMP or MW-TMP (n = 3). (e, f) Production of IFN-γ in the co-incubation system (e) or in the presence of the HMGB1 inhibitor (f) (n = 3). The data in (b and c-f) are shown in analytic plots as mean ± s.d. The t test (with two sides) was performed for the two independent groups in (b), and one-way ANOVA was used to test statistical significance among three or more groups in (c-f). The exact p value was noted. Source data
Extended Data Fig. 3
Extended Data Fig. 3. Biodistribution, antitumor efficacy, and biosafety of MW-TMPs in vivo, related to Fig. 3.
(a) Biodistribution of MW-TMPs in tumors and vital organs at 1 hour, 24 hours and 48 hours post-administration (n = 4). (b) Representative images of MW-TMPs accumulation after 1 hour, 24 hours and 48 hours of post-intervention (n = 4). (c) Analysis of DiR-labeled MW-TMPs accumulation in subcutaneous tumors after 1 hour, 24 hours and 48 hours of post-intervention (n = 4). (d) Schematic diagram of treatment protocol for subcutaneous tumor-bearing mice, created in BioRender. Y, Z. (2025) https://BioRender.com/yi407v8. (e) Monitoring of subcutaneous tumor volume during the intervention period (n = 6). (f) Evaluation of the antitumor efficacy of UV-TMPs and MW-TMPs (n = 3). (g) Body weight measurements of subcutaneous tumor models during the administration (n = 6). (h) Representative immunohistochemical images and statistical analysis of TUNEL in tumor sections (n = 4). Scale bar, 100 μm. (i) Schematic illustration of the establishment and treatment of orthotopic lung tumor models, Created in BioRender. Y, Z. (2025) https://BioRender.com/cp6j4hh. (j) The in-vivo representative images of orthotopic lung tumor models at 4 and 12 days (n = 5). (k) Determination of lung weight after mice were sacrificed (n = 6). (l) Representative H&E staining histology of lung tissues following intervention of PBS, UV-TMPs and MW-TMPs (n = 6). Scale bar, 2000 μm. The data in (a, c, f, h and k-l) are shown in analytic plots as mean ± s.d. The t test (with two sides) was performed for the two independent groups in (f), and one-way ANOVA was used among three or more groups in (a, c, h and k-l). Two-way ANOVA was performed in (e and g). The exact p value was noted. Source data
Extended Data Fig. 4
Extended Data Fig. 4. MW-TMPs enhance the immune response of tumor cells, related to Fig. 3.
(a) Umap plot of all the cell types colored by clusters. (b) Dotpot of normalized expression of NK/T, DC Neutrophils, Monocytes/ Macrophages, Endothelial cells, Fibroblasts, Tumor cells marker gene expression among 19 clusters. (c) KEGG enrichment analysis of pathways among tumor clusters (Top 5). (d) The landscape of selected ligand-receptor interactions among tumor cells, DCs, endothelial, fibroblasts, mono/macrophages, neutrophils, NK cells and T cells. (e) Dotpot of ICD-associated genes and apoptosis marker in respective groups. (f) The standardized concentrations of ATP in tumor tissues assessed with an ATP kit (n = 5). (g, h) Representative immunohistochemical analysis of HMGB1 expression in tumor tissue and fluorescent images and intensity analysis of tumor tissues stained with CRT from subcutaneous tumor models (g) and orthotopic lung tumor mice (h) (n = 5). Scale bar, 20 μm. The data in (f-h) are shown in analytic plots as mean ± s.d. Ordinary one-way ANOVA was used among three groups in (f-h). The exact p value was noted. Source data
Extended Data Fig. 5
Extended Data Fig. 5. MW-TMPs activate DCs and enhance the antigen presentation ability of DCs, related to Fig. 4.
(a) Heatmap description of marker genes expression of cDC1s, mregDCs and cDC2s. (b) Heatmap of the differential genes in DCs among clusters. (c) The antigen-presenting gene expression on mregDCs. Box plots display median (center line), IQR (box), 1.5×IQR whiskers, and outliers (open circles). Min/max represent the range of non-outlier values (n = 3). (d) DCs infiltration in tumors (n = 5). (e) Distribution of CD103 + cDC1s in tumor tissues (n = 5). (f) Distribution of CCR7+mregDCs in tumor tissues (n = 5). (g) The proportion of CD86+ in CCR7+mregDCs (n = 5). The data in (d-g) are shown in analytic plots as mean ± s.d. Ordinary one-way ANOVA was used among three groups in (d-g). The exact p value was noted. Source data
Extended Data Fig. 6
Extended Data Fig. 6. MW-TMPs reprogram TAM into an anti-tumor phenotype in TME, related to Fig. 4.
(a) Heatmap of marker genes in six clusters of monocytes/macrophages. (b) The Heatmap of the differential genes in monocytes/macrophages among clusters. (c) Density distribution of different cell types along the pseudotime axis in macrophage. (d) The specific marker genes expression in developmental trajectory. (e) M0, M1, and M2 signature scores among three groups (n = 3). The data are presented in analytic plots as mean ± s.d., and two-way ANOVA was performed for statistical analysis. The exact p value was noted. Source data
Extended Data Fig. 7
Extended Data Fig. 7. MW-TMPs act as a drug-loading nanomaterial and enhance combinational efficacy of anti-PD-L1 immunotherapy, related to Fig. 6.
(a) Standard curve of MTX under HPLC assay (top) and the MTX contents in MW-TMPs-MTX after co-culturing MW-induced LLC cells with various MTX concentrations (50, 100, 200, and 300 μM) (bottom) (n = 3). Avg. Area: Average area. (b) Representative images and corresponding statistical analysis of live (Calcein-AM) /dead (PI) fluorescence staining of LLC stimulated with MW-TMPs or MW-TMPs-MTX for 24 hours (n = 5). Scale bar, 100 μm. (c) Apoptotic analysis of LLC cells treated with MW-TMPs-MTX (n = 3). (d) Schematic illustration of the subcutaneous LLC model establishment and treatment protocols involving the combination of MW-TMPs and anti-PD-L1, created in BioRender. Y, Z. (2025) https://BioRender.com/s12lrdf. (e, f, g) Changes in subcutaneous tumor volume (e, f) and body weight (g) during the intervention of PBS, MW-TMPs and MW-TMPs-MTX (n = 6). (h, i, j) Subcutaneous tumor growth (h, i) and body weight (j) monitored during the intervention of PBS, anti-PD-L1 and the combination group (n = 6). The data in (a-c, f-g and i-j) are shown in analytic plots as mean ± s.d. And one-way ANOVA was used among three or more groups in (a-c). Two-way ANOVA was performed in (f-g and i-j). The exact p value was noted. Source data

References

    1. Zhang, M. et al. Engineered exosomes from different sources for cancer-targeted therapy. Signal Transduct. Target. Ther.8, 124 (2023). - PMC - PubMed
    1. Welsh, J. A. et al. Minimal information for studies of extracellular vesicles (MISEV2023): from basic to advanced approaches. J. Extracell. Vesicles13, e12404 (2024). - PMC - PubMed
    1. Ortiz, A. Extracellular vesicles in cancer progression. Semin. Cancer Biol.76, 139–142 (2021). - PMC - PubMed
    1. Prakash, A., Gates, T., Zhao, X., Wangmo, D. & Subramanian, S. Tumor-derived extracellular vesicles in the colorectal cancer immune environment and immunotherapy. Pharmacol. Ther.241, 108332 (2023). - PubMed
    1. Torralba, D. et al. Priming of dendritic cells by DNA-containing extracellular vesicles from activated T cells through antigen-driven contacts. Nat. Commun.9, 2658 (2018). - PMC - PubMed

MeSH terms