Case Reports
. 2025 Jul;17(7):1556-1574.
doi: 10.1038/s44321-025-00249-9. Epub 2025 May 19.

Somatic PIK3R1 mutations in the iSH2 domain are accessible to PI3Kα inhibition

Affiliations
Case Reports

Somatic PIK3R1 mutations in the iSH2 domain are accessible to PI3Kα inhibition

Gabriel Morin et al. EMBO Mol Med. 2025 Jul.

Abstract

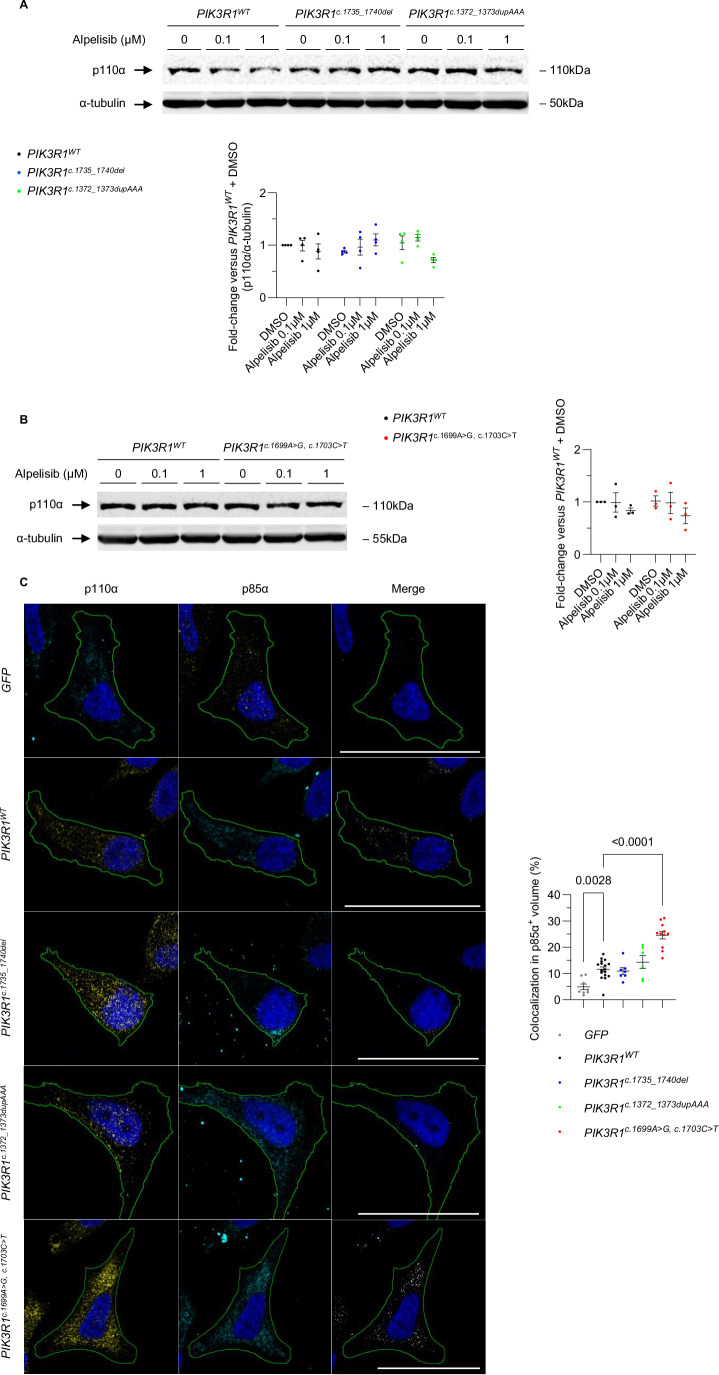
Mutations in PIK3R1 have recently been identified in patients with overgrowth syndromes and complex vascular malformations. PIK3R1 encodes p85α which acts as the regulatory subunit of the lipid kinase PI3Kα. PIK3R1 mutations result in the excessive activation of the AKT/mTOR pathway. Currently, there are no approved treatments specifically dedicated to patients with PIK3R1 mutations, and medical care primarily focuses on managing symptoms. In this study, we identified three patients, including two children, who had mosaic somatic PIK3R1 mutations affecting the iSH2 domain, along with severe associated symptoms that were unsuccessfully treated with rapamycin. We conducted in vitro experiments to investigate the impact of these mutations, including a double PIK3R1 mutation in cis observed in one patient. Our findings revealed that p85α mutants in the iSH2 domain showed sensitivity to alpelisib, a pharmacological inhibitor of PI3Kα. Based on these findings, we received authorization to administer alpelisib to all three patients. Following drug introduction, patients rapidly demonstrated clinical improvement, pain, fatigue and inflammatory flares were attenuated. Magnetic Resonance Imaging showed a mean decrease of 22.67% in the volume of vascular malformations over twelve months of treatment with alpelisib. No drug-related adverse events were reported during the course of the study. In conclusion, this study provides support for the use of PI3Kα inhibition as a promising therapeutic approach for individuals with PIK3R1-related anomalies.

Keywords: Alpelisib; Overgrowth Syndrome; PIK3R1-Related Disorders; Vascular Malformations; p85.


Conflict of interest statement

Disclosure and competing interests statement. A patent application (“BYL719 (alpelisib) for use in the treatment of PIK3CA-related overgrowth spectrum” #WO2017140828A1) has been filed by INSERM (Institut National de la Santé et de la Recherche Médicale), Centre National De La Recherche Scientifique (CNRS), Université Paris Cité, and Assistance Publique-Hôpitaux De Paris (AP-HP) for the use of BYL719 (alpelisib) in the treatment of PIK3CA-related overgrowth spectrum (PROS/CLOVES syndrome). G. Canaud is the inventor. This patent is licensed to Novartis. Guillaume Canaud receives or has received consulting fees from Novartis, Fresenius Medical Care, Vaderis, Alkermes, IPSEN and BridgeBio. The other authors declare no other competing interests. Guillaume Canaud is an editorial advisory board member. This has no bearing on the editorial consideration of this article for publication.

Figures

Figure 1
Figure 1. PIK3R1 variants activate AKT and are sensitive to alpelisib.
(A) Representative immunostainings of P-AKTT308 and P-S6RP in skin vascular malformations from three patients and skin biopsies from healthy controls, and quantification. Scale bar 50 μm. Graphs show mean ± SEM from 3 biological replicates in each group. P-values were obtained from Student’s t-tests. (B) Western blot and quantification of P-AKTS473 and P-S6RP levels in HeLa cells transfected with plasmids containing either PIK3R1WT, PIK3R1c.1735_1740del or PIK3R1c.1372_1373dupAAA variants, treated with either vehicle or alpelisib. In all experiments, cells were stimulated with recombinant human IGF-1 (10 ng/mL) for 30’. Graphs show mean ± SEM from 4 biological replicates in each group. P-values were obtained from two-way ANOVAs; exact p-values for P-AKT/α-tubulin are: p = 3.81 × 10−12 when comparing PIK3R1c.1735_1740del (DMSO) and PIK3R1WT (DMSO), p = 1.95 × 10−5 when comparing PIK3R1c.1372_1373dupAAA (DMSO) and PIK3R1WT (DMSO) and p = 1.82 × 10−7 when comparing PIK3R1c.1372_1373dupAAA (alpelisib 1 µM) and PIK3R1c.1372_1373dupAAA (DMSO). (C) Western blot and quantification of P-AKTS473 and P-S6RP levels in HeLa cells transfected with plasmids containing either PIK3R1WT or PIK3R1c.1699A>G, c.1703C>T variant, treated with either vehicle or alpelisib. In all experiments, cells were stimulated with recombinant human IGF-1 (10 ng/mL) for 30’. Graphs show mean ± SEM from 3 biological replicates in each group. P-values were obtained from two-way ANOVAs; exact p-values for P-AKT/α-tubulin are: p = 8.11 × 10−9 when comparing PIK3R1c.1699A>G, c.1703C>T (DMSO) and PIK3R1WT (DMSO), p = 1.12 × 10−5 when comparing PIK3R1c.1699A>G, c.1703C>T (alpelisib 1 µM) and PIK3R1c.1699A>G, c.1703C>T (DMSO). Source data are available online for this figure.
Figure 2
Figure 2. p110α colocalizes with p85α in HeLa cells transfected with PIK3R1 variants.
(A) Western Blot and quantification of p110α levels in HeLa cells transfected with plasmids encoding PIK3R1WT, PIK3R1c.1735_1740del or PIK3R1c.1372_1373dupAAA. Graphs show mean ± SEM from 4 biological replicates in each group. P-values were obtained from two-way ANOVAs. (B) Western blot and quantification of p110α levels in HeLa cells transfected with plasmids encoding PIK3R1WT or PIK3R1c.1699A>G, c.1703C>T. Graphs show mean ± SEM from 3 biological replicates in each group. P-values were obtained from two-way ANOVAs. (C) Colocalization studies of p110α and p85α. Representative slice images of p110α, p85α and their colocalization mask in HeLa cells transfected with plasmids containing either PIK3R1WT, PIK3R1c.1735_1740del, PIK3R1c.1372_1373dupAAA, or PIK3R1c.1699A>G, c.1703C>T variants. Graph shows mean ± SEM from, respectively, 8, 17, 11, 7, or 6 biological replicates in each group. P-values were obtained from a one-way ANOVA: the exact p-value obtained when comparing PIK3R1c.1699A>G, c.1703C>T and PIK3R1WT is p = 1.89 × 10−9. Source data are available online for this figure.
Figure 3
Figure 3. PRAS40, but not mTORC1 effectors, is phosphorylated in HeLa cells transfected with PIK3R1 variants and responds to alpelisib.
(A) Western blot and quantification of phosphorylation levels of AKT target PRAS40, and mTORC1 targets p70S6K and 4eBP1 in HeLa cells transfected with plasmids coding for either PIK3R1WT, PIK3R1c.1735_1740del or PIK3R1c.1372_1373dupAAA variants. Graphs show mean ± SEM from 3 biological replicates in each group. P-values were obtained from two-way ANOVAs; exact p-values for P-PRAS40/α-tubulin are: p = 1.34 × 10−5 when comparing PIK3R1c.1735_1740del (DMSO) and PIK3R1WT (DMSO), p = 7.89 × 10−5 when comparing PIK3R1c.1735_1740del (alpelisib 0.1 µM) and PIK3R1c.1735_1740del (DMSO), p = 4.22 × 10−6 when comparing PIK3R1c.1735_1740del (alpelisib 1 µM) and PIK3R1c.1735_1740del (DMSO) and p = 7.37 × 10−5 when comparing PIK3R1c.1372_1373dupAAA (alpelisib 1 µM) and PIK3R1c.1372_1373dupAAA (DMSO). (B) Western blot and quantification of phosphorylation levels of PRAS40, p70S6K and 4eBP1 in HeLa cells transfected with plasmids coding for either PIK3R1WT or PIK3R1c.1699A>G, c.1703C>T variant. Graphs show mean ± SEM from 3 biological replicates in each group. P-values were obtained from two-way ANOVAs. Source data are available online for this figure.
Figure 4
Figure 4. Alpelisib improves the condition of patients with PIK3R1 variants.
(A) Representative pictures of the morphological changes observed in patient 1 receiving alpelisib for 12 months. (B) Pain visual analog score. Graph shows mean ± SEM from 3 patients. P-values were obtained from a Friedman test. (C) Fatigue score. Graph shows mean ± SEM from 3 patients. No statistical difference was seen between timepoints according to a Friedman test. (D) Coronal T2 with fat saturation MRI and 3D segmentation of vascular malformations observed in patient 1 before and after alpelisib introduction. (E) Percentage change of the volume of vascular malformations in the 3 patients. P-values were obtained from a Friedman test. (F) D-Dimer levels before and following alpelisib introduction. Graph shows longitudinal data from 3 patients and normal laboratory values. (G) Representative pictures of the morphological changes observed in patient 2 receiving alpelisib for 12 months. (H) Coronal T2 with fat saturation MRI and 3D segmentation of vascular malformations observed in patient 2 before and after alpelisib introduction. (I) Representative pictures of the morphological changes observed in patient 3 receiving alpelisib for 12 months. (J) Axial T2 with fat saturation MRI and 3D segmentation of vascular malformations observed in patient 3 before and after alpelisib introduction. Source data are available online for this figure.
Figure EV1
Figure EV1. Double mutant in cis is associated with a strong stimulation of P-AKT compared to single mutants.
Western blot and quantification of AKT phosphorylation on residue Ser473 and S6RP in HeLa cells transfected with plasmids containing either GFP, PIK3R1WT, PIK3R1c.1699A>G, PIK3R1 c.1703C>T or PIK3R1c.1699A>G, c.1703C>T variants. In all experiments, cells were stimulated with recombinant human IGF-1 (10 ng/mL) for 30’. Graphs show mean ± SEM from 3 biological replicates in each group. P-values were obtained from two-way ANOVAs; exact p-values for P-AKTS473/tubulin are p = 9.35 × 10−5 when comparing PIK3R1c.1699A>G, c.1703C>T and PIK3R1WT; p = 7.30 × 10−5 when comparing PIK3R1c.1699A>G, c.1703C>T and PIK3R1c.1703C>T. Exact p-values for P-AKTS473/total AKT are p = 1.17 × 10−5 when comparing PIK3R1c.1699A>G, c.1703C>T and PIK3R1WT; p = 1.09 × 10−5 when comparing PIK3R1c.1699A>G, c.1703C>T and PIK3R1c.1703C>T Source data are available online for this figure.
Figure EV2
Figure EV2. 3D modeling of PI3Kα resulting from the dimerization of wild-type p110α with the different p85α mutants.
Left panel: 3D structures of PI3Kα containing wild-type p110α and either wild-type p85α or variants (c.1735_1740del, c.1372_1373dupAAA or c.1699A>G, c.1703C>T), as predicted by AlphaFold3 and formatted with the PyMOL software. The resulting 3D model of each variant was superimposed to that of wild-type PI3Kα for comparison. Root mean square deviation (RMSD) values are shown for each mutant compared to the wild-type dimer. Right panel: Predicted aligned error graphs obtained from AlphaFold3 show high reliability of the predicted models regarding the position of the iSH2 domain of p85α (approx. residues 448 to 672) relative to the p110α subunit (approx. residues 896 to 1792). Interface predicted template modeling (ipTM) scores show highly reliable positioning of the two subunits in the predicted dimers. Source data are available online for this figure.
Figure EV3
Figure EV3. Phosphorylation profiles of AKT targets identify a 40 kDa effector sensitive to alpelisib in cells transfected with PIK3R1 variants.
(A) Western Blot of proteins phosphorylated on RXXS*/T* residues in HeLa cells transfected with plasmids encoding PIK3R1WT, PIK3R1c.1735_1740del or PIK3R1c.1372_1373dupAAA. (B) Western Blot of proteins phosphorylated on RXXS*/T* residues in HeLa cells transfected with plasmids encoding PIK3R1WT or PIK3R1c.1699A>G, c.1703C>T. In both cases, the phosphorylation levels of a 40 kDa protein increase in cells transfected with PIK3R1 variants and decrease upon treatment with alpelisib. Source data are available online for this figure.
Figure EV4
Figure EV4. Patients had normal platelets counts and fibrinogen throughout alpelisib treatment.
(A) Platelet counts before and following alpelisib introduction. Graph shows longitudinal data from 3 patients and normal laboratory values. No statistical difference was seen between timepoints according to a Friedman test. (B) Fibrinogen levels before and following alpelisib introduction. Graph shows longitudinal data from 3 patients and normal laboratory values. No statistical difference was seen between timepoints according to a Friedman test. Source data are available online for this figure.

References

    1. Abramson J, Adler J, Dunger J, Evans R, Green T, Pritzel A, Ronneberger O, Willmore L, Ballard AJ, Bambrick J et al (2024) Accurate structure prediction of biomolecular interactions with AlphaFold 3. Nature 630:493–500 - PMC - PubMed
    1. Andre F, Ciruelos E, Rubovszky G, Campone M, Loibl S, Rugo HS, Iwata H, Conte P, Mayer IA, Kaufman B et al (2019) Alpelisib for PIK3CA-mutated, hormone receptor-positive advanced breast cancer. N Engl J Med 380:1929–1940 - PubMed
    1. Backer JM (2010) The regulation of class IA PI 3-kinases by inter-subunit interactions. Curr Top Microbiol Immunol 346:87–114 - PMC - PubMed
    1. Bayard C, Segna E, Taverne M, Fraissenon A, Hennocq Q, Periou B, Zerbib L, Ladraa S, Chapelle C, Hoguin C et al (2023) Hemifacial myohyperplasia is due to somatic muscular PIK3CA gain-of-function mutations and responds to pharmacological inhibition. J Exp Med 220:e20230926 - PMC - PubMed
    1. Canaud G, Gutierrez JCL, Irvine AD, Vabres P, Hansford JR, Ankrah N, Branle F, Papadimitriou A, Ridolfi A, O’Connell P et al (2023a) Alpelisib for treatment of patients with PIK3CA-related overgrowth spectrum (PROS). Genet Med 25:100969 - PubMed

Publication types

LinkOut - more resources