. 2025 Jul;17(7):1686-1715.
doi: 10.1038/s44321-025-00252-0. Epub 2025 May 19.

Uncovering biomarkers for chronic toxoplasmosis detection highlights alternative pathways shaping parasite dormancy

Affiliations

Uncovering biomarkers for chronic toxoplasmosis detection highlights alternative pathways shaping parasite dormancy

Marie G Robert et al. EMBO Mol Med. 2025 Jul.

Abstract

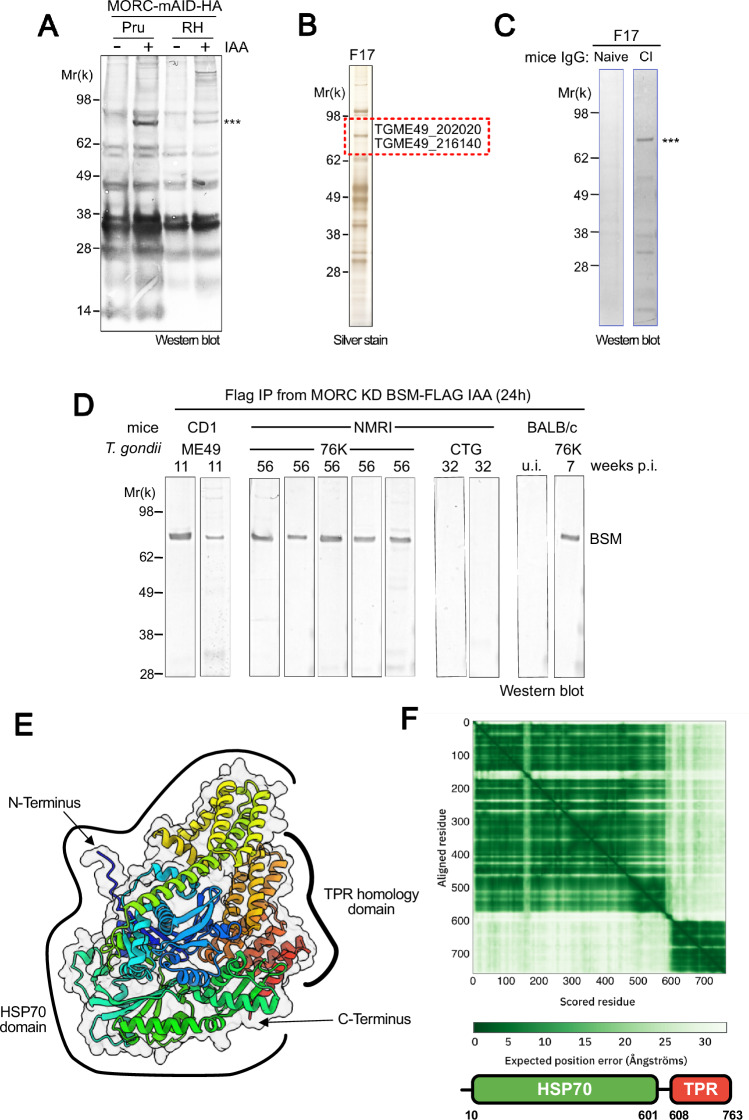
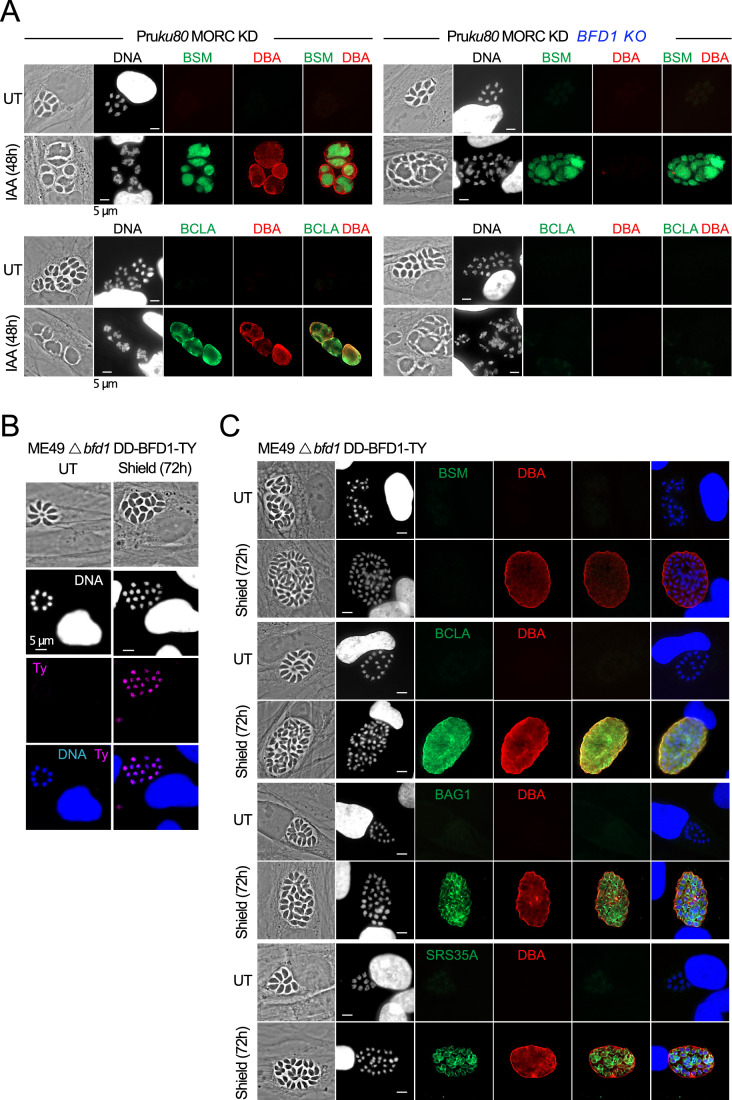
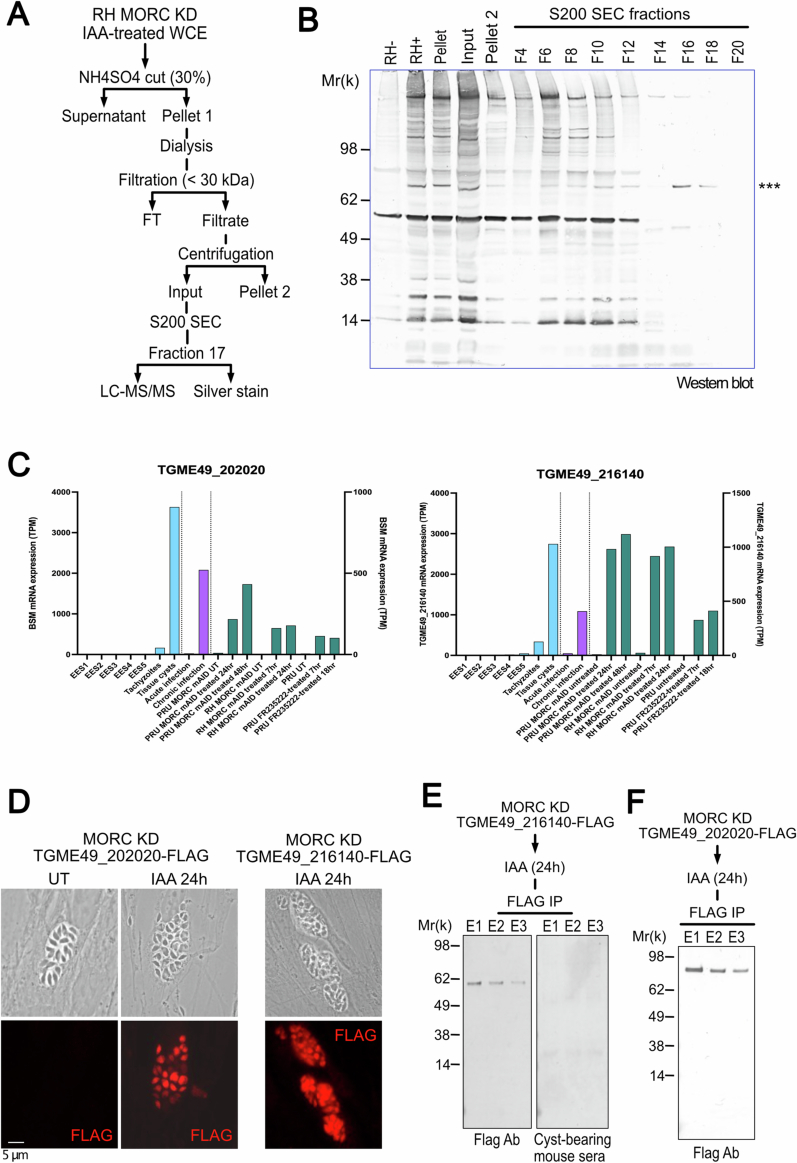
Toxoplasma gondii, a neurotropic protozoan, causes toxoplasmosis, a prevalent zoonotic and food-borne infection, posing significant risks to immunocompromised individuals and congenital cases. The chronic phase, characterized by dormant, cyst-forming bradyzoites, is central to disease progression but is poorly understood due to the lack of serological tests to detect bradyzoite-specific antigens. This study identifies the bradyzoite serological marker (BSM) and cyst-associated BCLA as effective biomarkers for chronic toxoplasmosis. These markers showed high sensitivity and specificity in detecting cyst-bearing mice and had a positivity rate of 30% in humans with prior immunity. Bradyzoite serology helps to discriminate between recent and past infections, with BCLA improving the accuracy of the diagnosis of congenital infections. Mechanistic analyses show that the chromatin modifiers MORC and HDAC3 epistatically regulate BFD1, a key bradyzoite regulator. While BFD1 controls the expression of bradyzoite genes such as BCLA, a specific subset, including BSM, is regulated independently of BFD1. This multilayered regulation complicates the understanding of parasite persistence in humans, but offers promise for improved serologic diagnosis during pregnancy, but also in individuals with mental illness.

Keywords: Toxoplasma gondii; Bradyzoite; Epigenetics; Serology; Transcription.


Conflict of interest statement

Disclosure and competing interests statement. MAH, CD, CS, HP, and MPBP are co-inventors of patent PCT/EP2020/081638, covering the use of BCLA as a biomarker for diagnosing chronic toxoplasmosis in humans. MAH, MGR, CS, and MPBP are also co-inventors of a related patent application on using BSM for the same purpose (patent EP24307283.2). Inserm and its subsidiary, Inserm-Transfert, are involved in the patent application. The remaining authors declare no competing interests.

Figures

Figure 1
Figure 1. Discovery of bradyzoite-specific immunogenic proteins in MORC knockdown extracts.
(A) Western blot membranes from IAA-treated and untreated extracts were probed with antibodies from mice chronically infected with cystogenic T. gondii strains. Results were consistent across replicates, and a representative blot is shown. (B) Silver staining of fraction 17 (F17) from S200 gel filtration chromatography (full column fractions shown in Fig. EV1B). (C) Western blot of F17 probed with sera from naive mice and mice chronically infected with T. gondii. (D) BSM was immunopurified using anti-Flag antibodies, and Western blots of the purified protein were probed with sera from chronically infected mice bearing T. gondii cysts (CD1 infected with ME49, NMRI, and BALB/c infected with 76 K) or from NMRI mice infected with the cyst-free strain CTG. (E) Alphafold model of the BSM protein (generated via the EBI/Alphafold server), displayed as a cartoon and color-coded from the N-terminal (blue) to the C-terminal (red). (F) Alphafold position error heatmap illustrating the predicted subdomains of BSM. Source data are available online for this figure.
Figure 2
Figure 2. MORC and HDAC3 regulate the expression of bradyzoite markers BSM and BCLA, along with the transcription factor BFD1.
(A) Expression of BSM (green) following MORC KD in the type II strain. The cells were co-stained with DBA lectin (red) and DNA-specific Hoechst dye (white). Scale bar = 5 μm. (B) The expression levels of BSM and BCLA in 76 K WT or Δbsm strains were assessed by IFA following HDAC3 inhibition with FR235222. Scale bar = 5 μm. (C) BSM (in red) was identified by IFA on a cyst in a brain histological section from a mouse chronically infected with the type II strain (76 K). The cells were co-stained with DNA-specific Hoechst dye (white or blue). (D) UMAP projection of Pru tachyzoite and bradyzoite scRNA experiment (Xue et al, 2020). P1 population corresponds to the bradyzoite-specific cluster. (E) Expression of BFD1 (red) following HDAC3 inhibition by FR235222 (upper panel) or MORC KD (lower panel). The cells were co-stained with GAP45 (green) and DNA-specific Hoechst dye (white or blue). (F) Time-course analysis of the expression levels of BFD1 following inhibition of HDAC3. The samples were taken at the indicated time periods after the addition of FR235222 and were probed with antibodies against HA and HDAC3 as well as bradyzoite proteins BCLA and BSM. The same experiment was repeated three times, and a representative blot is shown. Source data are available online for this figure.
Figure 3
Figure 3. MORC/HDAC3 operates upstream of BFD1, which regulates BCLA expression but not BSM.
(A) IFA of BSM (in green, top panel) and BCLA (in green, bottom panel) expression in wild-type and BFD1 KO strains under a MORC KD background, either untreated or treated with IAA for 48 h. The cells were co-stained with DBA lectin (red) and DNA-specific Hoechst dye (white). Scale bar = 5 μm. (B) IFA of BFD1 (red) in a strain expressing a regulatable BFD1 protein (ΔBFD1/DD-BFD1-Ty) with and without Shield-1 treatment. Cells were co-stained with DNA-specific Hoechst dye (white or blue). Scale bar = 5 μm. (C) IFA of BSM, BCLA, BAG1, and SRS35A expression (green) in ΔBFD1/DD-BFD1-Ty strains, either untreated or stimulated with Shield-1 for 72 h. Cells were co-stained with DBA lectin (red) and Hoechst dye (white or blue) for DNA visualization. Scale bar = 5 μm. Source data are available online for this figure.
Figure 4
Figure 4. MORC exerts epistatic control over BFD1, which regulates a subset of the bradyzoite transcriptome.
(A) Principal Component Analysis (PCA) of mRNA sequencing data from biological triplicates of MORC KD or MORC KD/BFD1 KO parasites. Samples were collected from untreated conditions or after 24 h of IAA treatment. (B) Heatmap showing hierarchical clustering analysis of selected bradyzoite-specific mRNA transcripts, which were significantly upregulated (log2[FC] > 2; P value < 0.05) following the depletion MORC in both MORC KD or MORC KD/BFD1 KO genetic background. The abundance of these transcripts is presented across different in vivo stages—merozoites, EES1–EES5 stages, tachyzoites, sporozoites and cysts—as documented in previous studies (Antunes et al, ; Farhat et al, 2020). Pertinent examples of BFD1-dependent and independent genes are highlighted in green and violet, respectively. (C) MA plots display Log2(FC) against Log2(mean expression) for genes comparing MORC KD to MORC KD/BFD1 KO after IAA treatment, using DESeq2. BFD1-dependent genes are shown in green. (D) ChIP-seq. (E) ATAC-seq. (F, G) Integrated Genome Browser (IGB) screenshots of representative bradyzoite genes displaying ChIP-seq signal for MORC (HA antibody, green) in MORC KD strains under untreated and IAA-treated conditions. ATAC-seq profiles for both conditions, showing Tn5 transposase accessibility with read density on the y axis, are included. Nanopore DRS data for MORC KD and MORC KD/BFD1 KO strains, untreated and IAA-treated, are also shown. Examples include BFD1-dependent (F) and BFD1-independent genes (G).
Figure 5
Figure 5. Bradyzoite serology with BSM and BCLA accurately detects cyst-carrying mice.
(A) NMRI mice (n = 15) were injected intraperitoneally with 5.104 tachyzoites of the 76K-GFP-luc WT or Δbsm strains, and their survival was monitored. Statistical analysis using log-rank Mantel–Cox and Gehan–Breslow–Wilcoxon tests showed no significant difference (P = 0.3496). (B) Microscopy analysis of cyst morphology in homogenized brain suspensions from mice infected with 76K-GFP-luc and Δbsm strains. Over 20 cysts were examined per strain, and representative images are presented. (C, D) Parasitic loads in parasite per brain (qPCR count) and expression levels of miR-155 and miR-146a were assessed in mice infected by 76 K WT (n = 7) versus 76 K Δbsm (n = 7). Statistical significance was calculated using a nonparametric Mann–Whitney test. (E) Parasitic loads (parasites per brain, quantified by qPCR) were measured in mice (n = 74) of various backgrounds (NMRI, Balb/C, CD1) infected with cystogenic strains (76 K, ME49; in red), low cystogenic strains (CTG, Pruku80; in green), 76 K Δbsm (in blue), and 76 K or Pruku80 Δbcla (in purple). (F) BSM and BCLA ELISA serology in mice (n = 83) is shown using the same color coding as in panel (E). Statistical significance was calculated using a nonparametric Mann–Whitney test. (G) ROC (Receiver Operating Characteristic) curves for BSM ELISA serology (blue) and BCLA ELISA serology (purple). ROC curves are graphical representations that evaluate the diagnostic performance of a test by plotting the true positive rate (sensitivity) against the false positive rate (1 − specificity) at various thresholds. (CF) The error bars indicate the standard error of the mean (SEM). Source data are available online for this figure.
Figure 6
Figure 6. Bradyzoite-specific serology in human sera.
(A) BSM ELISA serology and (B) BCLA ELISA serology results in seronegative individuals (n = 134, blue bars) and previously immunized patients with T. gondii infection (n = 222, red bars), grouped by clinical context (grid-patterned bars). Statistical significance was evaluated using a nonparametric Mann–Whitney test. (C) Receiver operating characteristic (ROC) curves for BSM ELISA (blue) and BCLA ELISA (purple), illustrating diagnostic performance. (D) BSM and BCLA ELISA serology titers during past infections (pink bars) and acute infections (green bars). Statistical comparisons were performed using a nonparametric Mann–Whitney test. (E) BSM and BCLA ELISA serology titers in newborns from mothers who seroconverted during pregnancy. Results are shown for children diagnosed with congenital toxoplasmosis (CT, n = 15, green bars) and those where CT was excluded (n = 11, orange bars). Statistical significance was calculated using a nonparametric Mann–Whitney test. Source data are available online for this figure.
Figure EV1
Figure EV1. Identification of BSM in the MORC-depleted bradyzoite-enriched proteome.
(A) Purification scheme. MORC-depleted extract was fractionated by chromatography as described in the Methods section. (B) Western blot analysis of the initial purification steps and S200 gel filtration fractions (F), using serum from an NMRI mouse chronically infected with the 76 K cystogenic strain of Toxoplasma gondii. (C) Histogram showing the expression levels of BSM (TGME49_202020) and TGME49_216140 following MORC depletion or HDAC3 inhibition with FR235222. Transcript abundance is also displayed across various in vivo stages, including merozoites, EES1–EES5 stages, tachyzoites, sporozoites, and cysts. (D) The MORC KD strain was modified to express BSM or the protein encoded by TGME49_216140 with a C-terminal HA-Flag tag. Expression was assessed by IFA in untreated or IAA-treated parasites (24 h). Chimeric proteins were detected using FLAG staining (red). (E, F) FLAG immunoprecipitation eluates (E) of TGME49_216140 (E) or BSM (F) were probed with cyst-bearing mouse sera and/or FLAG antibodies.
Figure EV2
Figure EV2. MORC regulome and BSM serology.
(A) MA plots display Log2(FC) against Log2(mean expression) for genes before and after MORC depletion, using DESeq2. Upregulated genes (log2[FC] > 1, P value < 0.05) are blue, downregulated (log2[FC] < -0.58, P value < 0.05) are green. (B) IGB screenshots of representative genes expressed in merozoite (GRA81) or in merozoite/bradyzoite (BRP1) displaying ChIP-seq signal for MORC (HA antibody, green) in MORC KD strains under untreated and IAA-treated conditions. ATAC-seq profiles for both conditions, showing Tn5 transposase accessibility with read density on the y axis, are included. Nanopore DRS data for MORC KD and MORC KD/BFD1 KO strains, untreated and IAA-treated, are also shown. (C) The effects of deletion of BSM on the lytic cycle were determined by plaque assay. After 7 days, the cells were fixed and stained with Coomassie blue to detect the presence of plaques (top panel). Graphs below show the distribution of the size of visible plaques (n = 50 per condition). Statistical analyses were performed using Mann–Whitney test. (D) LDBIO TOXO II IgG western blot membranes were probed with sera from NMRI mice 8 weeks post-infection with the 76 K wild-type strain (n = 6; two sera were insufficient) or ΔBSM (n = 7; one mouse died before 8 weeks). A test is considered positive if at least three of the 30, 31, 33, 40, and 45 kDa bands are present, including the 30 kDa band.
Figure EV3
Figure EV3. Recombinant BSM purification steps.
(A) Nickel-nitrilotriacetic (Ni-NTA) elution. SDS-PAGE electrophoresis of total (T), soluble (S), flow though (Ft) and elution fractions 3 (E3) and 6 (E6). The black arrow points to the recombinant BSM protein. (B) Size Exclusion Chromatography using a S200 (10/300 Gl) combined to a Multi-Angle Laser Light Scattering analysis. Absorbance values are shown in deep blue while the predicted molecular weight plot (Mw) is displayed in light blue. (C) Schematic representation of rBCLA (1st generation of the antigen) and miniBCLA (this work) proteins. (D) Size exclusion chromatography of the purified miniBCLA antigen, 280 mm absorbance is shown as a function of volume. Peak elution fractions F5 to F10 were analyzed by Coomassie blue stained 4–12% NuPAGE.

References

    1. Antunes AV, Shahinas M, Swale C, Farhat DC, Ramakrishnan C, Bruley C, Cannella D, Robert MG, Corrao C, Couté Y et al (2024) In vitro production of cat-restricted Toxoplasma pre-sexual stages. Nature 625:366–376 - PMC - PubMed
    1. Ben-Harari RR, Connolly MP (2019) High burden and low awareness of toxoplasmosis in the United States. Postgrad Med 131:103–108 - PubMed
    1. Bigna JJ, Tochie JN, Tounouga DN, Bekolo AO, Ymele NS, Youda EL, Sime PS, Nansseu JR (2020) Global, regional, and country seroprevalence of Toxoplasma gondii in pregnant women: a systematic review, modelling and meta-analysis. Sci Rep 10:12102 - PMC - PubMed
    1. Boillat M, Hammoudi P-M, Dogga SK, Pagès S, Goubran M, Rodriguez I, Soldati-Favre D (2020) Neuroinflammation-associated aspecific manipulation of mouse predator fear by Toxoplasma gondii. Cell Rep 30:320–334.e6 - PMC - PubMed
    1. Bougdour A, Durandau E, Brenier-Pinchart MP, Ortet P, Barakat M, Kieffer S, Curt-Varesano A, Curt-Bertini RL, Bastien O, Coute Y, Pelloux H, Hakimi MA (2013) Host cell subversion by Toxoplasma GRA16, an exported dense granule protein that targets the host cell nucleus and alters gene expression. Cell Host Microbe 13:489–500 - PubMed