. 2025 Jun;10(6):1463-1483.
doi: 10.1038/s41564-025-02017-4. Epub 2025 May 19.

The fast-evolving FIKK kinase family of Plasmodium falciparum can be inhibited by a single compound

Affiliations

The fast-evolving FIKK kinase family of Plasmodium falciparum can be inhibited by a single compound

Hugo Belda et al. Nat Microbiol. 2025 Jun.

Abstract

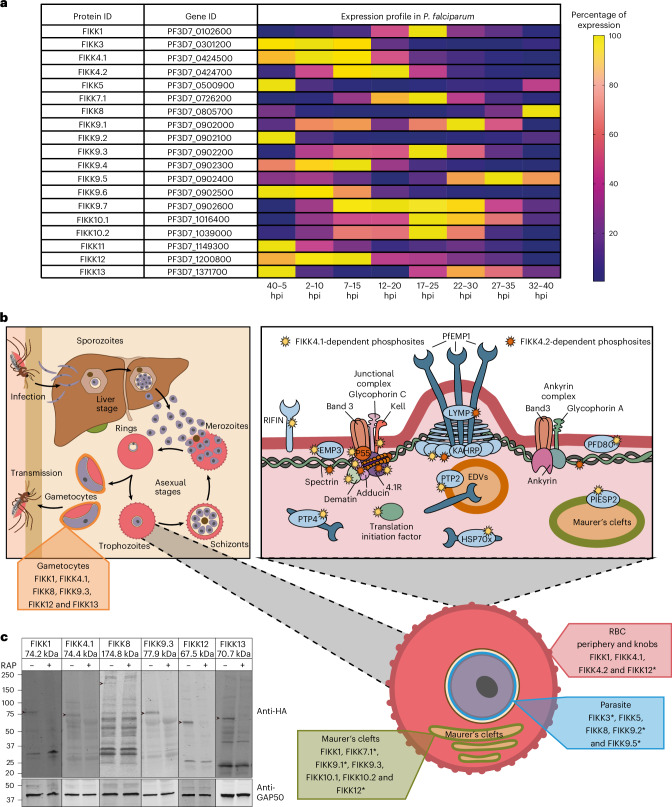
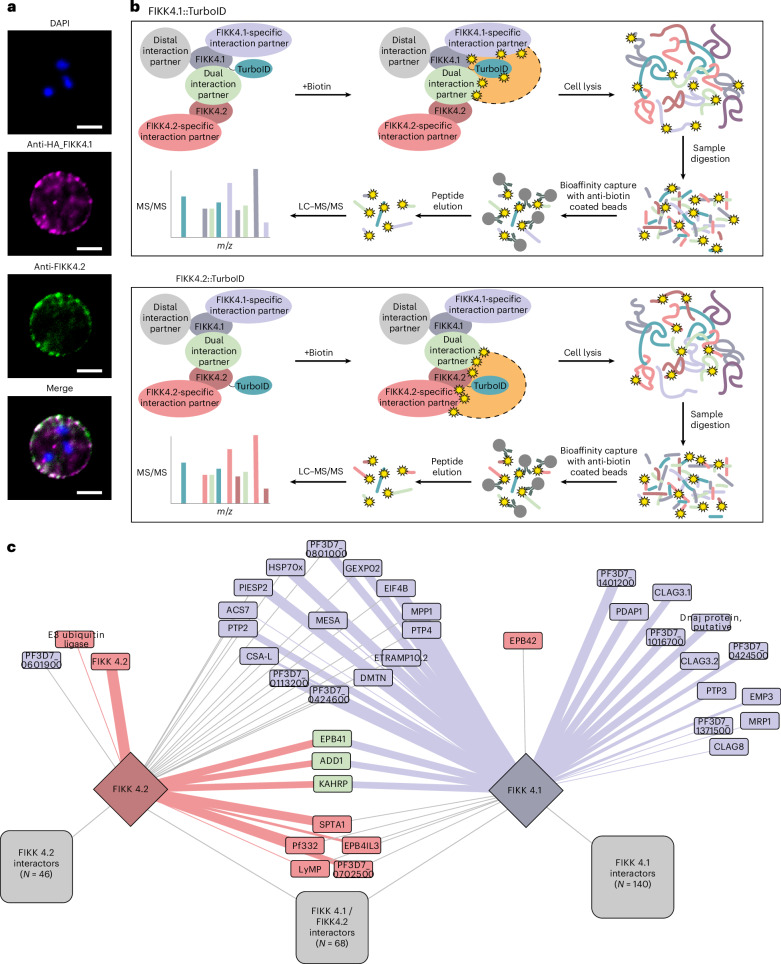
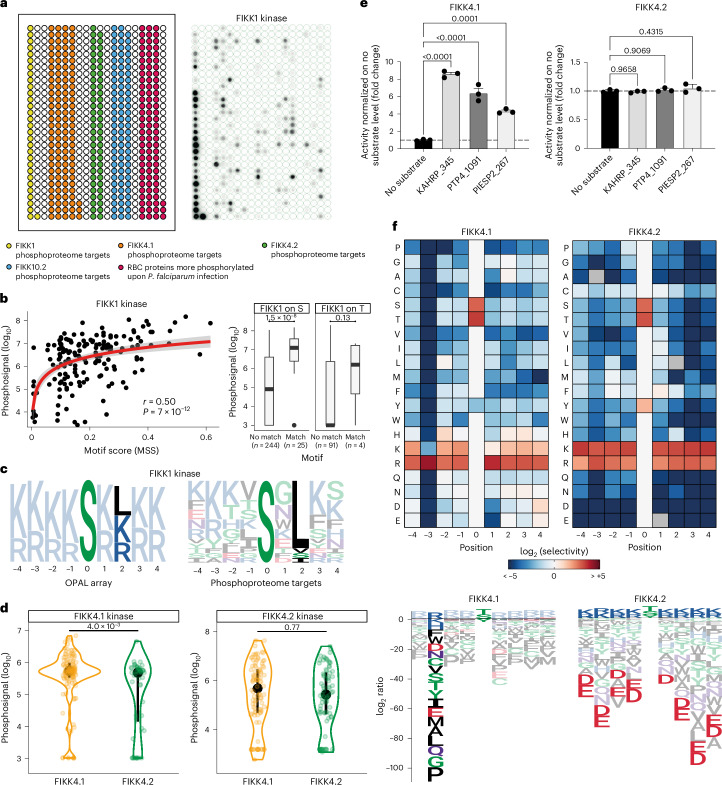
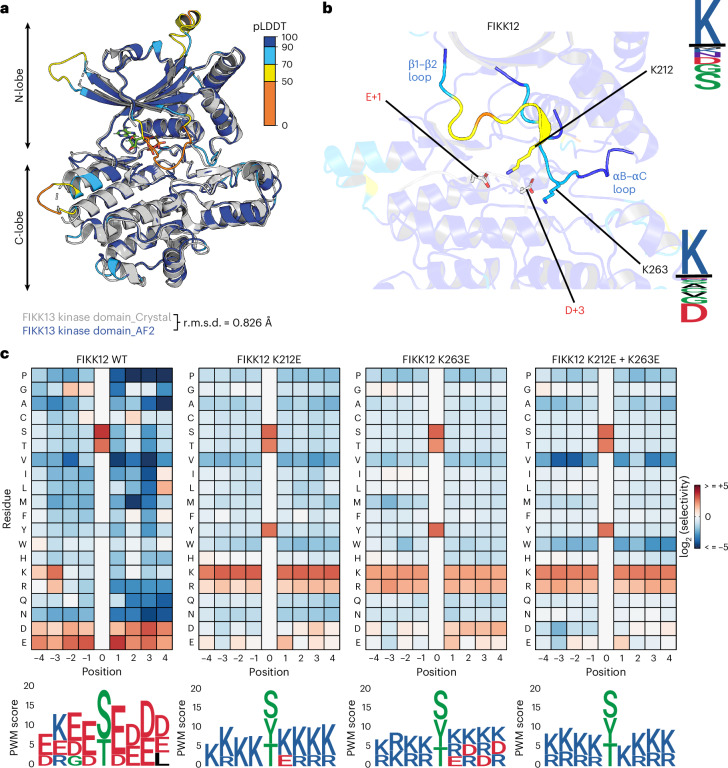
Of 250 Plasmodium species, 6 infect humans, with P. falciparum causing over 95% of 600,000 annual malaria-related deaths. Its pathology arises from host cell remodelling driven by over 400 exported parasite proteins, including the FIKK kinase family. About one million years ago, a bird-infecting Plasmodium species crossed into great apes and a single non-exported FIKK kinase gained an export element. This led to a rapid expansion into 15-21 atypical, exported Ser/Thr effector kinases. Here, using genomic and proteomic analyses, we demonstrate FIKK differentiation via changes in subcellular localization, expression timing and substrate motifs, which supports an individual important role in host-pathogen interactions. Structural data and AlphaFold2 predictions reveal fast-evolving loops in the kinase domain that probably enabled rapid functional diversification for substrate preferences. One FIKK evolved exclusive tyrosine phosphorylation, previously thought absent in Plasmodium. Despite divergence of substrate preferences, the atypical ATP binding pocket is conserved and we identified a single compound that inhibits all FIKKs. A pan-specific inhibitor could reduce resistance development and improve malaria control strategies.


Conflict of interest statement

Competing interests: The authors declare no competing interests.

Figures

Fig. 1
Fig. 1. Expression timings and localizations of P.falciparum FIKK kinases.
a, A heat map built using data from Hoeijmakers et al. RNA-sequencing dataset available on PlasmoDB (www.PlasmoDB.org), showing the percentage expression for each FIKK during the P.falciparum asexual replication cycle. Yellow, maximum expression; dark blue, minimum expression. The TPM values used to calculate the percentage expression relative to maximum expression across the 48 h lifecycle are available in Supplementary Table 2. b, A diagram illustrating P.falciparum FIKKs expression and localizations in iRBCs. Top left: an illustration of the P.falciparum lifecycle. FIKK1, FIKK4.1, FIKK8, FIKK9.3, FIKK12 and FIKK13 expressed in gametocytes are shown in orange. Bottom right: P.falciparum iRBC showing the localization of the FIKKs. Blue, FIKK3, FIKK5, FIKK8, FIKK9.2 and FIKK9.5 in the parasite; green, FIKK1, FIKK7.1, FIKK9.1, FIKK9.3, FIKK10.1, FIKK10.2 and FIKK12 in Maurer’s clefts; red, FIKK1, FIKK4.1, FIKK4.2 and FIKK12 at the RBC periphery. *Localization data from publications from other laboratories. Top right: knob structure at the RBC periphery. Yellow stars show FIKK4.1 substrates and orange stars show FIKK4.2 substrates (data from ref. ). EDVs, electron dense vesicles. c, Western blots confirming expression of HA-tagged P.falciparum FIKKs in gametocytes stage III. GAP50 antibody (bottom) demonstrates equal loading. The arrows show FIKK bands at expected sizes (shown in the labels at the top). +Rapamycin treatment. Source data.
Fig. 2
Fig. 2. Investigation of FIKK4.1 and FIKK4.2 local protein environment.
a, The subcellular localization of FIKK4.1 and FIKK4.2 investigated by immunofluorescence assay using anti-HA antibodies (magenta) targeting the C-terminally HA-tagged FIKK4.1 and anti-FIKK4.2 antibodies (green). DAPI (blue) is used for nuclear staining. Scale bars, 5 µm. The assay was performed three times with similar results. b, A diagram representing the proximity labelling workflow. FIKK4.1 (top) and FIKK4.2 (bottom) were tagged with a TurboID biotin ligase. Upon addition of biotin, proteins in the vicinity (represented by an orange area with a dashed outline) of the bait are biotinylated on lysine residues (represented by yellow stars). iRBCs were lysed in 8 M urea in 50 mM HEPES and proteins were trypsin digested into peptides. Biotinylated peptides were enriched using beads coated with two different anti-biotin antibodies and analysed by LC–MS/MS. c, A network analysis of FIKK4.1 and FIKK4.2::TurboID data. The connecting lines indicate a protein that is probably in the vicinity of the TurboID-tagged protein. Blue depicts proteins identified as potential FIKK4.1 direct targets in ref. . Red depicts proteins that have been identified as potential FIKK4.2 direct targets, and green depicts proteins identified as potential targets of both FIKK4.1 and FIKK4.2. The thickness of the connection represents how well the phosphorylation site matches the corresponding in vitro preferred phosphorylation motifs (of FIKK4.1 or FIKK4.2) from Supplementary Fig. 3.
Fig. 3
Fig. 3. FIKK kinases evolved divergent substrate specificities conserved among Laverania species.
a, Extended Data Fig. 3 data represented as a heat map (i). The 32P incorporation values were normalized to 20 (the number of possible natural amino acids) and are shown as log2(x) where negative values (blue cells) indicate disfavoured amino acids and positive values (red cells) indicate favoured amino acids. A PWM logo generated with FIKK8 raw OPAL data (ii). PWMs depict the preference of the kinase for all 20 amino acids at every substrate position. For ease of visualization, the PWM logo displays amino acids with scores above an arbitrary threshold of 2.5 (Methods). Amino acid colours are set as follows: acidic negatively charged (D, E), red; basic positively charged (R, K, H), blue; polar uncharged (N, Q), purple; non-polar (A, I, L, M, F, V, P), black; phosphorylatable or special (S, T, Y, C, G), green. b, A heat map representation of OPAL data for basophilic FIKK1 (left), acidophilic FIKK9.1 (middle) and tyrosine kinase FIKK13 (right). PWM logos generated from raw OPAL data are displayed below the corresponding heat maps. OPAL membrane images are available in Supplementary Fig. 5. c, PWM logos generated with PgFIKKs raw OPAL data. See a(i) caption and Supplementary Fig. 6. d, A maximum-likelihood phylogenetic tree of Laverania FIKK sequences built using FIKK8 kinases and two avian malaria FIKKs (P.relictum FIKK PRELSG_0112400 and P.gallinaceum FIKK PGAL8A_00108200) as an outgroup. One hundred bootstrap replicates were generated to assess branch support. All orthologue clades have maximum branch support (one out of one). Branches between paralogues are highlighted in red if they are >0.5. The triangle length represents the divergence between FIKK sequences within a specific clade. The colour code identifies the kinases substrate specificities as follows: blue, basophilic; red, acidophilic; purple, tyrosine kinase; white, uncharacterized. Sequence logos for each clade are given for the P.falciparum kinase copy. The tree contains N = 131 sequences in total.
Fig. 4
Fig. 4. Investigation of FIKK1, FIKK4.1 and FIKK4.2 substrate specificities.
a, Left: a representation of FIKK phosphoproteome peptides membrane, each dot represents one target-peptide species. Yellow, FIKK1 targets; orange, FIKK4.1 targets; green, FIKK4.2 targets; blue, FIKK10.2 targets; red, host cell peptides phosphorylated in iRBCs. The list of peptides with sequences is provided in Supplementary Table 10. Right: FIKK1 activity on the phosphoproteome peptides membrane. b, Left: correlation of FIKK1 activity on the phosphoproteome peptides membrane (log10 transformed) against FIKK1 motif score (matrix similarity score) for each peptide (n = 163). Pearson’s correlation for the y = log(x) curve. Right: FIKK1 phosphorylation signal (Phosphosignal) (log10 transformed) for peptides with or without matching FIKK1 motif, for peptides with an S (n = 269, Cohen’s D = 1.2, P = 1.5 × 10−8, Wilcoxon test, one sided) or T phosphoacceptor (n = 95, Cohen’s D = 0.57, P = 0.13, Wilcoxon test, one sided). The centre line shows the median, the box limits the upper and lower quartiles, the whiskers show 1.5× the interquartile range and each point indicates an outlier. c, Left: FIKK1 specificity logo derived from the OPAL membrane. Right: FIKK1 specificity logo derived from natural peptides phosphorylated by FIKK1 on the peptide membrane. d, Left: FIKK4.1 activity (log10 transformed) against predicted target peptides of FIKK4.1 (orange) and of FIKK4.2 (green) (n = 174 peptides, Cohen’s D = 0.57, P = 4.0 × 10−3, Wilcoxon test, one sided). Right: FIKK4.2 activity (log10 transformed) against predicted target peptides of FIKK4.1 (orange) and of FIKK4.2 (green) (n = 174 peptides, Cohen’s D = 0.10, P = 0.77, Wilcoxon test, one sided). The black dot shows the median and the black line shows the upper and lower quartiles. e, FIKK4.1 and FIKK4.2 activity on KAHRP_345, PTP4_1091 and PIESP2_267. The results are represented as mean ± s.e.m. fold change compared with the no substrate luminescent signal. Statistical significance was determined using a one-way analysis of variance followed by Dunnett’s multiple comparison post-test (for FIKK4.1, KAHRP_345 versus no substrate, P < 0.0001; PTP4_1091 versus no substrate, P < 0.0001; PIESP2_267 versus no substrate, P = 0.0001; FIKK4.2, KAHRP_345 versus no substrate, P = 0.9658; PTP4_1091 versus no substrate, P = 0.9069; PIESP2_267 versus no substrate, P = 0.4315) (n = 3 biological replicates). f, FIKK4.1 and FIKK4.2 PWM logos made using data from Supplementary Fig. 3. Values are log2 transformed. A positive value depicts favoured amino acids and a negative value depicts disfavoured amino acids. See Fig. 3 caption for the colour code and Supplementary Fig. 8 for log2-transformed PWM logos for all recombinant FIKK tested.
Fig. 5
Fig. 5. Mutating specificity determinant residues identified using FIKK13 D379N structure allows for changes in FIKK substrate specificity.
a, Overlay of FIKK13 D379N kinase domain crystal structure with ATPƔS (grey) and the FIKK13 kinase domain AlphaFold structure prediction coloured according to the residues pLDDT score. The r.m.s.d. was calculated using PyMol. b, A target peptide (EKKASEGDN) of FIKK12 was modelled into the substrate-binding groove of the FIKK12 AlphaFold structure (Methods). The K212 and K263 kinase residues are predicted to bind to the peptide at the +1 and +3 positions. K212 is found on the large β1–β2 loop that is N-terminal to the first β-strand on the kinase N-lobe. Boundaries of the β1–β2 loop lies between residues 202 and 217 (inclusive). K263 is found on the loop between the αB and αC helices (boundaries between residues 257 and 267 (inclusive)). Secondary structure regions are referred to (for reference) in Extended Data Figs. 6 and 10. The sequence logos show the residue conservation between FIKK12 Plasmodium sequences (top), and basophilic Plasmodium sequences (bottom). The FIKK12 kinase domain is coloured according to the pLDDT score, the same as for a. c, FIKK12 WT and FIKK12 mutants phosphorylation activity on OPAL membranes represented as heat maps (see Fig. 3a(i) caption). Below is represented the PWM logos (see Fig. 3a(ii) caption).
Fig. 6
Fig. 6. PKIS library screen allows for the identification of several pan-FIKK kinases inhibitors that target at least one FIKK kinase in ATP-depleted iRBCs.
a, FIKK8 activity in the presence of increasing concentrations of staurosporine analogues (GW272220X, SB-219551, GW442389X, GW471214X, GW470969X and SB-505576). n = 6 technical replicates for each inhibitor. Shown is the mean ± s.e.m. b, A ranked plot showing the results of the PKIS library screen on recombinant FIKK8. A threshold of >75% inhibition was arbitrarily set and identified the 12 most potent PKIS compounds on recombinant FIKK8 kinase domain (n = 2). Each data point represents the mean percentage inhibition in both replicates. c, A SAR assay identifies closely related compounds with different behaviours towards recombinant FIKK8 kinase domain. A total of 333 compounds were identified from the three original PKIS chemical templates. The IC50 on recombinant FIKK8 kinase domain was measured in biological triplicate for each one of the compounds and are indicated here for the selected ones ±s.d. d, A heat map representing inhibition (%) of selected compounds on recombinant FIKK kinase domains (n = 3 biological replicates). e, Western blot showing adducin S726 phosphorylation in RBCs pretreated with 1,228 µM iodoacetamide and 2,046 µM inosine, infected with WT NF54 P.falciparum and treated with different concentrations of either GSK2236790B or GW779439X. The GAP50 antibody demonstrates equal loading. f, Western blot showing adducin S726 phosphorylation in RBCs pretreated with 1,228 µM iodoacetamide and 2,046 µM inosine, infected with FIKK1 conditional knockout (cKO) DMSO-treated P.falciparum and treated with different concentrations of either GSK2236790B or GW779439X. GAPDH antibody demonstrates equal loading. g, Immunofluorescence assays showing adducin S726 phosphorylation and protein export in ATP-depleted iRBC treated with different concentrations of either GSK2236790B or GW779439X. Protein export is investigated with anti-HA antibodies targeting the C-terminal HA-tag fused to FIKK1 kinase domain and with anti-SBP1 antibodies. DAPI (blue) is used as a nuclear staining. Scale bars, 5 µm. The immunofluorescence assays in e, f and g were performed at least three times with similar results. Source data.
Extended Data Fig. 1
Extended Data Fig. 1. Phylogenetic tree of PfFIKK kinases rooted on FIKK8 sequences.
Maximum-likelihood phylogenetic tree of P. falciparum FIKK kinase sequences (see Methods). The tree was rooted using known FIKK8 sequences across Plasmodium species. Branch support was assessed using 100 bootstrap replicates and is shown for branches with support > 0.5. The scale bar represents the number of substitutions per site, that is two sequences separated by this distance have diverged by 0.1 substitutions per site on average.
Extended Data Fig. 2
Extended Data Fig. 2. Alignment of P. falciparum FIKK protein sequences allows for accurate determination of the FIKK kinase domain starting amino acid.
a, Amino acid sequence conservation in P. falciparum FIKKs was assessed using the PRALINE Multiple Sequence Alignment Software. Conservation values reflect the normalised average of BLOSUM62 scores for each alignment column and range from 0 (low conservation) to 10 (high conservation). Sequence position is with respect to P. falciparum FIKK8 as the reference sequence. Green shading illustrates the FIKK kinase domain. The eponymous F-I-K-K motif is represented in red. b, Alignment of all FIKK sequences from P. falciparum including pseudokinases FIKK7.2 and FIKK14 using the T-Coffee multiple sequence alignment program available in the Jalview software. Shown is the alignment for the FIKK kinase domain. FIKK4.2 insertion (residues 381-953) has been removed to simplify visualisation. Encircled in red are the amino acids chosen as a starting point for recombinant expression of P. falciparum FIKK kinase domains. The ClustalX colour scheme was used to assign colour to amino acids with the following criteria: Blue – Hydrophobic (A, I, L, M, F, W, V, C); Red – Positively charged (K, R); Magenta – Negatively charged (D, E); Green – Polar (N, Q, S, T); Orange – Glycine (G); Yellow – Proline (P); Cyan – Aromatic (H, Y); White – unconserved amino acids. Below the alignment is indicated the conservation score which measures the number of physicochemical properties conserved for each column of the alignment. Its calculation is based on. Conserved columns are indicated by * (score of 11), conservation score then ranges between 10 (high conservation) and 0 (no conservation). Hyphens denote gaps.
Extended Data Fig. 3
Extended Data Fig. 3. FIKK8 OPAL membrane.
An OPAL membrane constituted of 9-mer peptides with the general sequences A-X-X-X-X-S-X-X-X-X-A (top panel), A-X-X-X-X-T-X-X-X-X-A (middle panel) or A-X-X-X-X-Y-X-X-X-X-A (bottom panel) was used to assess FIKK8 preferred phosphorylation motif. X represents any natural amino acid except for S, T, Y or C. For each peptide, one of the 20 naturally occurring amino acids is fixed at each one of the 8 positions surrounding the phosphorylatable residue (S, T or Y). The membrane was incubated in the presence of recombinant FIKK8 kinase domain and [ɣ-32P]-ATP. After several washes, the membrane was exposed overnight to a phosphorscreen. The radioactivity incorporated into each peptide was determined by scanning the phosphorscreen with a phosphorimager giving the radiograph visible in this figure. Plotting the intensity pattern of the array enables the identification of preferred phosphorylation motifs (Fig. 3a(ii)) and reveals amino acids that are less favoured in a peptide sequence.
Extended Data Fig. 4
Extended Data Fig. 4. Identification of a tyrosine-based cyclic peptide as a substrate for FIKK13.
a, Scheme of the FIKK13 RaPID selection. b, Sequences and binding affinities of the different peptides recovered after 6 rounds of selection and different variants of the parent peptides. Peptides were initialised with d-Tyr and cyclised via a thioether bond between the N-terminus and the cysteine side chain. Binding affinities were measured by SPR (Supplementary Table 9) and show average ± standard deviation of at least 2 independent replicates. c, FIKK13 kinase domain phosphorylating activity on cyclic peptide identified in panel b. The results are represented as the mean ± SEM fold change compared to the no substrate luminescent signal obtained using the ADP-Glo assay. Statistical significance was determined using a one-way ANOVA followed by Dunnett’s multiple comparison post-test (FIKK13_2 versus no substrate, p = 0.0421; FIKK13_3 versus no substrate, p = 0.9997; FIKK13_4 versus no substrate, p < 0.0001; FIKK13_5 versus no substrate, p = 0.9807). n = 3 biological independent replicates. d, FIKK13 kinase domain phosphorylating activity on FIKK13_4 mutant peptides. The results are represented as the mean ± SEM fold change compared to the no substrate luminescent signal obtained using the ADP-Glo assay. Statistical significance was determined using a one-way ANOVA followed by Šidák’s’s multiple comparison post-test (FIKK13_4 versus no substrate, p < 0.0001; FIKK13_4_Y10A versus no substrate, p = 0.0760; FIKK13_4_S7A_Y10A versus no substrate, p = 0.9982; FIKK13_4_Y10A versus FIKK13_4, p < 0.0001; FIKK13_4_S7A versus FIKK13_4_Y10A, p < 0.0001). n = 3 biological independent replicates.
Extended Data Fig. 5
Extended Data Fig. 5. Protein sequence identity matrix of P. falciparum FIKK kinases.
Amino acid sequence identity on the basis of the P. falciparum multiple sequence alignment after removing poorly aligned regions.
Extended Data Fig. 6
Extended Data Fig. 6. FIKK13 D379N dead mutant crystal structure informs on ATP binding.
a, FIKK13 WT and FIKK13 D379N phosphorylating activity on cyclic peptide FIKK13_4. Results are represented as mean ± SEM fold change compared to the no substrate luminescent signal. Statistical significance was determined using a two-tailed t-test (FIKK13 D379N versus FIKK13, p < 0.0001). n = 3 biological replicates. b, FIKK13 kinase domain – in grey – bound to ATPƔS and complexed with Nb9F10 (olive, CDR3 in magenta) and Nb2G9 (orange, CDR3 in olive wrapping around the kinase C-lobe) c, FIKK13 D379N crystal structure with ATPƔS. The FIKKs N-lobe is compact with more features than ePKs including two α-helices packed above the conserved C-helix. The A-helix, rarely observed in kinase structures apart from the defining cAMP-dependent kinase PKA, marks the beginning of the N-lobe with the conserved Trp-162 (Extended Data Fig. 10) buried in a pocket between the narrow ends of the aligned A and B-helices positioned above the C-helix. The arrangement is capped by an FIKK-specific α-helix between the β4 and β5 strands. The mainly α-helical C-lobe contains, compared to ePKs, three additional α-helices inserted after the activation loop (A-loop). These helices directly interact with the A-loop, potentially limiting its conformational flexibility upon phosphorylation, as seen in various ePKs. The FIKK13 kinase domain catalytic machinery is conserved from ePKs with notable changes; the HRD motif where Asp acts as a general base during phospho-transfer, is conserved as 377HLD379. The DFG motif, which can switch between active “DFG-in” and inactive “DFG-out” conformations, is present in FIKK13 as 398DLS400, although conserved as DFG in FIKK1 and FIKK9.1 (Extended Data Fig. 10) and adopts the “DFG-in” conformation in the FIKK13 kinase domain structure. d, Close-up representation of FIKK13 kinase domain ATP-binding pocket containing ATPƔS, focusing on the F-I-K-K motif. The size and hydrophobicity of Phe-228 restrict the ATP-binding pocket volume while the Lys-230 coordinates the nucleotide α- and β-phosphates and forms a salt bridge with Glu-261 of the C-helix, characteristic of active ePKs. Taken together, the first experimentally determined FIKK kinase structure reveals strong resemblance to ePKs with conservation of the essential elements for catalysis. However, FIKK-specific features, such as additional α-helices in both the N- and C-lobe suggest differences in regulation.
Extended Data Fig. 7
Extended Data Fig. 7. Target peptides of FIKK1, FIKK9.1, or FIKK12 modelled into the substrate-binding groove of the FIKK AlphaFold structures (see Methods).
Peptides may correspond to a likely target peptide of the kinase, or idealised targets based on the results of the OPAL arrays. FIKK kinase domain coloured according to the residues pLDDT score and the substrate peptide is coloured in green. Negatively charged amino acids are labelled in red, positively charged amino acids are labelled in blue, hydrophobic amino acids are labelled in brown.
Extended Data Fig. 8
Extended Data Fig. 8. Substrate specificity assessment of FIKK1 and FIKK9.1 kinase mutants using OPAL arrays.
a, FIKK1 and FIKK9.1 wild type and mutant phosphorylation activity on OPAL membranes represented as heatmaps (see Fig. 3a(i) caption). Below is represented the PWM logos (see Fig. 3a(ii) caption). b, FIKK1 V321D mutant phosphorylation activity on OPAL membranes represented as a heatmap with PWM logo below.
Extended Data Fig. 9
Extended Data Fig. 9. Sequence conservation of FIKK specificity determinants.
a, Conservation of the region surrounding FIKK12 K212 between FIKK paralogues in P. falciparum. The position containing FIKK12 K212 is labelled with an arrow. b, Conservation of the region surrounding FIKK12 K263 between FIKK paralogues in P. falciparum. The position containing FIKK12 K263 is labelled with an arrow.
Extended Data Fig. 10
Extended Data Fig. 10. Multiple sequence alignment of various kinase domains.
Alignment generated using ESPript 3.0. The secondary elements in FIKK13 are shown above the alignment. The ɑ-helices and β-strands corresponding to ePKs are labelled. The ɑFIKK (1–4) are additional alpha-helices found in the FIKK family of kinases, but not in ePKs.

References

    1. World Malaria Report 2023 (World Health Organization, 2023).
    1. Sargeant, T. J. et al. Lineage-specific expansion of proteins exported to erythrocytes in malaria parasites. Genome Biol.7, R12 (2006). - PMC - PubMed
    1. Warncke, J. D. & Beck, H. P. Host cytoskeleton remodeling throughout the blood stages of Plasmodium falciparum. Microbiol. Mol. Biol. Rev.10.1128/MMBR.00013-19 (2019). - PMC - PubMed
    1. Su, X. Z. et al. The large diverse gene family var encodes proteins involved in cytoadherence and antigenic variation of Plasmodium falciparum-infected erythrocytes. Cell82, 89–100 (1995). - PubMed
    1. Baruch, D. I. et al. Cloning the P. falciparum gene encoding PfEMP1, a malarial variant antigen and adherence receptor on the surface of parasitized human erythrocytes. Cell82, 77–87 (1995). - PubMed

MeSH terms

LinkOut - more resources