. 2025 May 19;16(1):818.
doi: 10.1007/s12672-025-02506-2.

Single-cell transcriptomic landscape reveals complex cellular heterogeneity and dysregulated signaling pathways in nasopharyngeal carcinoma

Affiliations

Single-cell transcriptomic landscape reveals complex cellular heterogeneity and dysregulated signaling pathways in nasopharyngeal carcinoma

Xiaoyan Zhang et al. Discov Oncol. .

Abstract

Background: Nasopharyngeal carcinoma (NPC) is a common malignancy with a complex pathogenesis and diverse cellular composition. This study aimed to systematically analyze the transcriptional characteristics of different cell types in NPC and their roles in tumor development using single-cell transcriptomics.

Methods: The research team collected NPC and normal tissue samples, and performed in-depth single-cell sequencing analysis of the transcriptomes. Single-cell RNA sequencing was performed on the collected samples to obtain high-resolution transcriptional profiles of individual cells. This allowed the researchers to identify and characterize the diverse cell populations present within the NPC tumor microenvironment.

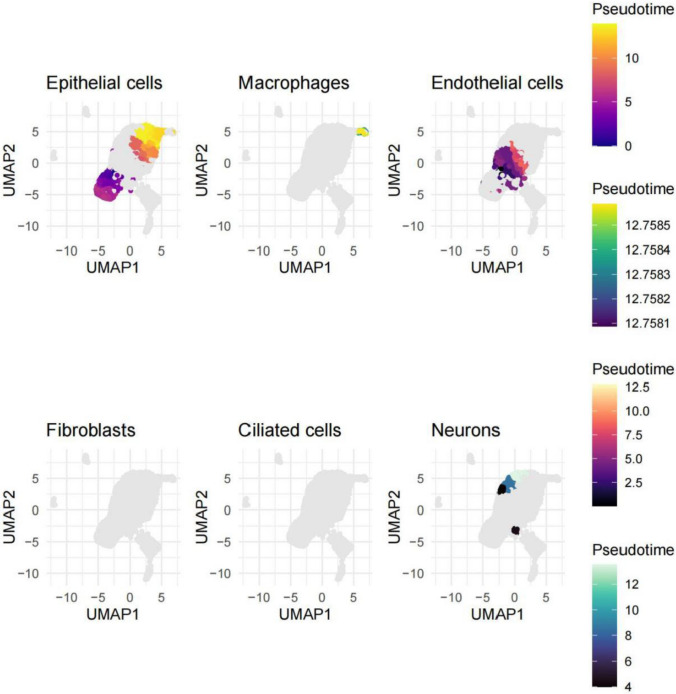
Results: The results showed that NPC samples contained multiple distinct cell subpopulations, including epithelial cells, immune cells (such as macrophages and T cells), endothelial cells, and stromal cells. These cell types exhibited marked differences in spatial distribution and transcriptional profiles, reflecting the high degree of heterogeneity within the tumor microenvironment. Further functional analysis revealed significant dysregulation of mitochondrial-related pathways, extracellular matrix-receptor interactions, as well as Wnt, Notch, and other signaling cascades in NPC.

Conclusion: This study employed single-cell transcriptomics to comprehensively elucidate the complexity of the NPC tumor microenvironment, providing new insights into the underlying mechanisms of disease pathogenesis and suggesting potential therapeutic targets. These findings lay the groundwork for the development of precision medicine approaches for NPC.

Keywords: Cellular heterogeneity; Nasopharyngeal carcinoma; Signaling pathways; Single-cell transcriptomics; Tumor microenvironment.


Conflict of interest statement

Declarations. Competing interests: The authors declare no competing interests.

Figures

Fig. 1
Fig. 1
The causal relationship between allergic rhinitis and nasopharyngeal carcinoma. A Forest plot showing individual genetic variants (SNPs) associated with allergic rhinitis and their effects on nasopharyngeal carcinoma risk. Most variants show protective effects (negative values), with summary estimates (red lines) at bottom. B Scatter plot displaying correlation between SNP effects on allergic rhinitis (x-axis) versus nasopharyngeal carcinoma (y-axis), suggesting an inverse relationship. C Line graph comparing different statistical methods (colored lines) for analyzing the causal relationship between allergic rhinitis and nasopharyngeal carcinoma, with slight methodological differences visible. D Forest plot showing consolidated results across multiple statistical approaches (IVW, MR-Egger, weighted median/mode), consistently supporting a protective effect of allergic rhinitis against nasopharyngeal carcinoma
Fig. 2
Fig. 2
Genetic Polymorphism and Nasopharyngeal Carcinoma Association Analysis. A: Most genetic loci exhibited a protective effect against nasopharyngeal carcinoma (effect size < 0). B A negative correlation trend between the proportion of IgD + B cells and nasopharyngeal carcinoma. C Protective associations for individual loci. D Consistent results using different statistical methods (e.g., inverse variance weighted, MR-Egger)
Fig. 3
Fig. 3
Transcriptomic Landscape of Nasopharyngeal Carcinoma. A The hierarchical clustering clearly distinguishes two major expression patterns: genes upregulated in tumor samples (top cluster, including PC3G9, PLEKHO2, FGFR3, etc.) and genes upregulated in control tissues (bottom cluster, including ADAMTSL1, STXBP5, etc.). Each column represents an individual patient sample and each row represents a gene. Color intensity indicates expression level, with red showing higher expression and beige showing lower expression. B Volcano plot illustrating the magnitude and significance of differentially expressed genes in NPC compared to normal nasopharyngeal epithelium. Differential expression analysis was performed using DESeq2 with threshold criteria of |log2 FC|> 1.5 and adjusted p-value < 0.05
Fig. 4
Fig. 4
Functional Analysis of Molecular Pathways in Nasopharyngeal Carcinoma. Functional enrichment analysis of differentially expressed genes from 12 NPC tumors and matched controls. Gene Ontology analysis revealed significant enrichment in A biological processes related to mitochondrial translation and protein synthesis; B cellular components including synapses and various protein complexes; and C molecular functions such as protein kinase binding. D KEGG pathway analysis identified dysregulation in nitrogen metabolism, ECM-receptor interaction, and several signaling pathways. Microdissected samples (> 80% tumor purity) were used for RNA-seq. Dot size represents gene count and color indicates significance level
Fig. 5
Fig. 5
Single-Cell Transcriptome Profiling of Nasopharyngeal Carcinoma. A A PCA plot showed overall sample distribution, revealing significant transcriptional differences between tumor and non-tumor cells. B Distribution of principal component scores highlighted multiple layers of transcriptional heterogeneity within nasopharyngeal carcinoma samples. C A scatter plot showed gene loadings on the first two principal components, highlighting markers for various cell types. D: Plots of total RNA count and number of expressed genes per cell exhibited bimodal patterns, reflecting transcriptional differences between tumor and non-tumor populations
Fig. 6
Fig. 6
Cellular Heterogeneity in Nasopharyngeal Carcinoma. A, C UMAP plots revealed clustering patterns in single-cell transcriptional data, indicating distinct cell populations. B, D t-SNE plots provided alternative visualizations of the same data, showing distributions of various cell types (e.g., epithelial cells, macrophages). E Analysis highlighted distinct spatial organization and distribution of cell types. F A heatmap showed expression levels of specific genes and pathways in different cell types, shedding light on the functional characteristics of the tumor microenvironment
Fig. 7
Fig. 7
Spatial distribution of cell types in nasopharyngeal carcinoma. UMAP plots displayed the spatial distribution of different cell types (e.g., epithelial cells, macrophages) within nasopharyngeal carcinoma samples, revealing high spatial heterogeneity. Epithelial cells were spatially segregated, while macrophages and endothelial cells exhibited more dispersed distributions, indicating complex tissue organization within the tumor
Fig. 8
Fig. 8
Transcriptional Profiling and Pathway Analysis of Nasopharyngeal Carcinoma. A A hierarchical clustering dendrogram revealed the modular structure of transcriptional networks. B Analysis of relative expression of specific gene sets or pathways highlighted differential activation of signaling pathways (e.g., Notch) across cell types. C Analysis of pathway enrichment significance and direction provided insights into the functional characteristics of the tumor microenvironment. D A heatmap showed clustering of cell types based on pathway enrichment, revealing transcriptional similarities and differences among cell populations. E and F Differential regulation of the Notch signaling pathway across cell types suggested its potential importance in the disease context

Similar articles

References

    1. Chen L, Li J, Li K, Hu J, Li Q, Huang C, Wang G, Liu N, Tang L. Corrigendum to “Evaluation and analysis of risk factors of hearing impairment for nasopharyngeal carcinoma treated using intensity-modulated radiotherapy” [Radiother. Oncol. 190 (2024) 109985]. Radiother Oncol. 2025;204: 110719. - PubMed
    1. Huang X, Tang Y. Unveiling the complex double-edged sword role of exosomes in nasopharyngeal carcinoma. PeerJ. 2025;13: e18783. - PMC - PubMed
    1. Wang H, Fan S, Zhan Y, Xu Y, Du Y, Luo J, Zang H, Peng S, Wang W. Targeting EGFR-binding protein SLC7A11 enhancing antitumor immunity of T cells via inducing MHC-I antigen presentation in nasopharyngeal carcinoma. Cell Death Dis. 2025;16(1):21. - PMC - PubMed
    1. Xiao Z, Chen W, Du Y, Zeng F, Su F, Huang S, Qu S. Efficacy and safety of Anlotinib in combination with gemcitabine and cisplatin as a first-line treatment for recurrent or metastatic nasopharyngeal carcinoma: a single-arm clinical trial. Int J Cancer. 2025;156(11):2169–77. - PubMed
    1. Li S, Dai W, Kam NW, Zhang J, Lee VHF, Ren X, Kwong DL. The role of natural killer cells in the tumor immune microenvironment of EBV-associated nasopharyngeal carcinoma. Cancers (Basel). 2024;16(7):1312. - PMC - PubMed

LinkOut - more resources