. 2025 Aug;32(8):1424-1433.
doi: 10.1038/s41594-025-01531-7. Epub 2025 May 19.

Structure, assembly and inhibition of the Toxoplasma gondii respiratory chain supercomplex

Affiliations

Structure, assembly and inhibition of the Toxoplasma gondii respiratory chain supercomplex

Andrew E MacLean et al. Nat Struct Mol Biol. 2025 Aug.

Abstract

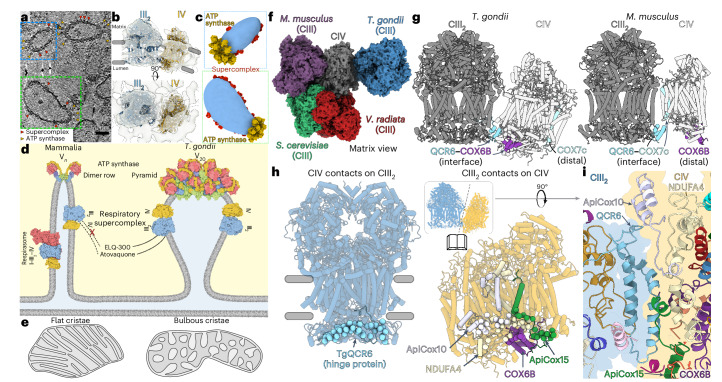
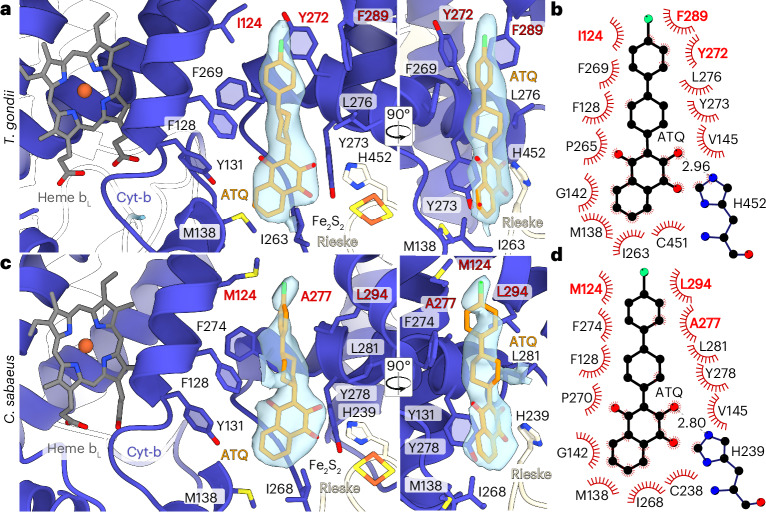
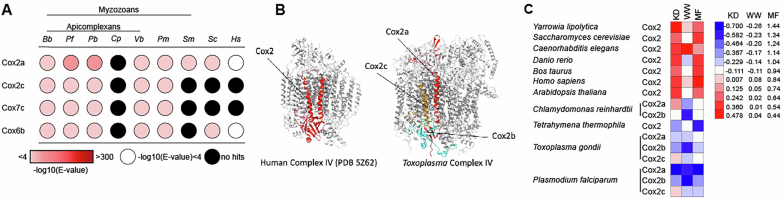
The apicomplexan mitochondrial electron transport chain is essential for parasite survival and displays a divergent subunit composition. Here we report cryo-electron microscopy structures of an apicomplexan III2-IV supercomplex and of the drug target complex III2. The supercomplex structure reveals how clade-specific subunits form an apicomplexan-conserved III2-IV interface with a unique, kinked architecture, suggesting that supercomplexes evolved independently in different eukaryotic lineages. A knockout resulting in supercomplex disassembly challenges the proposed role of III2-IV in electron transfer efficiency as suggested for mammals. Nevertheless, knockout analysis indicates that III2-IV is critical for parasite fitness. The complexes from the model parasite Toxoplasma gondii were inhibited with the antimalarial atovaquone, revealing interactions underpinning species specificity. They were also inhibited with endochin-like quinolone (ELQ)-300, an inhibitor in late-stage preclinical development. Notably, in the apicomplexan binding site, ELQ-300 is flipped compared with related compounds in the mammalian enzyme. On the basis of the binding modes and parasite-specific interactions discovered, we designed more potent ELQs with subnanomolar activity against T. gondii. Our findings reveal critical evolutionary differences in the role of supercomplexes in mitochondrial biology and provide insight into cytochrome b inhibition, informing future drug discovery.


Conflict of interest statement

Competing interests: The authors declare no competing interests.

Figures

Fig. 1
Fig. 1. Structure of the T.gondii respiratory supercomplex.
a, The side view (left) and top view (right) of the III2–IV composite map containing 13 clade-specific subunits. The transmembrane region of CIV is kinked by 21° with respect to CIII. b, An atomic model of III2–IV. c, Conserved and clade-specific structural elements.
Fig. 2
Fig. 2. The lumenal III2–IV interface generates an apicomplexan-specific supercomplex architecture that reflects cristae morphology.
a, A slice of an electron cryo-tomogram of mitochondrial membranes from T.gondii. ATP synthase (yellow) and supercomplexes (red) are indicated. b, The subtomogram average map (gray) is consistent with a III2–IV1 arrangement. The individually fitted CIII dimer (blue) and CIV monomer structures (yellow) are from S. cerevisiae (PDB 6T15). c, A three-dimensional close-up of a showing apical ATP synthase and lateral supercomplex. The apices of the mitochondrial membranes (blue) are occupied by ATP synthase pyramids (yellow, described in ref. ), with supercomplexes (red) in the flatter lateral regions. Both structures were obtained by subtomogram averaging. d, The arrangement of ATP synthase and supercomplexes in cristae of mammals and T.gondii. The rim of flat cristae in mammals are in line with ATP synthase rows (PDB 7ajb), whereas the apices of bulbous T.gondii cristae are shaped by ATP synthase pyramids (PDB 6TML). Mammalian supercomplexes (PDB 7o37) are found in the lateral, flat membrane regions, whereas the kinked III2–IV T.gondii supercomplex (this study) is accommodated by the curved, lateral regions. The matrix is shown in yellow. The cristae lumen and intermembrane space are shown in blue. e, A schematic highlighting the resulting cristae morphologies, adapted from ref. . f, Overlay of supercomplex structures aligned on CIV highlights different architectures, as revealed by differing positions of CIII from mammals (Mus musculus, PDB 7o37 mature supercomplex), yeast (S.cerevisiae, PDB 6giq) and plant (Vigna radiata, PDB 7jrp). The mammalian and T.gondii CIII homologs bind to opposite sides of CIV. g, Comparison of the T.gondii (this study) and M.musculus III2–IV (PDB 7o37) showing the rotation of CIV relative to CIII, thereby placing different CIV subunits (COX6B and COX7c) at the interface with QCR6, or at the distal end of the supercomplex. h, Open-book view of the III2–IV interface with lumenal contacts with respective subunits highlighted by spheres. i, Top view of the III2–IV interface.
Fig. 3
Fig. 3. Supercomplex assembly is critical for T. gondii fitness.
a, Native PAGE analysis of Rieske-HA (CIII2 tagged line), Cox2a-HA (CIV tagged line) and ApiCox10-KO in the Cox2a-HA background (ApiCox10-KO/Cox2a-HA). Total lysates were treated with digitonin and separated by BN–PAGE, followed by immunoblot analysis with anti-HA antibodies, as well as anti-TOM40 as a loading control. Positions of complexes are indicated. b, Native PAGE analysis of QCR2-HA (CIII2 tagged line) and ApiCox10-KO in the QCR2-HA background (ApiCox10-KO/QCR2-HA) treated with digitonin, as in a. Samples were also separated by SDS–PAGE and immunoblot analysis with anti-TOM40 antibodies performed as a loading control. c, Native PAGE analysis of Cox2a-HA ApiCox10-KO/Cox2a-HA treated with digitonin, followed by cytochrome c DAB staining to visualize CIV activity. df, Native PAGE analysis of the lines in a (d), b (e) and c (f) extracted using β-DDM. g, Measurement of mitochondrial membrane potential using JC-1 dye via flow cytometry analysis. (i): T. gondii stained with the dye JC-1 indicated that both lines possess a mitochondrial membrane potential that is sensitive to the ionophore valinomycin. The population to the right of the dotted gray line is JC-1 positive. (ii): quantification of mitochondrial membrane potential by population that is positive for JC-1 staining. Graphs show mean ± s.d., from eight independent experiments. One-way ANOVA followed by Tukey’s multiple pairwise comparisons was performed, and P values from relevant pairs are displayed. ****P < 0.0001. h, Extracellular flux analysis of (i) basal mitochondrial OCR, (ii) maximal mitochondrial OCR and (iii) ECAR of parental and ApiCox10-KO parasites. Graphs show mean ± s.d. from six independent experiments. P value was determined from a two-tailed unpaired Student’s t-test. i, A mixed culture growth competition assay of ApiCox10-KO or parental mNEON fluorescent parasites with tdTomato parasites. Relative abundance (compared with passage 0) of ApiCox10-KO or parental parasites after six passages. Points are mean of four independent experiments, error bars are s.d. P value was determined using a two-tailed one-sample t-test comparing values to passage 0, ** P = 0.0011. NS, not significant. Source data.
Fig. 4
Fig. 4. Atovaquone-bound structures of the T.gondii and mammalian CIII reveals the structural basis for species-specific Qo site binding.
a, View of the Qo site of T.gondii occupied by atovaquone, which prevents electron transfer to heme bL and Fe2S2 in the lumenal domain of the Rieske subunit, which occupies the b-state. Residues responsible for apicomplexan-specific atovaquone sensitivity are shown in red. b, A ligand diagram of atovaquone interactions in the T.gondii Qo site. c, View of the Qo site of C.sabaeus occupied with atovaquone. d, A schematic of atovaquone interactions in the C.sabaeus Qo site.
Fig. 5
Fig. 5. An unexpected Qi binding pose of ELQ-300 allows structure-guided design of inhibitors with increased potency.
a, View of ELQ-300 bound in the Qi site of T.gondii, showing both conformer A and B. b, A close-up view of conformer B of ELQ-300 bound in the Qi site. Parasite-specific aqueous pocket denoted by gray-dashed line. c, TgCyt-b with heme and ELQ-300 binding sites. Helices A–H are connected by loops including AB, CD and EF, with interspersed horizontal helices a, ab, cd1, cd2 and ef. The overlapping atovaquone site (Qo) is shown in transparent orange. The dashed line shows the close-up region depicted in a. d, The structure formula of ELQ-300. e, Ligand diagram of ELQ-300 in the Qi site highlighting hydrogen bonds and hydrophobic interactions. f, Name, formula and EC50 values (nM) of the ELQs that were tested.
Extended Data Fig. 1
Extended Data Fig. 1. Cryo-EM structure determination workflow.
(a) Representative micrograph with T. gondii and C. sabaeus supercomplex particles indicated in blue and orange, respectively. (b) Representative 2D classes of the T. gondii supercomplex. (c) Representative 2D classes of C. sabaeus supercomplex. (d) Data processing scheme, highlighting the reference-based 3D classification to separate T. gondii and C. sabaeus ATP synthase (purple, light green), mitochondrial large subunit (yellow) and putative mitochondrial chaperonin (teal) from T. gondii and C. sabaeus supercomplexes (blue and orange). (e) Fourier Shell Correlation (FSC) curves. (f) Representative micrograph with T. gondii complex III from IP. (g) Representative 2D classes of the T. gondii complex III. (h) Data processing scheme for complex III.
Extended Data Fig. 2
Extended Data Fig. 2. Sequence conservation of newly assigned myzozoan-specific CIV subunits and Cox2 split.
(a) Summary of homology search outcomes for the new subunits. (b) Comparison of Cox2 structure in human CIV and in Toxoplasma where Cox2 is split in three. (c) Heat map indicating the mean hydrophobicity (calculated by grand average of hydropathy (KD) or according to Wimley-White (WW) or the Moon-Fleming (MF) of Cox2 homologs in divergent organisms. Source data
Extended Data Fig. 3
Extended Data Fig. 3. Lipids and kinked architecture of the supercomplex.
(a) Bound lipids of the III2-IV supercomplex with cardiolipins shown in red, phosphatidylcholine in blue and phosphatidylethanolamine in green. Lipid positions indicate a bend membrane region (dashed lines). (b) T. gondii supercomplex structure with estimated membrane plane regions showing a rotational offset between the two subcomplexes CIII and CIV. (c) Comparison of the kinked T. gondii supercomplex architecture the flat assembly of the murine III2-IV supercomplex (PDB 7O3C). (d) Steric hindrance between TgQCR12 and ApiCox7 and between ApiCox10 and TgQCR9 prevents a flat assembly of the III2-IV supercomplex.
Extended Data Fig. 4
Extended Data Fig. 4. Conservation and metal ligand binding of myozoan Cox13.
(a) T. gondii CIV structure (b) TgApiCox13 with bound lipids (CDL, cardiolipin; PE, phosphatidylethanolamine) (c) ApiCox13 from T. gondii (left, this study), predicted homolog structures from Perkinsus marinus and Plasmodium falciparum. Of the two Fe2S2 clusters in T. gondii, one is conserved in P. falciparum, whereas P. marinus seem to utilize zinc. Insets show Fe2S2 coordination sites. (d) Phylogenetic tree with conservation of Fe2S2 and zinc (e) Multi-sequence alignment with residues involved in Fe2S2 or zinc binding shown in yellow and orange respectively. (f) Cofacors of the T. gondii respiratory supercomplex. The Zn2+ of the MPP-beta subunits and the Fe2S2 iron-sulfur clusters in TgApiCox13 that are not part of the electron transfer pathway are indicated with respective subunit names. Source data
Extended Data Fig. 5
Extended Data Fig. 5. Diversity of mitochondrial respiratory chain supercomplexes architecture in different organisms and the apicomplexan-conserved subunits and extensions that establish the divergent III2-IV interface in T. gondii.
(a) Overlay of supercomplex structures aligned on CIV highlights different architectures (luminal view), as revealed by differing positions of CIII from mammals (M. musculus, PDB 7o37 mature supercomplex), yeast (S. cerevisiae, PDB 6giq) and plant (V. radiata, 7jrp). The mammalian and T. gondii CIII homologs bind to opposite sides of CIV. (b) TgQCR6 (hinge protein) interaction with four contact sites on CIV highlighted. (c) T. gondii III2-IV interface (this study) of TgQCR6 with ApiCox10 involving contacts via an apicomplexan-conserved N-terminal extension. (d-e) Structural overlay (D) and structure-based multiple sequence alignment (E) of the murine, P. falciparum and T. gondii QCR6 homologs showing a conserved hairpin structure. The N-terminal QCR6 extension that interacts with ApiCox10 is also found in P. falciparum. The mammalian N-terminus is cleaved as part of a mitochondrial targeting sequence.
Extended Data Fig. 6
Extended Data Fig. 6. Generation and characterization of ApiCox10-KO line.
(a) Schematic of the strategy used to C-terminally HA-epitope tag the Cox2a protein. The expected size of integration PCRs are shown. (b) PCR to test integration of HA-epitope tag and CAT selection cassette into the endogenous locus, as outlined in (A). (c) Immunoblot analysis of whole cell lysate extracted from Cox2a-HA and parental parasites. Samples were separated by SDS-PAGE, blotted, and detected using anti-HA and anti-TOM40 as a loading control. (d) Schematic of the strategy used to replace the coding sequence of ApiCox10 with a DHFR selection cassette. The expected size of integration PCRs are shown. (e) PCR to test integration of the DHFR selection cassette into the endogenous locus, in Cox2a-HA, QCR2-HA and mNEON::Δku80 parental background, as outlined in (D). (f) Immunoblot analysis of ApiCox10-KO and complementation line (cApiCox10-Ty) parasites, detected using anti-Ty and anti-TOM40. (g) Immunofluorescence assay of ApiCox10-KO and cApiCox10-Ty parasites, labeled with anti-Ty and anti-TOM40. Scale bar is 5 μM. (h) Volcano plot of proteomic data from Cox2a-HA vs ApiCox10/Cox2a-HA immunoprecipitations, showing the -log10 P values and the log2 fold changes of proteins detected by mass spectrometry in 3 or more replicates, from 4 independent experiments. P values were calculated using a two-tailed t-test. Horizontal dotted gray line denotes P= 0.05 and P = 0.01. Vertical dotted line denotes 5x enrichment. Complex III subunits are labeled in red and complex IV subunits are labeled in the blue. (i) Native-PAGE and immunoblot analysis of Cox2a-HA, ApiCox10-KO/ Cox2a-HA and the complemented cApiCox10-Ty lines. Total lysate was treated with digitonin and separated by BN-PAGE, followed by immunoblot analysis. Positions of complexes are indicated. (j) Transmission electron microscopy (TEM) of parasites to visualize mitochondrial cristae. Scale bar is 200 nm. (k,l) Quantification of number of cristae cross sections per mitochondrial surface area (K) and mitochondrial area (L) in parental and ApiCox10-KO parasites from TEM. Data points from 100 mitochondrial profiles, with mean shown ( ± s.d. in K). P value from a two-tailed unpaired t-test. (m) MitoSOX labeling to detect mitochondrial ROS at steady state or upon treatment with ferric ammonium chloride (FAC) in ApiCox10 knockout and parental parasites in mNEON background via flow cytometry analysis. Left: red fluorescence of T. gondii, in the absence or presence of ferric ammonium chloride (FAC), stained with MitoSOX. Population to the right of the dotted gray line are MitoSOX positive. Right: Quantification of population that is positive for MitoSOX signal. Graphs show mean ± s.d., from 4 independent experiments One-way ANOVA followed by Turkey’s multiple pairwise comparisons was performed, and P value from relevant pairs displayed. ns, no significant difference; ** P < 0.01 (parental vs parental + FAC P = 0.0037; KO vs KO + FAC P = 0.0015). (n) Surface electrostatics of the III2-IV (calculated with the Adaptive Poisson-Boltzmann Solver, APBS4) reveals a negative lumenal patch. Cytochrome-c binding sites were inferred from overlays of PDBs 5iy5 and 3cx5. (o) Quantification of number of parasites per vacuole for parental and ApiCox10-KO parasites. Error bars are mean ±s.d. from 4 independent experiments, for which over 250 vacuoles were counted for each replicate. The P value determined by multiple two-tailed t-tests with a Holm-Sidak correction applied. (p) Mixed culture growth competition assay of ApiCox10-KO or parental mNEON fluorescent parasites with tdTomato parasites. Relative abundance (compared to passage 0) of ApiCox10-KO parasites across 6 passages. Points are mean ± s.d., from 4 independent experiments, P value determined from a one-way ANOVA, corrected for multiple comparisons (Dunnett) (ns, no significant difference; P3 P = 0.0242; P4 P = 0.0022; P5 P = 0.0004; P6 P < 0.0001). Source data
Extended Data Fig. 7
Extended Data Fig. 7. Gating strategy for flow cytometry.
(a) Example gating strategy for to isolate parasites for flow cytometry analysis for Fig. 3g,i and Extended Data Fig. 6M,P. Gates were drawn as indicated manually using FlowJo software, using forward and side scatter plots (SSC-A vs FSC-A) to gate on the parasite population and separate it from host cell debris. Single cells were then selected (FSC-A vs FSC-H). Parasites were then analyzed for fluorescence. (b) Flow cytometry fluorescence analysis (i) analysis of red fluorescence for JC-1 assay to determine mitochondrial membrane potential in Fig. 3g (left) (ii) analysis of green and red fluorescence for JC-1 assay to determine mitochondrial membrane potential in Fig. 3g (right). Comparison of parasites showing red and green or green only fluorescence was made, with positions of quadrants determined by unstained and valinomycin controls. (iii) analysis of green and red fluorescent parasites for growth competition assay in Fig. 3i and Extended Data Fig. 6P. Green and red parasite quadrants determined by analyzing mNEON::Δku80 and tdTomato::Δku80 parental parasites separately (iv) analysis of red fluorescence for MitoSOX assay to determine mitochondrial ROS generation in Extended Data Fig. 6M.
Extended Data Fig. 8
Extended Data Fig. 8. Structural divergence of the apicomplexan cytochrome-b and the different mode of inhibition of the parasite and host by atovaquone.
(a) T. gondii supercomplex structure with heme molecules and inhibitors (ELQ-300 and atovaquone (ATQ)) (b) Cryo-EM map (left) and model (right) of the C. sabaeus CIII. (c) Schematic of the C. sabaeus CIII with heme groups and two ATQ copies (orange) per monomer shown. Inset depicts close-up view of the Qi site occupied with atovaquone. (d) Overlay of Cyt-b structures from T. gondii, C. sabaeus (both this study) and S. cerevisiae with the module of helices F-H highlighted. (e) Comparison of helices F,G,H. The T. gondii helices F and H are straight and lack the conserved proline residues (red) found in the opisthokont homologs. (f) Overlay of the atovaquone-inhibited Cyt-b structures from T. gondii and C. sabaeus showing that the kink in the mammalian helix F causes it to extend further into the Qo site. Two affected residues interacting with ATQ are shown. (g) Multiple sequence alignment showing the absence of conserved proline residues (red) in helices F and H. Tg, Toxoplasma gondii; Pf, Plasmodium falciparum; Pm, Plasmodium malariae, Pk, Plasmodium knowlesi; Pv, Plasmodium vivax; Po, Plasmodium ovale; Hs, Homo sapiens; Cs, Chlorocebus sabaeus; Sc, Saccharomyces cerevisiae. (h) T. gondii Qo site with ATQ and surrounding conserved residues (map in blue). (i) Comparison of atovaquone bound Qo sites in T. gondii (left) and S. cerevisiae (right; PDB 4pd4). (j) Ligand diagram of atovaquone in the C. sabaeus Qi site.
Extended Data Fig. 9
Extended Data Fig. 9. Cryo-EM structure of the affinity-purified T. gondii complex III, obtained to elicit the binding mode of ELQ-300 at the Qi site reveals critical differences to quinolone-bound bovine structures.
(a) Schematic of the strategy used to C-terminally triple FLAG-epitope tag the Rieske protein. The expected size of integration PCRs are shown. (b) PCR to test integration of FLAG-epitope tag and CAT selection cassette into the endogenous locus, as outlined in (A). (c) Immunoblot analysis of whole cell lysate extracted from Rieske-3xFLAG and parental parasites. Samples were separated by SDS-PAGE, blotted, and detected using anti-FLAG and anti-MYS as a loading control. (d) Immunoblot analysis of fractions from FLAG immunoprecipitation. Equal cell equivalents of input, unbound (UB) and elute fractions were separated by SDS-PAGE and either stained with instant blue or blotted, and detected using anti-FLAG and anti-TOM40. (e) Purified complex III after one round of gel filtration: 5 µg of protein separated by SDS-PAGE and stained with instant blue. (f-j) Cryo-EM densities (transparent blue) for residues surrounding the Qi site showing the ELQ front view (F), back view (G), closeup on the cytochrome-b N-terminus (H) and conformers A and B of ELQ (I), closeup of a cardiolipin molecule (J). (k) In T. gondii (this study) the carbonyl and amino groups interact with H197 and D223, respectively. (l-m) In X-ray structures of the B. taurus homolog, the orientation of the 3-aryl quinolones is rotated by 180 degrees, leading to a different position of the diaryl-rest when compared to the parasite structure (L: PDB ID 5NMI, ref. ; M: 6ZFS). Shown are inhibitors MJM170 (L) and WDH-1U-4 (M). (n-p) By comparison, owing to a flipped quinolone orientation 2-aryl-quinolones bind with the diaryl-like group facing in the same direction as in other structures of the bovine enzyme (N: PDB ID 7R3V; O: 5OKD; P: 6HAW), shown are inhibitors CK-2-67 (N), SCR0911 (O) and WDH2G7 (P). (q-r) Species-specific mutations in the apicomplexan Qi site explain susceptibility to ELQ-300. (q) ELQ-300 bound in the T. gondii cytochrome-b (this study, cryo-EM density in transparent blue) with overlaid a predicted model of the P. falciparum homolog (AlphaFold2). The apparent favorable interaction of the P. falciparum I22 with the methoxy group is indicated. (r) Van der Waals atomic radii of the 3-position chlorine and L26 shown in comparison with the smaller fluorine atom found in ELQ-316. Source data

References

    1. Schägger, H. & Pfeiffer, K. Supercomplexes in the respiratory chains of yeast and mammalian mitochondria. EMBO J.19, 1777–1783 (2000). - PMC - PubMed
    1. Greggio, C. et al. Enhanced respiratory chain supercomplex formation in response to exercise in human skeletal muscle. Cell Metab.25, 301–311 (2017). - PubMed
    1. Fedor, J. G. & Hirst, J. Mitochondrial supercomplexes do not enhance catalysis by quinone channeling. Cell Metab.28, 525–531.e4 (2018). - PMC - PubMed
    1. Berndtsson, J. et al. Respiratory supercomplexes enhance electron transport by decreasing cytochrome c diffusion distance. EMBO Rep.21, e51015 (2020). - PMC - PubMed
    1. Brischigliaro, M. et al. Structural rather than catalytic role for mitochondrial respiratory chain supercomplexes. eLife12, RP88084 (2023). - PMC - PubMed

MeSH terms

LinkOut - more resources