. 2025 May 19;15(1):17359.
doi: 10.1038/s41598-025-99804-0.

Deciphering the role of histone modifications in memory and exhausted CD8 T cells

Affiliations

Deciphering the role of histone modifications in memory and exhausted CD8 T cells

Hua Huang et al. Sci Rep. .

Abstract

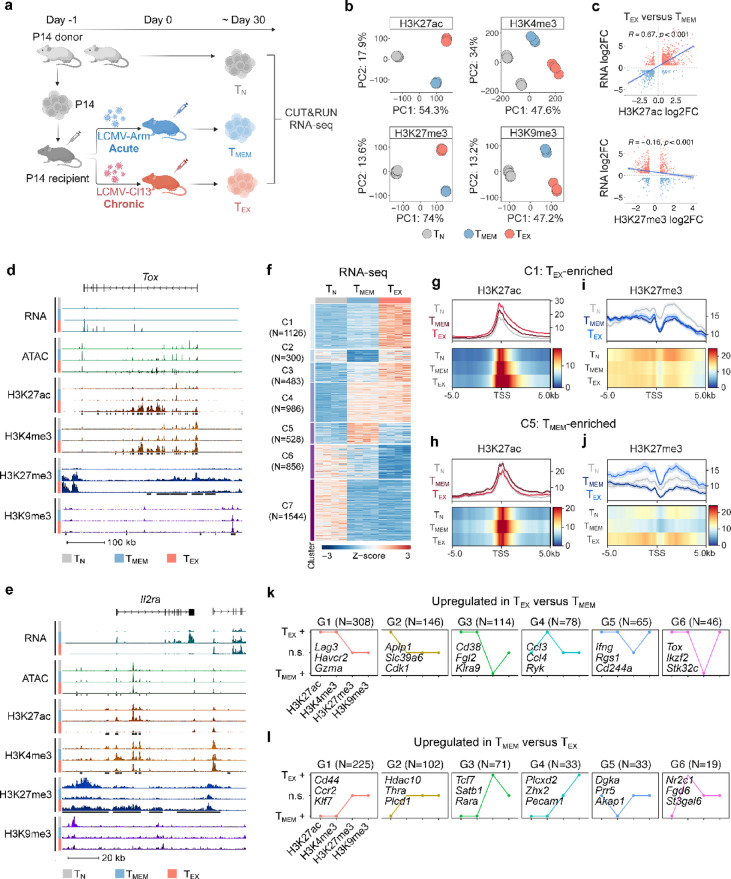
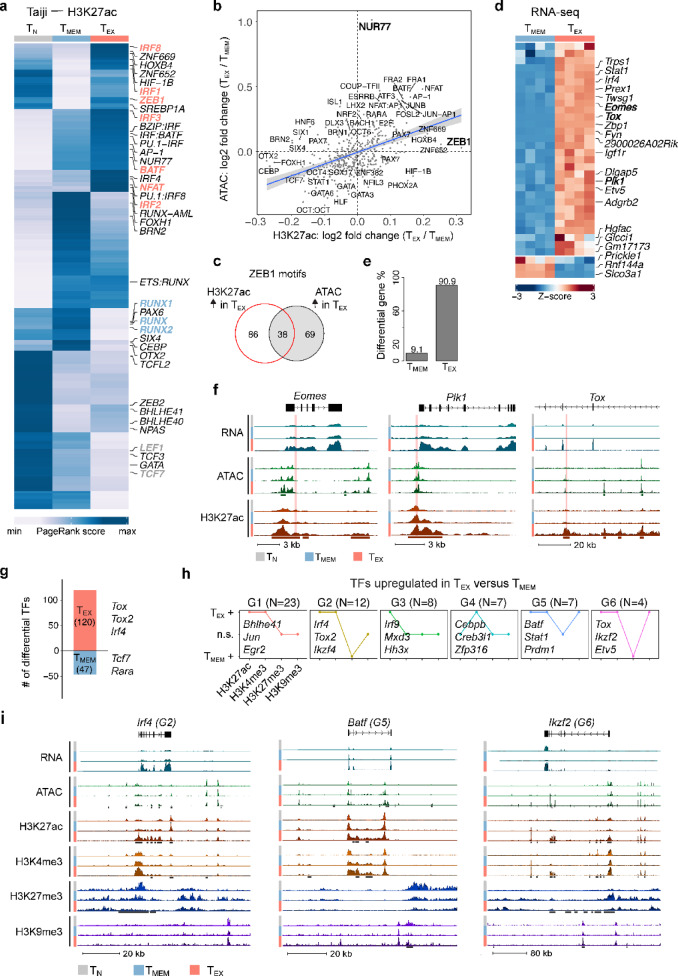
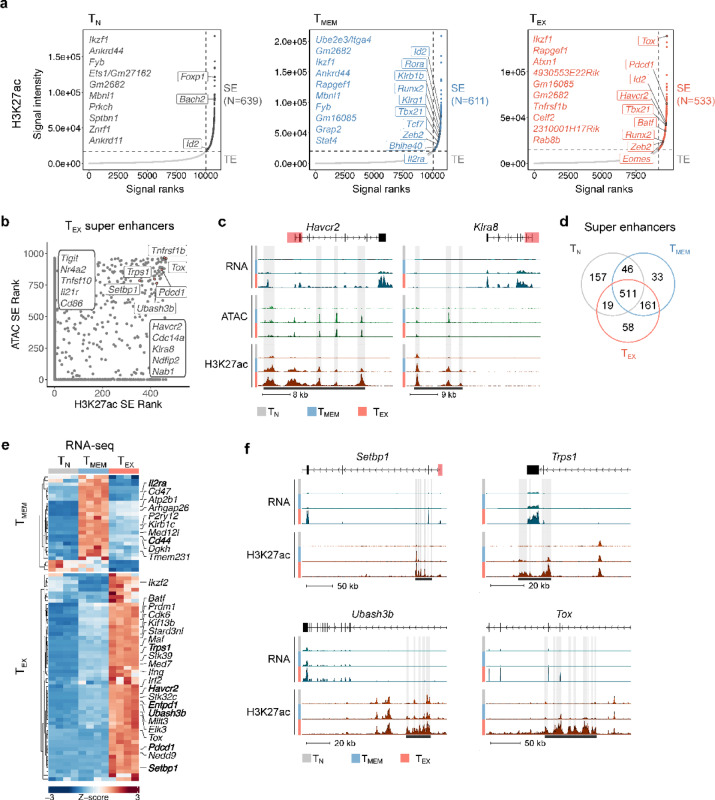
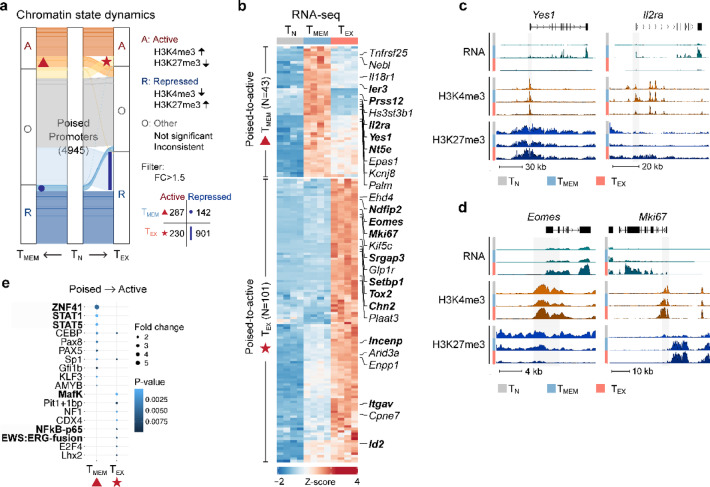
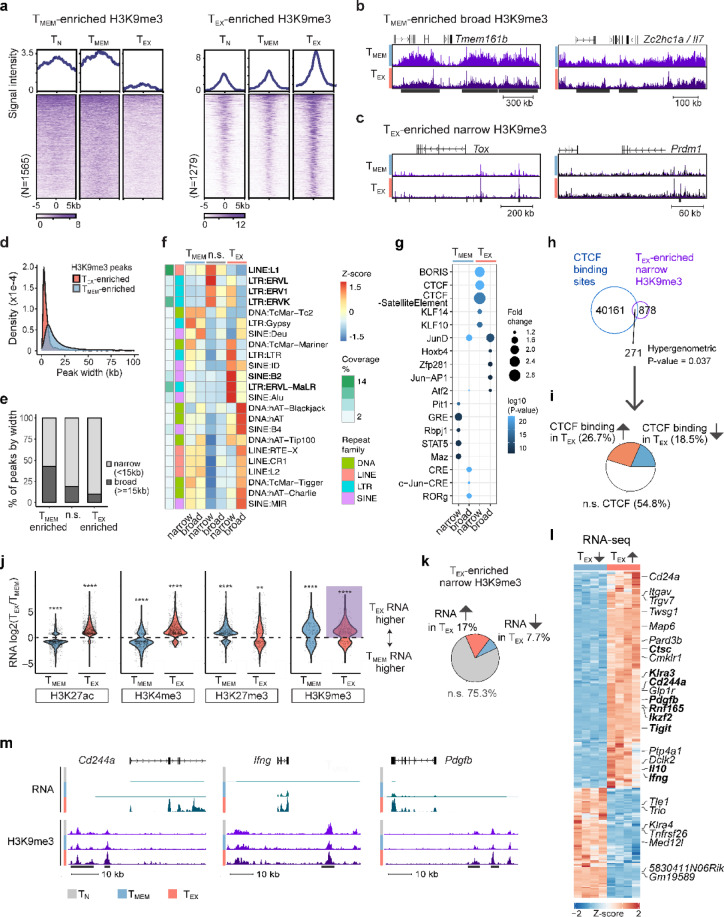
Exhausted CD8 T cells (TEX) arising during chronic infections and cancer have reduced functional capacity and limited fate flexibility that prevents optimal disease control and response to immunotherapies. Compared to memory (TMEM) cells, TEX have a unique open chromatin landscape underlying a distinct gene expression program. How TEX transcriptional and epigenetic landscapes are regulated through histone post-translational modifications (hPTMs) remains unclear. Here, we profiled key activating (H3K27ac and H3K4me3) and repressive (H3K27me3 and H3K9me3) histone modifications in naive CD8 T cells (TN), TMEM and TEX. We identified H3K27ac-associated super-enhancers that distinguish TN, TMEM and TEX, along with key transcription factor networks predicted to regulate these different transcriptional landscapes. Promoters of some key genes were poised in TN, but activated in TMEM or TEX whereas other genes poised in TN were repressed in TMEM or TEX, indicating that both repression and activation of poised genes may enforce these distinct cell states. Moreover, narrow peaks of repressive H3K9me3 were associated with increased gene expression in TEX, suggesting an atypical role for this modification. These data indicate that beyond chromatin accessibility, hPTMs differentially regulate specific gene expression programs of TEX compared to TMEM through both activating and repressive pathways.


Conflict of interest statement

Declarations. Competing interests: E.J.W. is a member of the Parker Institute for Cancer Immunotherapy. E.J.W. is an advisor for Arsenal Biosciences, Coherus, Danger Bio, IpiNovyx, New Limit, Marengo, Pluto Immunotherapeutics, Prox Bio, Related Sciences, Santa Ana Bio, and Synthekine. E.J.W. is a founder of Arsenal Biosciences, Danger Bio, Prox Bio and holds stock in Coherus. J.R.G. is a consultant for Arsenal Biosciences, Cellanome, GVM1, and Seismic Therapeutics. The remaining authors declare no competing interests. Ethical approval: This study is reported in accordance with ARRIVE guidelines.

Figures

Fig. 1
Fig. 1
Histone modifications act in concert to regulate gene expression in TEX and TMEM. (a) Experimental design. (b) PCA of H3K27ac, H3K4me3, H3K27me3 and H3K9me3 data for TN, TMEM and TEX. For TMEM and TEX, n = 4 biological replicates; for TN, n = 8 biological replicates. (c) Correlation of change in RNA expression between TMEM and TEX and change in H3K27ac (top), or H3K27me3 (bottom). R and associated P-value represent Pearson correlation. Each dot represents one gene with one associated peak. (d-e) Genome tracks showing RNA-seq, ATAC-seq and hPTM data. Differentially modified regions between TMEM and TEX for each hPTM are highlighted in black boxes. (f) Heatmap of DEGs showing K-mean clusters for all pairwise comparisons between TN, TMEM, and TEX. (g-h) Meta plot (top) and heatmap plot (bottom) of H3K27ac at TSS for DEGs (g) cluster 1 (C1) and (h) cluster 5 (C5). (i-j) Meta plot (top) and heatmap plot (bottom) of H3K27me3 at TSS for DEGs (i) cluster 1 (C1) and (j) cluster 1 (C5). (k-l) Comparison of hPTM patterns between TMEM and TEX for (k) genes with increased expression in TEX compared to TMEM or (l) genes with increased expression in TMEM compared to TEX. Top six most frequent groups for each set of genes plotted.
Fig. 2
Fig. 2
Identification of predicted TF binding motifs under H3K27ac identities role for ZEB1 in TEX. (a) Heatmap of normalized Taiji PageRank scores determined using RNA-seq and H3K27ac data. (b) Correlation plot comparing Taiji PageRank scores from H3K27ac to ATAC-seq data. Axes represent log2 fold change in Taiji PageRank scores between TEX and TMEM. (c) Venn diagram comparing number of ZEB1 motifs in regions with increased H3K27ac in TEX to regions with increased chromatin accessibility (ATAC) in TEX. (d) Heatmap showing DEGs between TMEM and TEX associated with regions with increased H3K27ac in TEX that contain ZEB1 motifs. (e) Bar graph showing cell type expression of DEGs associated with ZEB1 motifs in regions with H3K27ac enriched in TEX without concurrent increases in chromatin accessibility. (f) Genome tracks highlighting ZEB1 motifs in regions with increased H3K27ac levels in TEX without changing chromatin accessibility. Differentially modified regions for H3K27ac and open chromatin are highlighted in boxes under tracks. Predicted ZEB1 binding sites are shown in red. (g) Number of differentially expressed TFs between TMEM and TEX, with representative TFs indicated. (h) Comparison of hPTMs between TEX and TMEM for TFs with increased expression in TEX. Top six most frequent groups plotted. (i) Genome tracks showing RNA-seq, ATAC-seq and hPTM data for TFs with increased expression in TEX. Differentially modified regions for each modification are highlighted in black bars.
Fig. 3
Fig. 3
Super enhancers drive transcriptional phenotype of TEX. (a) Distribution of H3K27ac signal across stitched enhancer regions in TN, TMEM and TEX. Top 10 ranked putative SEs plus selected SEs are highlighted. N indicates the number of putative SEs identified for each cell type. Stitched enhancers above horizontal dashed lines are associated with putative SEs; enhancers below horizontal dashed lines are typical enhancers (TE). (b) Comparison of SE ranks identified using H3K27ac signal (x-axis) and ATAC signal (y-axis). Selected SEs are labeled. (c) Genome tracks showing RNA-seq, ATAC-seq and H3K27ac data. Putative SE regions identified using H3K27ac data but not ATAC-seq data are highlighted in black boxes below tracks. Individual enhancers within SE regions are highlighted in grey. Promoter regions (± 2,500 bp of TSS) are indicated in red. (d) Venn diagram showing cell-type specificity of SEs identified by H3K27ac. (e) Heatmap showing gene expression of genes within 50 kb of SE identified only in TMEM and TEX, respectively. Selected DEGs are highlighted. (f) Genome tracks showing RNA-seq and H3K27ac data. Putative SE regions identified using H3K27ac data are highlighted in black box. Individual enhancers within SE regions as highlighted in grey. Promoter regions (± 2,500 bp of TSS) are indicated in red.
Fig. 4
Fig. 4
Key TMEM and TEX genes are poised in TN and activated upon differentiation. (a) Alluvial plot showing how hPTMs at promoters poised in TN change in TMEM and TEX. Active promoters were defined as either significantly gaining H3K4me3 or losing H3K27me3 or both; repressed promoters were defined as either significantly losing H3K4me3 or gaining H3K27me3 or both. Statistical cutoff of FC > 1.5. Number represents total number of TN poised protomers; inset table shows number of poised-to-active and poised-to-repressed promoters in TMEM and TEX. (b) RNA expression heatmap for DEGs with poised promoters which were activated in either TMEM (triangle) or TEX (star). Selected DEGs are highlighted in bold. (c-d) Genome tracks showing poised promoters in TN that switched to active (c) only in TMEM or (d) only in TEX. Promoters were excluded from analysis and are highlighted in grey bars. (e) Bubble plot showing changes in predicted TF binding site accessibility for poised-to-active TMEM or TEX genes, with select TFs highlighted.
Fig. 5
Fig. 5
TEX-enriched atypical H3K9me3 peaks cover CTCF sites and are associated with gene expression. (a) Signal intensity heatmap of TMEM-enriched and TEX-enriched H3K9me3 regions. (b) Genome track showing broad H3K9me3 regions enriched in TMEM. (c) Genome track showing narrow H3K9me3 regions enriched in TEX. (d) Peak size distribution of TMEM- and TEX-enriched H3K9me3 regions. (e) Percentage of H3K9me3 peaks that are broad versus narrow. Peaks > = 15 kb are defined as broad, peaks < 15 kb are defined as narrow. N.s. = not significantly different between TMEM and TEX. (f) Heatmap of Z-scored repeat element class coverage of TMEM-enriched, non-significant (n.s.) and TEX-enriched H3K9me3 narrow and broad peaks. (g) Predicted TF binding motifs in TMEM- and TEX-enriched narrow and broad peaks compared to n.s. H3K9me3 peaks. Top 5 motifs shown per comparison. (h) Venn diagram showing overlap between locations of CTCF binding sites and TEX-enriched narrow H3K9me3 peaks. P value represents a hypergeometric test. (i) Pie chart showing change in CTCF binding at sites within TEX-enriched narrow H3K9me3 peaks. (j) Violin plot of log2 fold change in RNA expression between TMEM and TEX near differentially modified regions for each hPTM (H3K27ac, H3K4me3, H3K27me3 and H3K9me3). (k) Pie chart showing changes in RNA expression between TMEM and TEX of genes near TEX-enriched narrow H3K9me3 peaks. (l) Heatmap of RNA expression for genes from Fig. 5k. (m) Genome tracks showing DEGs near to narrow TEX-enriched H3K9me3 regions.

Similar articles

References

    1. Turner, S. J., Bennett, T. J. & Gruta, N. L. L. CD8 + T-Cell memory: The why, the when, and the how. Cold Spring Harb Perspect. Biol.13, a038661 (2021). - PMC - PubMed
    1. Kaech, S. M. & Cui, W. Transcriptional control of effector and memory CD8 + T cell differentiation. Nat. Rev. Immunol.12, 749–761 (2012). - PMC - PubMed
    1. McLane, L. M., Abdel-Hakeem, M. S. & Wherry, E. J. CD8 T cell exhaustion during chronic viral infection and Cancer. Annu. Rev. Immunol.37, 457–495 (2019). - PubMed
    1. Gehart, H. & Clevers, H. Tales from the Crypt: New insights into intestinal stem cells. Nat. Rev. Gastroenterol. Hepatol.16, 19–34 (2019). - PubMed
    1. Pauken, K. E. et al. Epigenetic stability of exhausted T cells limits durability of reinvigoration by PD-1 Blockade. Science354, 1160–1165 (2016). - PMC - PubMed

LinkOut - more resources