. 2025 May 19;16(1):821.
doi: 10.1007/s12672-025-02447-w.

Safranal-loaded gold nanoparticles alleviate hepatocellular carcinoma via targeting the Wnt/β-catenin pathway

Affiliations

Safranal-loaded gold nanoparticles alleviate hepatocellular carcinoma via targeting the Wnt/β-catenin pathway

Yara A Samra et al. Discov Oncol. .

Abstract

Background: The Wnt/β-catenin pathway is frequently activated in hepatocellular carcinoma (HCC); thus, it is considered a potential target for novel therapies. Safranal (SAF), a natural product, is reputed for its antitumor and antioxidant activities. Gold nanoparticles (AuNPs) exhibit unique physicochemical properties, they can carry and transport drugs to the tumor as they can passively accumulate within the tumor. The current study aims to evaluate SAF and SAF-AuNPs antitumor effect in HCC model via targeting the Wnt pathway and to evaluate the ability of SAF-AuNPs and Doxorubicin-gold nanoparticles (DOX-AuNPs) in ameliorating DOX chemo-resistance in HCC and enhancing its therapeutic index to reduce unwanted side effects.

Results: SAF significantly attenuated the Wnt/β-catenin pathway, which down-regulated the proliferation and tumor angiogenesis. SAF decreased significantly Wnt-3a, β-catenin, Cyclin D1 VEGF and MMP-9. Developing SAF-AuNPs enhanced the antitumor activity of SAF against HCC. Furthermore, SAF-AuNPs enhanced DOX-AuNPs antitumor activity and lowered multi-drug resistance (MDR) protein level, which attenuates DOX chemo-resistance.

Conclusions: We conclude that SAF and SAF-AuNPs are promising treatments for HCC. They have promising antitumor activity in addition to the ability to attenuate DOX chemo-resistance, so, the desired therapeutic effect may be obtained with minor doses and lowering the side effects.

Keywords: Doxorubicin; Gold nanoparticles; Hepatocellular carcinoma; Safranal; β-catenin.


Conflict of interest statement

Declarations. Competing interests: The authors declare no competing interests.

Figures

Fig. 1
Fig. 1
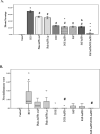
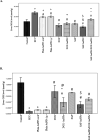
Effect of SAF, DOX, their AuNPs and their AuNPs combination on liver function parameters. Results were presented as mean ± SEM. N = 8 rats per group. +p < 0.05 vs. control group, #p < 0.05 vs. HCC group, *p < 0.05 vs. Plain-AuNPs i.p. group, &p < 0.05 vs. Plain-AuNPs oral group, $p < 0.05 vs. SAF group, @p < 0.05 vs. DOX group, ~p < 0.05 vs. SAF-AuNPs group, =p < 0.05, vs. DOX-AuNPs group
Fig. 2
Fig. 2
SAF-AuNPs/DOX-AuNPs combination therapy decreased fibrosis percentage (a) and necroinflammatory score (b) in liver. Fibrosis results were presented as mean ± SEM and necroinflammatory results were presented as median and range. N = 8 rats per group. +p < 0.05 vs. control group, #p < 0.05 vs. HCC group, *p < 0.05 vs. Plain-AuNPs i.p. group, &p < 0.05 vs. Plain-AuNPs oral group, ~p < 0.05 vs. SAF-AuNPs group, =p < 0.05 vs. DOX-AuNPs group
Fig. 3
Fig. 3
Effect of SAF-AuNPs/DOX-AuNPs combination therapy on serum AFP. Results were expressed as mean ± SEM. n = 8 rats per group. +p < 0.05 vs. control group, #p < 0.05 vs. HCC group, *p < 0.05 vs. Plain-AuNPs i.p. group, &p < 0.05 vs. Plain-AuNPs oral group, $p < 0.05 vs. SAF group, @p < 0.05 vs. DOX group, ~p < 0.05 vs. SAF-AuNPs group, =p < 0.05, vs. DOX-AuNPs group
Fig. 4
Fig. 4
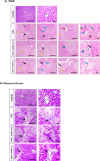
Histopathological examination of liver tissue in control, HCC, Plain-AuNPs oral, and Plain- AuNPs i.p. groups. a H&E-stained liver sections, Control group presented normal hepatic cords with normal portal areas and sinusoids. However, HCC group exhibited disrupted parenchymal structure and widespread fibrosis (black arrows) scored 6, also showed inflammatory cells infiltration such as hemosiderin-laden macrophages and showed congested blood vessels (red arrows). Hepatocytes are present in solid nodules (yellow arrows) with micro-vesicular degeneration (arrowheads), ballooning degeneration (blue arrows) and necrosis (green arrows). Plain-AuNPs oral and Plain-AuNPs i.p. groups showed the same changes in addition to hydropic degeneration (thick arrows) and edema (asterisk). b Masson’s trichome-stained liver sections, control group showed no collagen deposition. However, HCC group displayed excessive collagen deposition with blue color (black arrows). Plain-AuNPs oral and Plain-AuNPs i.p. groups showed a minor reduction in collagen deposition (black arrows). n = 8 rats per group. Low magnification X: 100 bar 100 and high magnification X: 400 bar 50
Fig. 5
Fig. 5
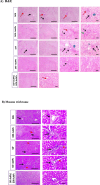
Histopathological examination of liver tissue of DOX, DOX-AuNPs, SAF, SAF-AuNPs, and SAF-AuNPs/DOX-AuNPs groups. a) H&E-stained liver sections, DOX group showed slightly better hepatic parenchymal structure with portal fibrosis (black arrows) scored 3 and infiltration of inflammatory cells such as hemosiderin-laden macrophages and showed congested blood vessels (red arrows). Hepatocytes suffered from hydropic degeneration (thick arrows). DOX-AuNPs group showed partially improved hepatic parenchymal structure with congested blood vessels (red arrows) surrounded by infiltrated inflammatory cells that include hemosiderin-laden macrophages (dashed arrows). Few necrotic hepatocytes are present (green arrows). SAF group showed slightly enhanced hepatic parenchymal structure with portal fibrosis (black arrows) scored 4 and inflammatory cells infiltration such as hemosiderin-laden macrophages (dashed arrows). Hepatocytes suffered from macro-vesicular degeneration (arrowheads) to hydropic degeneration (thick arrows). SAF-AuNPs group showed intensely improved hepatic parenchymal structure with few inflammatory cells’ infiltration in portal areas (dashed arrows). SAF-AuNPs/DOX-AuNPs group showed restored hepatic parenchymal structure with very mild congestion (red arrows). b Masson’s trichome-stained liver sections, DOX group showed mild collagen deposition blue color (black arrows). DOX-AuNPs group showed mild collagen deposition blue color (black arrows) and thin collagen strands spreading from portal areas (red arrow). SAF and SAF-AuNPs groups showed slight perivascular collagen deposition (black arrows) with very thin collagen strands spreading from portal areas (red arrows). Hepatic sections from SAF-AuNPs/DOX-AuNPs group showed no collagen deposition. n = 8 rats per group. Low magnification X: 100 bar 100 and high magnification X: 400 bar 50
Fig. 6
Fig. 6
Effect of SAF-AuNPs/DOX-AuNPs combination therapy on hepatic Wnt-3a protein level. Results were presented as mean ± SEM. n = 8 rats per group. +p < 0.05 vs. control group, #p < 0.05 vs. HCC group, *p < 0.05 vs. Plain-AuNPs i.p. group, &p < 0.05 vs. Plain-AuNPs oral group, $p < 0.05 vs. SAF group, @p < 0.05 vs. DOX group
Fig. 7
Fig. 7
Effect of SAF-AuNPs/DOX-AuNPs combination therapy on hepatic β-catenin protein level. Results were presented as mean ± SEM. n = 8 rats per group. + p < 0.05 vs. control group, # p < 0.05 vs. HCC group, *p < 0.05 vs. Plain-AuNPs i.p. group, &p < 0.05 vs. Plain-AuNPs oral group, $p < 0.05 vs. SAF group, @p < 0.05 vs. DOX group, ~p < 0.05 vs. SAF-AuNPs group, =p < 0.05 vs. DOX-AuNPs group
Fig. 8
Fig. 8
Effect of SAF-AuNPs/ DOX-AuNPs combination therapy on hepatic MDR protein level. Results were presented as mean ± SEM. n = 8 rats per group. +p < 0.05 vs. control group, #p < 0.05 vs. HCC group, *p < 0.05 vs. Plain-AuNPs i.p. group, &p < 0.05 vs. Plain- AuNPs oral group, $p < 0.05 vs. SAF group @p < 0.05 vs. DOX group, ~p < 0.05 vs. SAF-AuNPs group, =p < 0.05 vs. DOX-AuNPs group
Fig. 9
Fig. 9
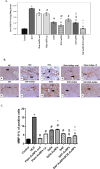
Effect of SAF-AuNPs/DOX-AuNPs combination therapy on hepatic Cyclin D1 protein level. a ELISA results showed that SAF-AuNPs/DOX-AuNPs combination significantly decreased hepatic cyclin D1 compared to HCC group. b Immunohistochemical-stained liver sections of Cyclin D1, black arrows indicate Cyclin D1 antibody-positive regions. A Control group showing faint immunopositive nuclear expression of cyclin D1 in hepatocytes. B, C HCC group showing diffuse high immunopositive nuclear stained hepatocytes with moderate stained inflammatory cells of the dense periportal bridging fibrosis that dividing hepatocytes into multiple nodules. D Plain AuNps oral group showing mild nuclear stained hepatocytes with few positivity in fibroblasts. E Plain AuNps- IP showing mild nuclear stained hepatocytes with mild positivity in periportal fibrosis. F SAF showing moderate nuclear expression in hepatocytes. G SAF- AuNps showing mild to moderate nuclear expression of cyclin D1 in hepatocytes. H DOX showing moderate to high expression in hepatocytes with nuclear expression in periportal bridging fibroblasts and inflammatory cells. I DOX- AuNps showing few nuclear positivity in hepatocytes. J SAF-DOX- AuNps showing moderate nuclear expression in hepatocytes. Thin arrow = positive hepatocytes, thick arrow = positive fibroblasts and inflammatory cells of fibrous septa. X100, bar = 100 µm. c Cyclin D1 percentage of positive cells in hepatic tissue. Results were presented as mean ± SEM. +p < 0.05 vs. control group, #p < 0.05 vs. HCC group, &p < 0.05 vs. Plain-AuNPs oral group, $p < 0.05 vs. SAF group @p < 0.05 vs. DOX group, ~p < 0.05 vs. SAF-AuNPs group, =p < 0.05 vs. DOX-AuNPs group
Fig. 10
Fig. 10
Effect of SAF-AuNPs/DOX-AuNPs combination therapy on hepatic MMP-9 protein level. a ELISA results showed that SAF-AuNPs/DOX-AuNPs combination significantly decreased hepatic MMP-9 compared to HCC group. b Representative IHC of MMP-9 expression in hepatic sections of different treatment groups. A Control group showing faint immunopositive cytoplasmic expression of MMP-9 in hepatocytes. B, C HCC group showing high immunopositive cytoplasmic and nuclear stained hepatocytes with extensive epithelial expression in newly formed bile ductules and fibroblasts. D Plain AuNps oral group showing mild cytoplasmic stained hepatocytes. E Plain AuNps- IP showing mild to moderate immunopositive cytoplasmic staining periportal fibrosis. F SAF showing mild to moderate expression in the thin fibrous septa that surrounded hepatocytes. G SAF- AuNps showing mild to moderate expression of MMP-9 in fibrous septa and admixed inflammatory cells. H DOX showing moderate to high expression in the vacuolated hepatocytes and the surrounding fibrous septa. I DOX-AuNps showing few scattered immunopositive stained hepatocytes. J SAF-DOX-AuNps showing mild to moderate cytoplasmic expression in hepatocytes. Thin arrow = positive fibrous septa, thick arrow = positive hepatocytes, arrowhead = positive biliary epithelial cells. Image magnification = 100x, scale bar = 100 μm. c MMP-9 percentage of positive cells in hepatic tissue. Results were presented as mean ± SEM. +p < 0.05 vs. control group, #p < 0.05 vs. HCC group, *p < 0.05 vs. Plain-AuNPs i.p. group, $p < 0.05 vs. SAF group, ~p < 0.05 vs. SAF-AuNPs group, =p < 0.05 vs. DOX-AuNPs group
Fig. 11
Fig. 11
Effect of SAF-AuNPs/DOX-AuNPs combination therapy on hepatic VEGF expression. a Immunohistochemical-stained liver sections of VEGF, black arrows illustrate VEGF expression areas. X200, bar = 50 µm. b VEGF percentage of positive cells in hepatic tissue. Results were presented as mean ± SEM. n = 8 rats per group. +p < 0.05 vs. control group, #p < 0.05 vs. HCC group, *p < 0.05 vs. Plain-AuNPs i.p. group, &p < 0.05 vs. Plain-AuNPs oral group, $p < 0.05 vs. SAF group @p < 0.05 vs. DOX group, ~p < 0.05 vs. SAF-AuNPs group, =p < 0.05 vs. DOX-AuNPs group
Fig. 12
Fig. 12
Effect of SAF-AuNPs/DOX-AuNPs combination therapy on TAA-induced hepatic oxidative stress parameters (a) Hepatic MDA content and (b) Hepatic GSH content. Results were presented as mean ± SEM. n = 8 rats per group. +p < 0.05 vs. control group, #p < 0.05 vs. HCC group, *p < 0.05 vs. Plain-AuNPs i.p. group, &p < 0.05 vs. Plain- AuNPs oral group, $p < 0.05 vs. SAF group, @p < 0.05 vs. DOX group, ~p < 0.05 vs. SAF-AuNPs group, =p < 0.05 vs. DOX-AuNPs group

References

    1. Yang JD, et al. A global view of hepatocellular carcinoma: trends, risk, prevention and management. Nat Rev Gastroenterol Hepatol. 2019;16(10):589–604. - PMC - PubMed
    1. Vilchez V, et al. Targeting Wnt/β-catenin pathway in hepatocellular carcinoma treatment. World J Gastroenterol. 2016;22(2):823–32. - PMC - PubMed
    1. Khalaf AM, et al. Role of Wnt/β-catenin signaling in hepatocellular carcinoma, pathogenesis, and clinical significance. J Hepatocell Carcinoma. 2018;5:61–73. - PMC - PubMed
    1. Liu L-J, et al. Aberrant regulation of Wnt signaling in hepatocellular carcinoma. World J Gastroenterol. 2016;22(33):7486–99. - PMC - PubMed
    1. Xu C, et al. β-Catenin signaling in hepatocellular carcinoma. J Clin Investig. 2022;132(4): e154515. - PMC - PubMed

LinkOut - more resources