

A nomogram for predicting the risk of peritoneal dialysis-associated peritonitis in patients with end-stage renal disease undergoing peritoneal dialysis: model development and validation study
- PMID: 40389854
- PMCID: PMC12090575
- DOI: 10.1186/s12882-025-04165-5
A nomogram for predicting the risk of peritoneal dialysis-associated peritonitis in patients with end-stage renal disease undergoing peritoneal dialysis: model development and validation study
Abstract
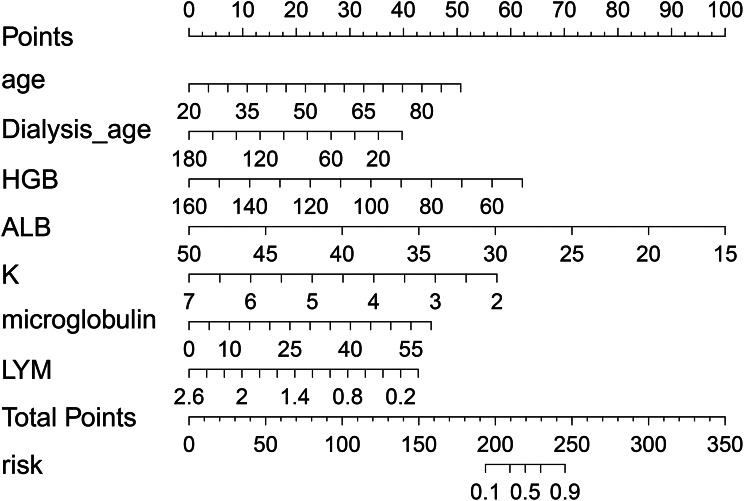
Objective: This study aimed to develop and validate a nomogram to predict the risk of peritoneal dialysis-associated peritonitis (PDAP) in patients undergoing peritopreneal dialysis.
Methods: A retrospective analysis was conducted on clinical data from 376 patients at Nanhai District People's Hospital in Foshan City, Guangdong Province, between December 2017 and December 2024. The dataset was randomly divided into a training set (n = 244) and a validation set (n = 132). Risk factors for PDAP were identified using Least Absolute Shrinkage and Selection Operator (LASSO) regression and logistic regression, and a predictive nomogram was developed and validated using R4.1.3. The model's performance was evaluated through receiver operating characteristic (ROC) curves, the Hosmer-Lemeshow goodness-of-fit test, decision curve analysis (DCA), and clinical impact curves (CICs).
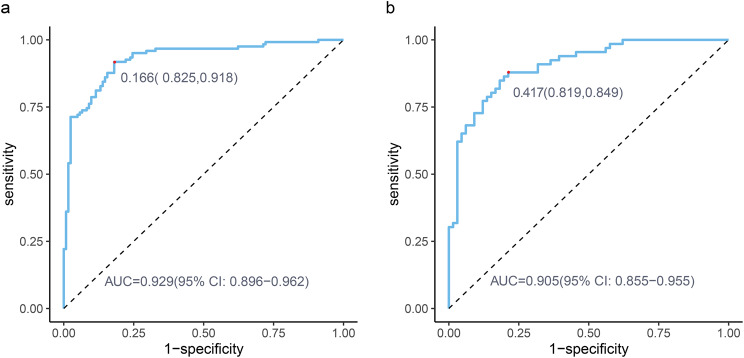
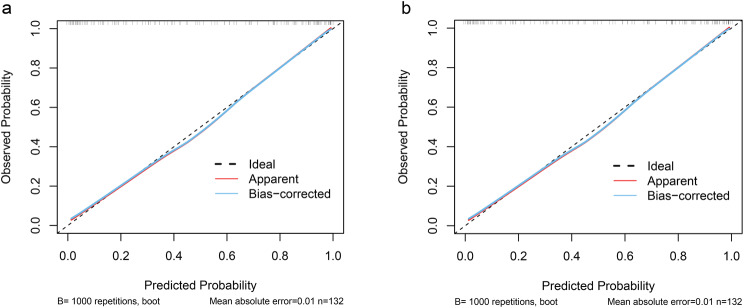
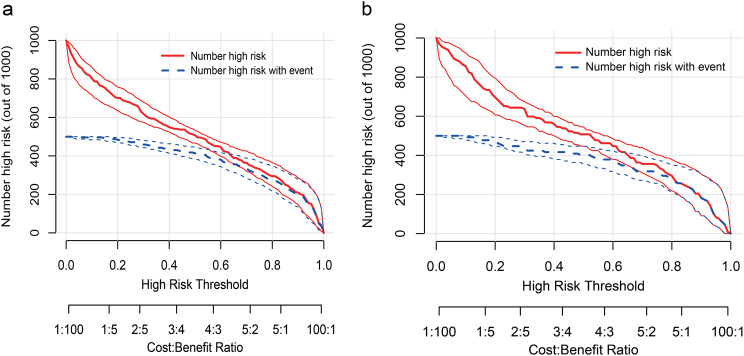
Results: Eight potential predictors were selected by LASSO regression analysis. Multivariate logistic regression analysis confirmed that age, dialysis duration, albumin, hemoglobin, β2-microglobulin, Potassium and lymphocyte count were independent risk factors for PDAP occurrence (P = 0.001). The nomogram's area under the curve (AUC) was 0.929 (95% CI: 0.896-0.962) in the training set and 0.905 (95% CI: 0.855-0.955) in the validation set. The Hosmer-Lemeshow goodness-of-fit test indicated a good model fit (training set χ2 = 13.181, P = 0.106; validation set χ2 = 8.264, P = 0.408). Both DCA and CIC revealed that the nomogram model had good clinical utility in predicting PDAP.
Conclusion: The proposed nomogram exhibited excellent predictive performance and clinical utility, providing a valuable tool for early identification and intervention in PDAP. Further external validation and prospective studies are recommended.
Keywords: Clinical prediction model; Dialysis-associated peritonitisc; End-stage renal disease; Nomogram; Peritoneal dialysis.
© 2025. The Author(s).
Conflict of interest statement
Declarations. Ethical approval: The proposed study protocol has been approved and granted the necessary ethical approvals by the Ethics Committee of the of Nanhai District People’s Hospital, Foshan City (No. 2023361). Our study investigations and methods was conducted in compliance with the Helsinki Declaration. Consent for publication: Not Applicable. Competing interests: The authors declare no competing interests.
Figures


Similar articles
-
Development and validation of a nomogram for predicting refractory peritoneal dialysis related peritonitis.Ren Fail. 2024 Dec;46(2):2368083. doi: 10.1080/0886022X.2024.2368083. Epub 2024 Jul 3. Ren Fail. 2024. PMID: 38958248 Free PMC article.
-
Construction and validation of a predictive model for the risk of peritoneal dialysis-associated peritonitis after peritoneal dialysis catheterization.Front Med (Lausanne). 2023 Sep 15;10:1193754. doi: 10.3389/fmed.2023.1193754. eCollection 2023. Front Med (Lausanne). 2023. PMID: 37790129 Free PMC article.
-
[Construction and validation of a prediction model for treatment failure in peritoneal dialysis associated peritonitis].Zhonghua Yi Xue Za Zhi. 2025 Apr 8;105(14):1087-1094. doi: 10.3760/cma.j.cn112137-20240819-01908. Zhonghua Yi Xue Za Zhi. 2025. PMID: 40176655 Chinese.
-
Peritoneal dialysis peritonitis due to Neisseria: clinicopathological features of 10 patients with a review of the literature.Ren Fail. 2025 Dec;47(1):2466820. doi: 10.1080/0886022X.2025.2466820. Epub 2025 Feb 26. Ren Fail. 2025. PMID: 40012242 Free PMC article. Review.
-
Does the Use of Gastric-Acid Suppressants Increase the Risk of Peritonitis in Patients Undergoing Peritoneal Dialysis? A Meta-Analysis.Semin Dial. 2024 Nov-Oct;37(6):424-432. doi: 10.1111/sdi.13226. Epub 2024 Aug 25. Semin Dial. 2024. PMID: 39182173 Review.
References
-
- Franco MR, Bastos MG, Qureshi AR, Schreider A, de Andrade Bastos K, Divino-Filho JC.Incident elderly patients on peritoneal dialysis: epidemiological characteristics and modality impact on survival time. Saudi J Kidney Dis Transpl. 2017;28(4):782–91. - PubMed
-
- Cho Y, Bello AK, Levin A, Lunney M, Osman MA, Ye F. Peritoneal dialysis use and practice patterns: an international survey study. Am J Kidney Dis. 2021;77(3):315–25. 10.1053/j.ajkd.2020.05.032 - PubMed
-
- Perl J, Fuller DS, Bieber BA, Boudville N, Kanjanabuch T, Ito Y. 2020. Peritoneal dialysis–related infection rates and outcomes: results from the Peritoneal Dialysis Outcomes and Practice Patterns Study (PDOPPS). Am J Kidney Dis. 76(1):42–53. 10.1053/j.ajkd.2019.09.016 - PubMed
-
- Chung M-C, Yu T-M, Wu M-J, Chuang Y-W, Muo C-H, Chen C-H. 2022. Impact of peritoneal dialysis-related peritonitis on PD discontinuation and mortality: a population-based national cohort study. Peritoneal Dialysis Int. 42(2):194–203. 10.1177/08968608211018949 - PubMed
Publication types
MeSH terms
LinkOut - more resources
Full Text Sources
Medical
Research Materials
Miscellaneous
