. 2025 May 19;23(1):560.
doi: 10.1186/s12967-025-06540-0.

The human RNASET2 alarmin-like molecule differentially affects prostate cancer cells behavior in both cell autonomous and non-cell autonomous manners

Affiliations

The human RNASET2 alarmin-like molecule differentially affects prostate cancer cells behavior in both cell autonomous and non-cell autonomous manners

Rossella Roncoroni et al. J Transl Med. .

Abstract

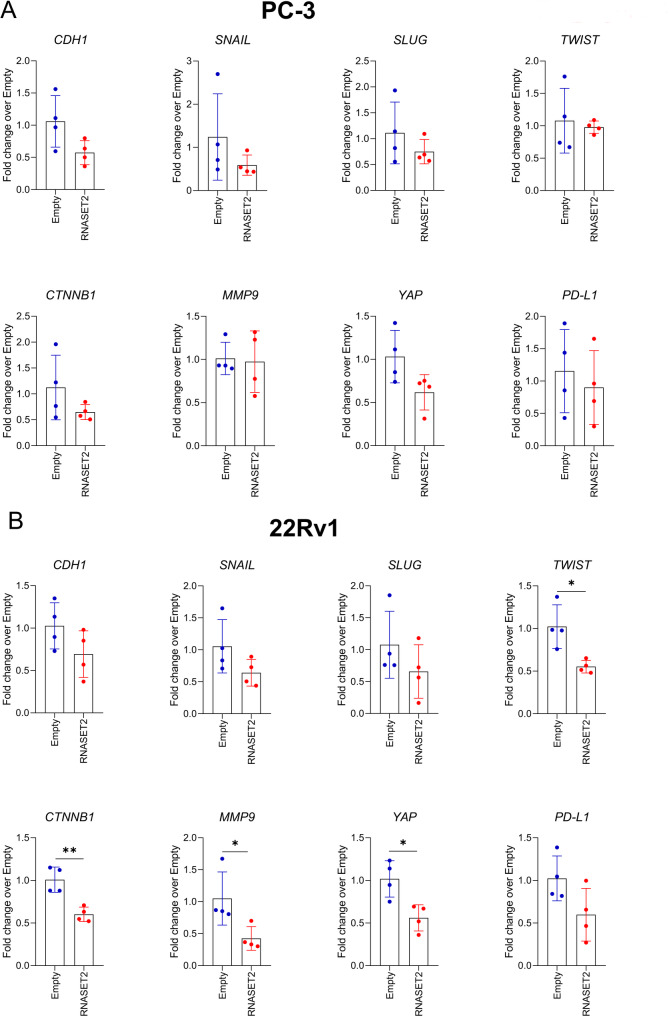
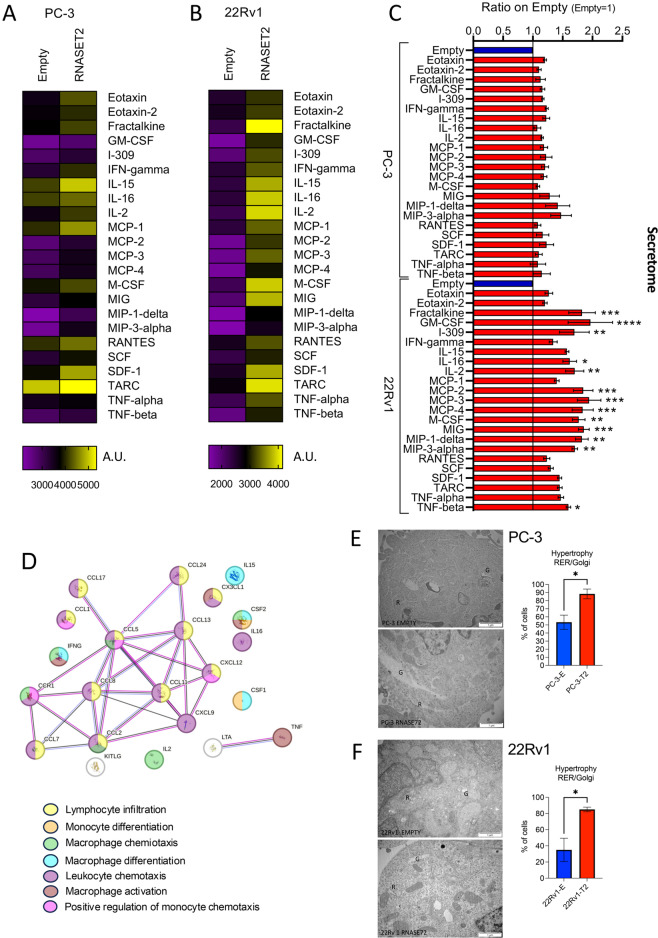
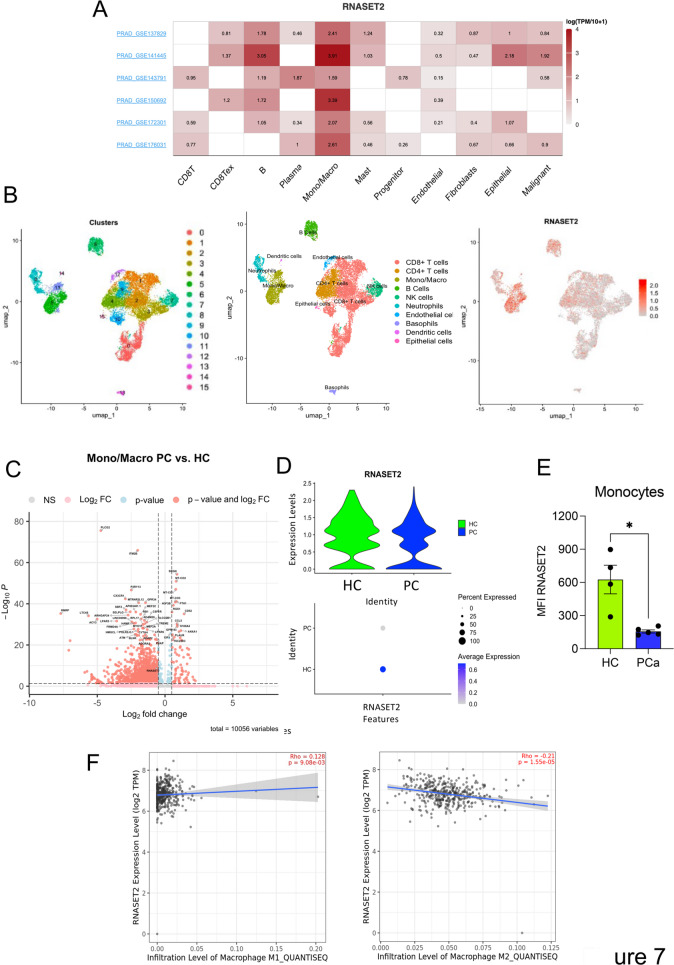
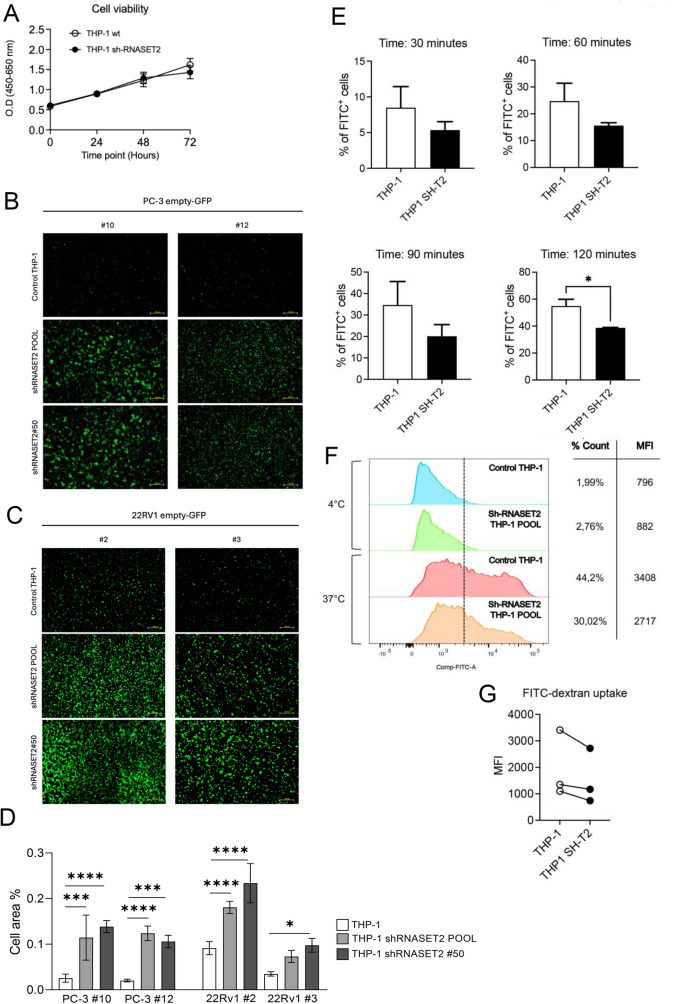
The identification of molecules that make cancer cells detectable by the immune system represents a major challenge in tumor immunology. Alarmins, endogenous, stress-induced molecules, serve as early warning signals triggering immune responses. The human RNASET2 protein has demonstrated both oncosuppressive and immunoregulatory functions across various cancer types, yet its role as an oncosuppressor or alarmin-like molecule in prostate cancer (PCa) is unexplored. Here, we investigated the effects of the human RNASET2 alarmin in two different human PCa cell lines focusing on cell proliferation, colony formation, adhesion, migration rates, and release of soluble immune-modulatory factors. In vivo studies were also carried out on nude mice to assess the immune regulatory impact. Our findings indicate that RNASET2 overexpression reduced cell proliferation and colony formation in 22Rv1 cells, through downregulation of cyclin D1. RNASET2 overexpression in 22Rv1 cells was also associated with decreased levels of TWIST, CTNNB1, YAP, and MMP-9. By contrast, PC-3 cells were largely unresponsive to RNASET2. RNASET2 overexpression also promoted the release of soluble factors related to monocyte/macrophage recruitment/activation and cytokines/chemokines, linked to immune cell-mediated anti-tumor responses. This effect was more pronounced in RNASET2-overexpressing 22Rv1 cells and involved both innate (NK cells, dendritic cells) and adaptive (T cells) immune activation, compared to PC-3 cells. RNASET2 overexpression also affected the cytoskeletal organization in both PCa models. RNASET2 overexpression in vivo induced a shift toward M1-like macrophage polarization pattern, while decreasing the M2-like polarization in mice challenged with 22Rv1 cells, indicating a potential tumor-suppressive role in PCa. Finally, silencing of RNASET2 in THP-1 macrophages unveiled their phagocytic activities against PCa cells. Our findings underscore the RNASET2's dual functionality, acting through both cell-autonomous and non-cell autonomous mechanisms in PCa in vitro and in vivo models and suggest its potential as a therapeutic target in a subset of PCa.

Keywords: Alarmins; Macrophages; Oncosuppressors; Prostate cancer; RNASET2.


Conflict of interest statement

Declarations. Institutional review board statement: Subjects enrolled in the study were recruited within the protocol No. 463.2021, approved by the institutional review board IRCCS MultiMedica Ethics Committees, and adhered to the principles outlined in the Helsinki Declaration of 1975, revised in 2013. Informed consent statement: The study protocol (No. 463.2021) received approval from the institutional review board ethics committees and adhered to the principles outlined in the Helsinki Declaration of 1975, revised in 2013. Informed consent was obtained from all participants, in compliance with the Helsinki Declaration of 1975, revised in 2013. Conflict of interest: The authors declare no conflict of interest.

Figures

Fig. 1
Fig. 1
Clinical impact of RNASET2 expression in patients with prostate cancer. Clinical impact of RNASET2 expression in patients with prostate cancer. Kaplan–Meier curves showing the progression-free survival of patients with prostate cancer dichotomized according to RNASET2 expression (cutoff 40%). Survival analysis was performed using cSurvivalv1.0.1 online bioinformatic tool based on TCGA project (A). Survival analysis performed using TISCH2 (Tumor Immune Single-cell Hub 2) online portal showed that high expression of RNASET2 correlates with a decreased risk in patients with prostate cancer (B). Comparative evaluation of three distinct single-cell RNA-seq datasets GSE141445 (C), GSE143791 (D), GSE137829 (E), performed using TISH2 portal, showing the expression of RNASET2 in patients with prostate cancer
Fig. 2
Fig. 2
Effects of RNASET2 on PCa cell proliferation. The effect of RNASET2 overexpression of cell proliferation was assessed by crystal violet assay (N = 2 in dodecuplicate) and colony formation assay (N = 3 in triplicate) on PC-3 and 22Rv1 prostate cancer (PCa) cell lines. The proliferation rate was monitored for 24-48-72 h in RNASET2 overexpressing PC-3 (A) and 22Rv1 (B) cells, as compared to empty control. Graphs and representative images showing the effect of RNASET2 overexpression on PC-3 and 22Rv1 on their ability to generate colonies (C-D, magnification 10x), following 10 days of cell culture. Western blot was used to determine the modulation of the CyclinD1 molecule (E), in RNASET2-overespressing 22Rv1 cells and compared to empty controls. Data are showed as mean ± SEM, Two-way ANOVA (for growth curves), t-student test (for colony-formation assay and western blot), *p < 0.05, ***p < 0.001, ****p < 0.0001
Fig. 3
Fig. 3
Effects of RNASET2 on cell adhesion migration and cytoskeleton modification in PCa cell lines. The effect or RNASET2 expression on key metastatic features of PCa cells was investigated: adhesion assay (A, B) (n = 3, in triplicate), migration assay (n = 2, in triplicate), in presence or absence of FBS as driving stimulus (C, D) and cytoskeleton morphological analysis (n = 4), with white arrowheads pointing at cell spreading processes observed in PC-3 cells and actin clustering at the cell periphery in 22Rv1 cells, respectively (E, F). RNASET2 (green) and Phalloidin (red) staining are shown. Data are showed as mean ± SEM, t-student test, *p < 0.05; **p < 0.01. E: empty control cells; T2: RNASET2-overexpressing cells
Fig. 4
Fig. 4
Molecular analysis on pro-tumor factors expression in RNASET2-overexpressing PCa cell lines. Graphs show the effects of RNASET-overexpressing and empty control PC-3 (A) and 22Rv1 (B) PCa cell lines, as detected by real-time PCR on CDH1, SNAIL, SLUG, TWIST, CTNNB1, (markers of EMT), MMP9, YAP (markers of metastasis) and PD-L1 (marker of immunosuppression expression. Data are shown as mean ± SEM, Student T-test, *p < 0.05; **p < 0.01
Fig. 5
Fig. 5
Secretome analysis of soluble factors released by RNASET2-empty and RNASET2-overexpressing PC-3 and 22Rv1 cells. Heatmap showing the modulation of the main immunomodulatory factors involved in monocyte/macrophage recruitment and polarization in the conditioned media from RNASET2-empty vector and RNASET2-overexpressing PC-3 cells (A) and RNASET2-empty vector and RNASET2-overexpressing 22Rv1 cells (B). Bar plot showing the modulation of the selected soluble factors by PC-3 and 22Rv1 cells overexpressing RNASET2 represented as fold change over the respective empty controls (C). String analysis for the biological connections among the most upregulate soluble factors, in RNASET2-expressing PCa cells, as detected by secretome analysis of their related conditioned media (D). Transmission electron microscopy (TEM) of PC-3 and 22Rv1 RNASET2 overexpressing and empty control PCa cells, and related graphs showing the quantification of Reticulum (R) and Golgi (G) hypertrophy. Data are shown as mean ± SEM, One-way ANOVA, *p < 0.05; **p < 0.01; ***p < 0.001, ****p < 0.0001, or mean ± SEM student t-test *p < 0.05
Fig. 6
Fig. 6
Effects of RNASET2 on tumor cell growth in vivo. The effects of RNASET2-overxpression in PCa cells were investigated on tumor cell growth in vivo. Nude Mice-Nu/Nu male mice (n = 5) were subcutaneously injected with RNASET2-overexpressing. Growth curve graphs (A, D), photographs of excised tumors (B, E), and tumor weight (C, F) of RNASET2-overexpressin PC-3 and 22Rv1 PCa tumor xenografts, and their related empty-vector transfected controls, are shown. FACS analysis (n = 3 animals/group) for tumor-infiltrating CD80+ M1 and CD206+ M2 macrophages (G, J), M1/M2 ratio (H, K), and representative dot plots (I, L) in excised RNASET2-overexpressing PC-3 and 22Rv1 PCa xenograft, and their related empty-vector transfected controls. Data are showed as mean ± SEM, Two-Way ANOVA (for growth curves) and One-Way ANOVA (for flow cytometry results)
Fig. 7
Fig. 7
RNASET2 expression is down-regulated in monocytes and macrophages derived from prostate cancer samples compared with normal tissues. TISCH2 analysis of RNASET2 expression among the tumor microenvironment components of prostate cancer in 6 different datasets (GSE141445, GSE143791, GSE137829, GSE150692, GSE172301, and GSE176031) (A). GSE153892 [36] dataset showing CD45+ cells sorted from human prostatic tumoral (n = 3) and non-tumoral tissues (n = 3) was re-analyzed. UMAP-based 2D visualization describing cell clusters and distinct cell types represented by different color codes are shown together with overall RNASET2 expression (B). Volcano plot displays the results of differentially expression analysis and shows the up-regulated and down-regulated genes in prostate cancer patients’ tissues (PC) and non-tumoral tissues (HC) (C). To assess the different expression of RNASET2, samples were divided in non-tumoral tissues (HC) and prostate cancer tumoral tissues (PC) (D). Increased expression of RNASET2 in monocytes from healthy control subjects compared to monocytes from PCa patients, a detected in our small cohort of subjects, by flow cytometry (E). Correlation plot generated using the TIMER2 software to interrogate the relation between RNASET2 expression and M1 or M2 macrophage infiltration in PCa tumor tissues (F)
Fig. 8
Fig. 8
Effects of RNASET2 on anti-tumor activity and phagocytosis in THP-1 macrophages. Graphs illustrating the proliferation rate of wt of RNASET-2 silenced THP-1 cells (A). Representative images from immunofluorescence assay of PC-3 GFP+ clones #10 and #12 (B) and 22Rv1 GFP+ clones #2 and #3, (C) grown in co-culture with control, RNASET2-silenced pool and RNASET2-silenced (clone #50) THP-1 derived M0 macrophages (N = 3). Quantification of the % of green fluorescent area both for PCa clones was determined by XX (D). Data are shown as mean ± SEM, one-way ANOVA, **p < 0.01; ***p < 0.001, ****p < 0.0001. The phagocytosis activities of and RNASET2-silenced or parental THP-1 macrophages were tested by FACS analysis (N = 3), following FITC-dextran engulfment for 30, 60, 90, 120 min (E). Results at 120 min are shown as FACS histograms (F) and MFI dot-line graphs (G). As a control to block phagocytosis, both RNASET2-silenced or parental THP-1 macrophages were maintained at 4 °C, in presence of FITC dextran. Data are shown as mean ± SEM, student-T test, *p < 0.05

Similar articles

References

    1. Siegel RL, Miller KD, Fuchs HE, Jemal A. Cancer statistics, 2022. CA Cancer J Clin. 2022;72:7–33. - PubMed
    1. Sfanos KS, De Marzo AM. Prostate cancer and inflammation: the evidence. Histopathology. 2012;60:199–215. - PMC - PubMed
    1. de Bono JS, Guo C, Gurel B, De Marzo AM, Sfanos KS, Mani RS, Gil J, Drake CG, Alimonti A. Prostate carcinogenesis: inflammatory storms. Nat Rev Cancer. 2020;20:455–69. - PubMed
    1. Archer M, Dogra N, Kyprianou N. Inflammation as a driver of prostate Cancer metastasis and therapeutic resistance. Cancers (Basel) 2020;12. - PMC - PubMed
    1. De Marzo AM, Platz EA, Sutcliffe S, Xu J, Gronberg H, Drake CG, Nakai Y, Isaacs WB, Nelson WG. Inflammation in prostate carcinogenesis. Nat Rev Cancer. 2007;7:256–69. - PMC - PubMed