. 2025 May 20;20(1):59.
doi: 10.1186/s13024-025-00848-7.

Mutations in NEK1 cause ciliary dysfunction as a novel pathogenic mechanism in amyotrophic lateral sclerosis

Affiliations

Mutations in NEK1 cause ciliary dysfunction as a novel pathogenic mechanism in amyotrophic lateral sclerosis

Min-Young Noh et al. Mol Neurodegener. .

Abstract

Background: Neuronal primary cilia, vital for signaling and cell-cycle regulation, have been implicated in maintaining neuronal identity. While a link between primary ciliary defects and neurodegenerative diseases is emerging, the precise pathological mechanisms remain unclear.

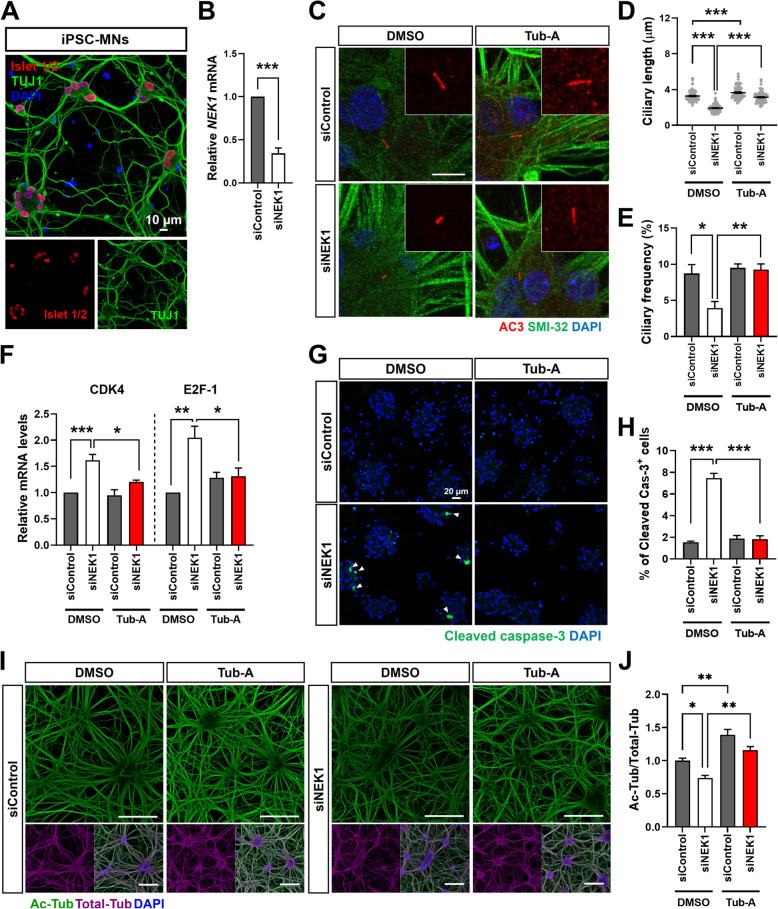
Methods: We studied the genetic contribution of NEK1 to ALS pathogenesis by analyzing the exome sequences of 920 Korean patients with ALS. To understand the disease contribution of NEK1 variants in ALS, we performed a series of functional studies using patient fibroblasts focusing on primary cilia and microtubule-related phenotypes. In addition, these findings were validated in iPSC-derived motor neurons (iPSC-MNs).

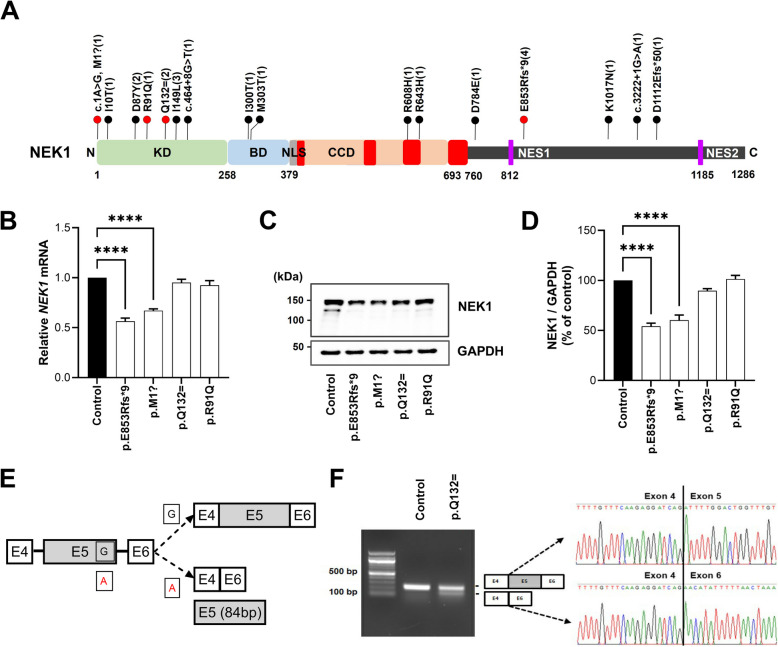
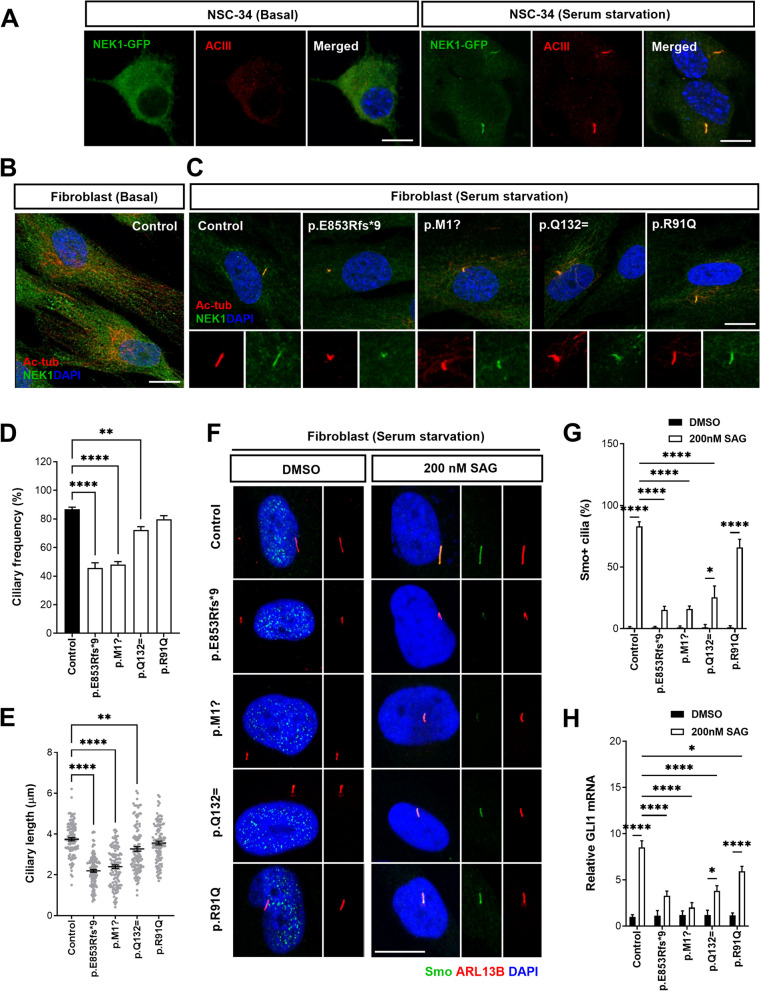
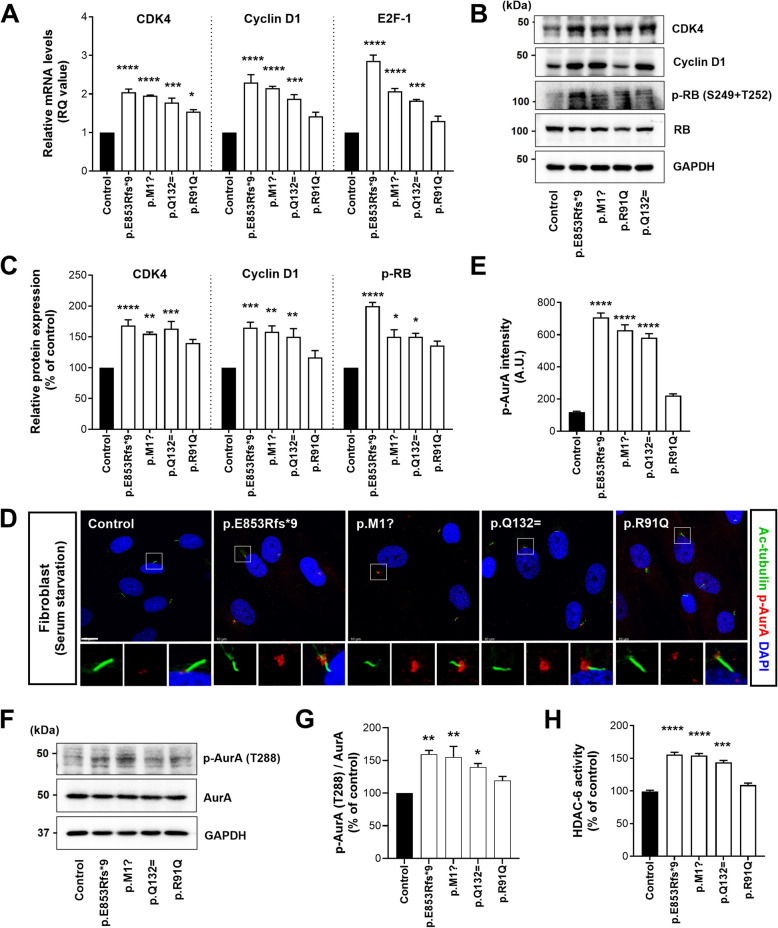
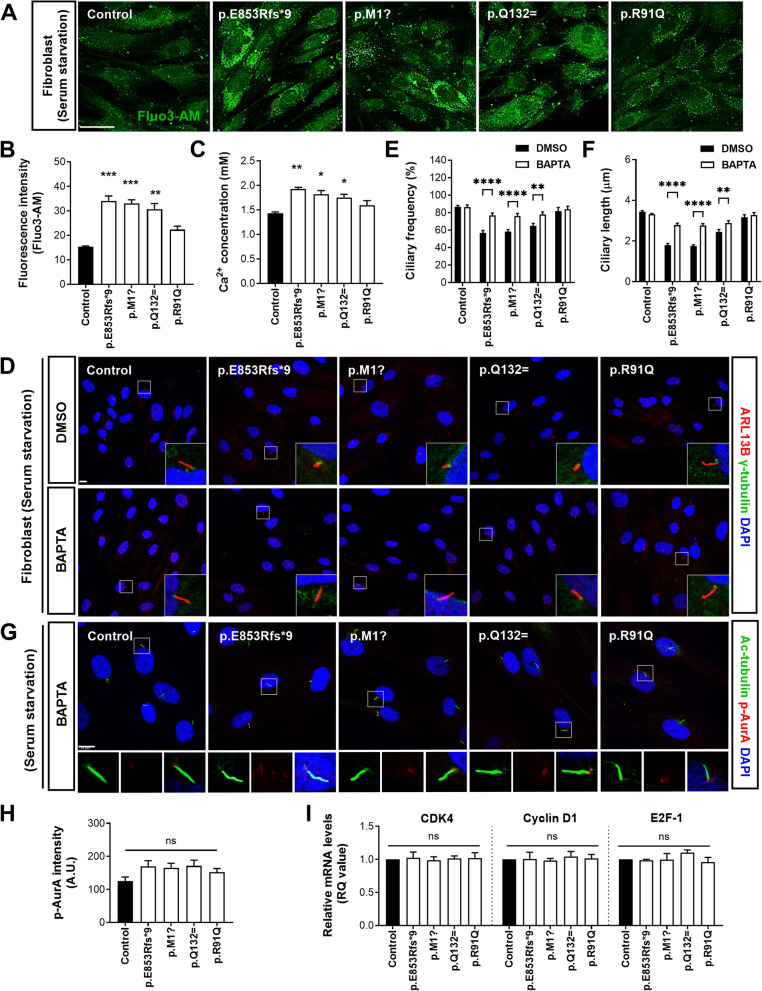
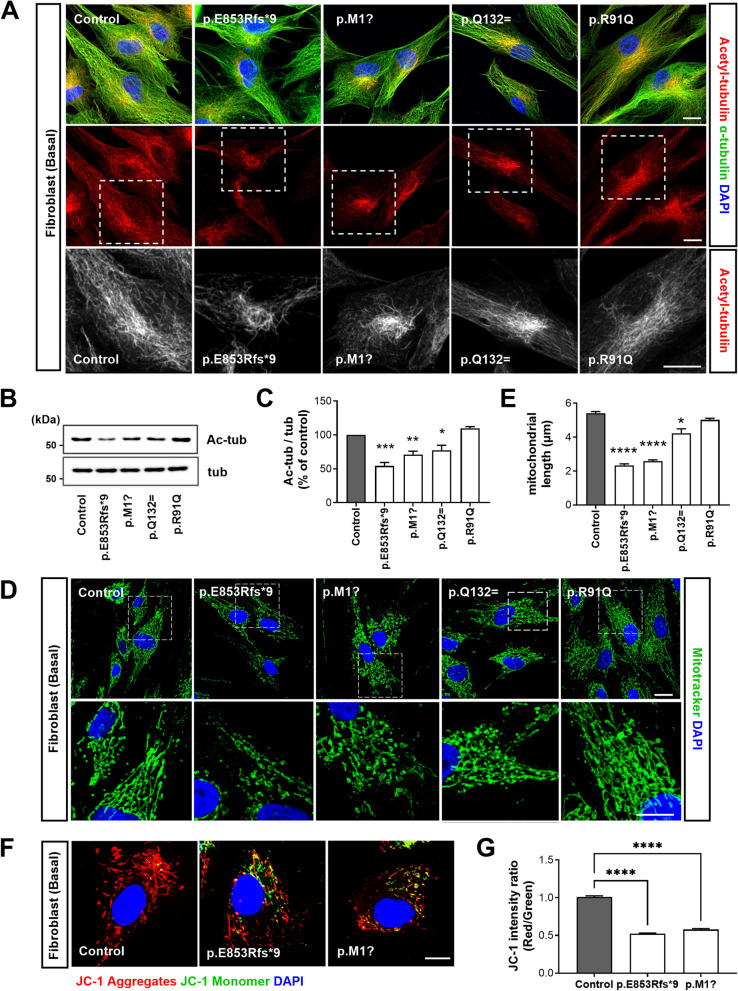
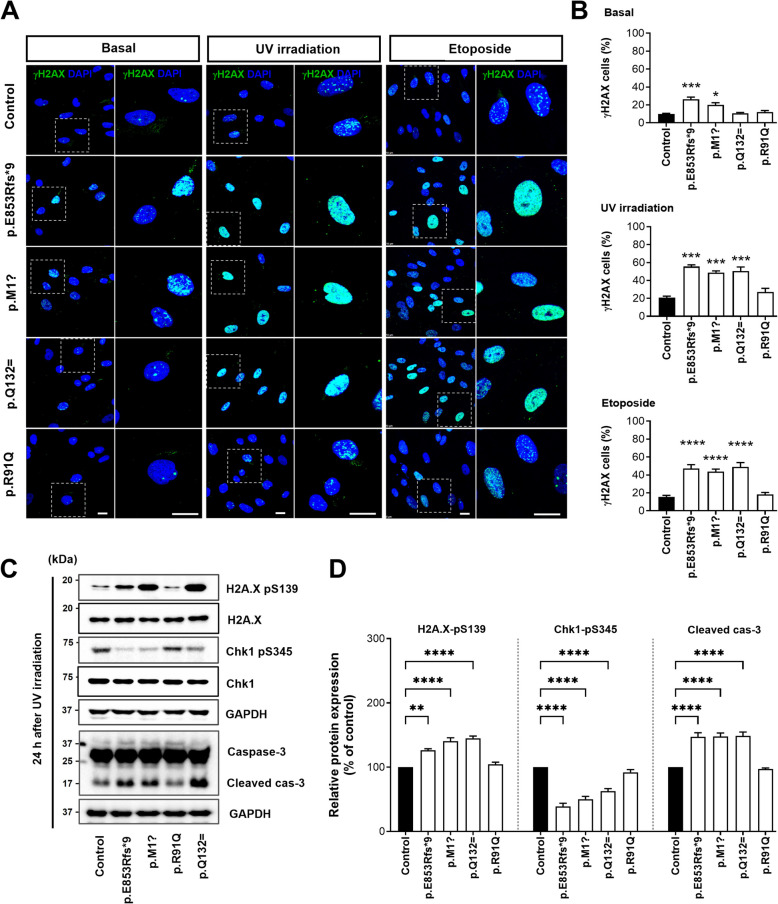
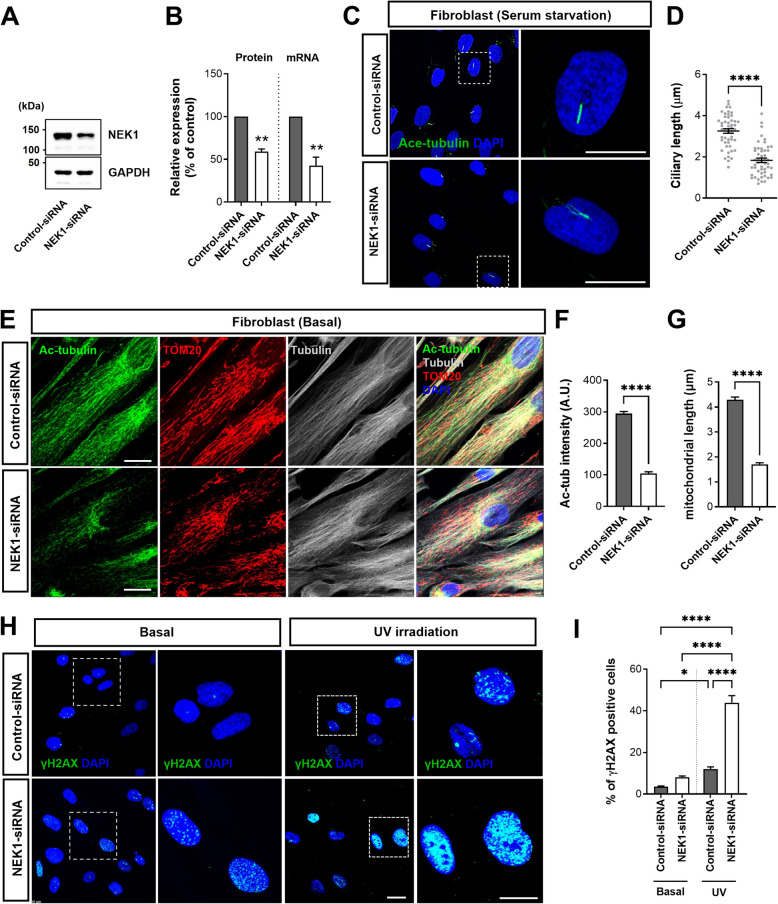
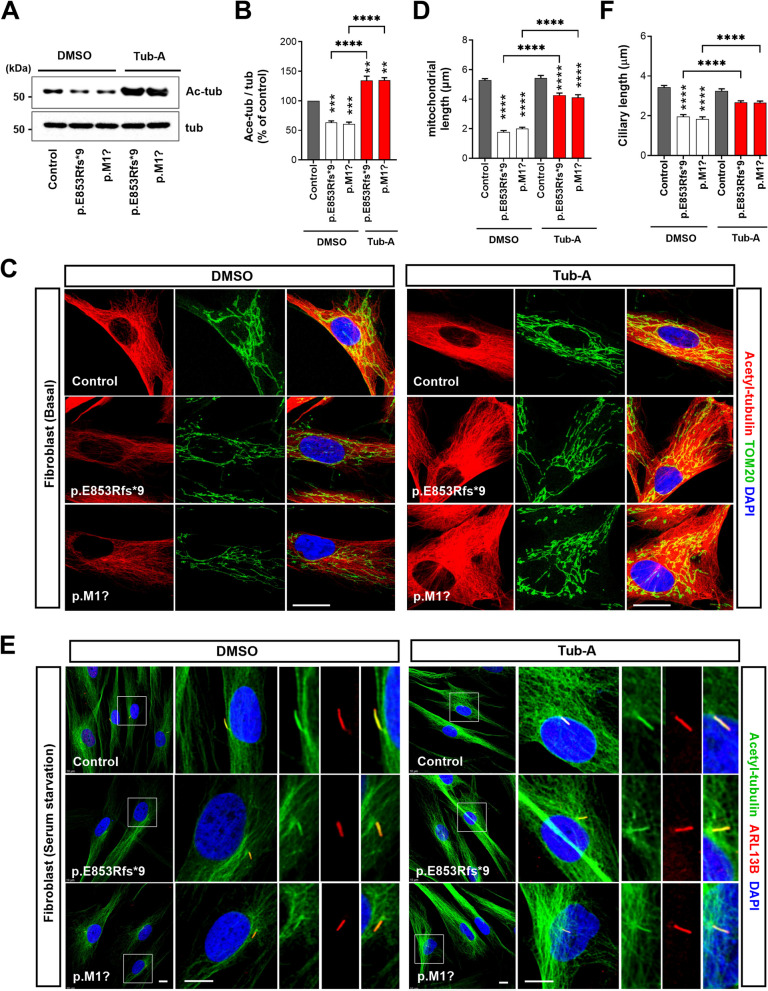
Results: NIMA-related kinase 1 (NEK1), a gene encoding a serine/threonine kinase involved in cell cycle regulation, has been identified as a risk gene for amyotrophic lateral sclerosis (ALS). Here, we report that mutations in NEK1 cause primary ciliary abnormality, cell cycle re-entry, and disrupted tubulin acetylation in ALS. We analyzed the whole-exome sequences of 920 Korean patients with sporadic ALS and identified 16 NEK1 variants in 23 patients. We found that two novel variants, p.E853Rfs*9 and p.M1?, reduced NEK1 expression, resulting in loss-of-function (LOF) and one synonymous splicing variant (p.Q132=) exhibited an aberrant isoform lacking exon 5. All three NEK1 variants exhibited abnormal primary ciliary structure, impaired sonic hedgehog signaling, and altered cell-cycle progression. Furthermore, the ALS-linked variants induced intracellular calcium overload followed by Aurora kinase A (AurA)-histone deacetylase (HDAC)6 activation, resulting in ciliary disassembly. These defects were restored by treatment with the intracellular Ca2+ chelator, BAPTA. We also found that NEK1 variants cause decreased α-tubulin acetylation, mitochondrial alteration, and impaired DNA damage response (DDR). Notably, drug treatment to inhibit HDAC6 restored the NEK1-dependent deficits in patient fibroblasts. And, we confirmed that data found in patient fibroblasts were reproduced in iPSC-MNs model.

Conclusions: Our results suggest that NEK1 contributes to ALS pathogenesis through the LOF mechanism, and HDAC6 inhibition provides an attractive therapeutic strategy for NEK1 variants associated ALS treatment.

Keywords: NEK1; Amyotrophic lateral sclerosis; Cell cycle; DNA damage response; Microtubule; Mitochondria; Primary cilia.


Conflict of interest statement

Declarations. Ethics approval and consent to participate: All participants provided written informed consent for the use of human-derived materials and clinical and genetic information for research purposes. This study was reviewed and approved by the IRB of Hanyang University. Consent for publication: The authors consent to the publication of this manuscript. Confidential patient data were not included in this study. Competing interests: The authors declare that they have no competing interests.

Figures

Fig. 1
Fig. 1
Identifying NEK1 variants in patients with ALS by exome sequencing. A Schematic representation of the NEK1’s domain structure exhibiting the kinase domain (KD), basic domain (BD), four coiled-coil domains (CCD), nuclear localization signal (NLS), and two nuclear export sequences (NES). The black text indicates each domain’s amino acid (a.a) position. Upward lollipops (black), shown in bold, indicate the variants identified; lollipops (red) indicate the variants from which skin fibroblasts were obtained. Numbers in parentheses indicate the number of affected individuals. Amino acids in the figure are indicated with the one-letter code instead of the three-letter code. B Relative NEK1 mRNA levels in the control and patient fibroblasts. Data represent mean ± standard errors of the mean (SEM) (from four independent experiments). Comparisons were made against the control (****P < 0.0001; one-way analysis of variance (ANOVA) with post-hoc Tukey’s tests). C Western blot analysis of NEK1 in the cell lysates from the control and patient fibroblasts. GAPDH was used as a loading control. D Quantification of the normalized NEK1 protein expression from three independent experiments. Data represent mean ± SEM. Comparisons were made against the control (****P < 0.0001; one-way ANOVA with post hoc Tukey’s tests). E Schematic representation of the wild-type and mutant (c.396G>A, p.Q132=) sequences. Boxes indicate the exons (E4, E5, and E6) and lines indicate introns. The sequence surrounding the exon 5 donor splice site of the wild-type G and mutant A is indicated. The diagonal dashed lines represent two possible splicing patterns (E5 inclusion or skipping), and the two possible resulting splice products are shown schematically on the right panel. NEK1 exon 5 splicing assay. Total RNA extracted from the control and patient fibroblasts carrying the p.Q132= variant was analyzed via reverse transcription polymerase chain reaction to detect inclusion or skipping of exon 5 (see schematic diagrams in E). The c.396G>A variant produced two bands in the gel images. The smaller band corresponds to the aberrant splicing of exon 5, resulting in complete exon skipping, as confirmed through Sanger sequencing. Sequence chromatograms illustrate the read-through at each exon junction, and sequence alignment indicates exon 5 deletion
Fig. 2
Fig. 2
ALS-linked NEK1 variants perturb primary ciliogenesis and Shh signaling in patient fibroblasts. A Subcellular distribution of GFP-tagged NEK1 WT in transfected NSC-34 cells under basal culture conditions (left panel) or serum starvation for 48 h (right panel). Fluorescence images of the primary cilia in the transfected NSC-34 cells. Cells were stained with ACIII (red, neuronal cilia marker). Nuclei were stained with DAPI. Scale bar: 10 µm. B Representative fluorescence images of endogenous NEK1 (green) and acetylated α-tubulin (red, ciliary axoneme marker) in control fibroblasts under basal culture conditions. Nuclei were stained with DAPI. Scale bar: 10 µm. C Representative fluorescence images of endogenous NEK1 (green) and acetylated α-tubulin (red, ciliary axoneme marker) for primary cilia formation in control and patient fibroblasts stimulated with serum starvation for 48 h. The bottom panels indicate higher magnification views of the primary ciliary regions. Nuclei were stained with DAPI. Scale bar: 10 µm. D-E Quantification of the ciliary frequency (D) and the ciliary length (E) in C. The >100 cells per condition were quantified per replicate experiment (n = 3). Data represent mean ± SEM. Comparisons were made against the control (**P < 0.01, ****P < 0.0001; one-way ANOVA with post-hoc Tukey’s tests). F Representative fluorescence images of Smo (green) and ARL13B (red, cilia marker) in the control and patient fibroblasts stimulated with serum starvation for 48 h. We examined the Smo translocation to the cilium in response to the Shh ligand-mediated signaling in the fibroblasts treated with DMSO or 200 nM Smo agonist (SAG) for 24 h. The right panels illustrate higher magnification views of the primary ciliary regions. Nuclei were stained with DAPI. Scale bar: 10 µm. G Quantification of Smo+ cells frequency in F. The >100 cells per condition were quantified per replicate experiment (n = 3). Data represent mean ± SEM. Comparisons were made against the DMSO-treated fibroblast (*P < 0.05, ****P < 0.0001; one-way ANOVA with post-hoc Tukey’s tests). H Relative changes in the GLI1 mRNA levels in the control and patient fibroblasts treated with DMSO or 200 nM SAG for 24 h. Data represent mean ± SEM (from three independent experiments). Comparisons were made against the DMSO-treated fibroblasts (*P < 0.05, ****P < 0.0001; one-way ANOVA with post-hoc Tukey’s tests)
Fig. 3
Fig. 3
ALS-linked NEK1 variants demonstrate aberrant cell cycle progression and activated ciliary disassembly axis in patient fibroblasts. A Relative mRNA levels of the cell cycle regulators (CDK4, Cyclin D1, and E2F-1) from G1 to S phase in the control and patient fibroblasts stimulated with serum starvation for 48 h. Data represent mean ± SEM (from three independent experiments). Comparisons were made against the control (*P < 0.05, ***P < 0.001, ****P < 0.0001; one-way ANOVA with post-hoc Tukey’s test). B Western blot analysis of the control and patient fibroblasts stimulated with serum starvation for 48 h using anti-CDK4, anti-Cyclin D1, anti-p-RB (S249+T252), and anti-RB antibodies. GAPDH was used as a loading control. C Quantification of the normalized CDK4, Cyclin D1, and p-RB (S249+T252) protein expression from three independent experiments. CDK4 and Cyclin D1 intensities were normalized to GAPDH. p-RB (S249+T252) intensities were normalized to total RB. Data represent mean ± SEM.Comparisons were made against the control (*P < 0.05, **P < 0.01, ***P < 0.001, ****P < 0.0001; one-way ANOVA with post-hoc Tukey’s tests). D Representative fluorescence images of the activated AurA (p-AurA) in control and patient fibroblasts stimulated with serum starvation for 48 h. Cells were stained with p-AurA (phosphorylated T288) (red), acetylated α-tubulin (green, ciliary axoneme marker), and DAPI (blue). Scale bar: 10 µm. The lower panels illustrate higher magnification views of the cilia. E Quantification of p-AurA (red) intensity at the ciliary base described in D. The >100 cells per condition were quantified per replicate experiment (n = 3). Data represent mean ± SEM. Comparisons were made against the control (****P < 0.0001; one-way ANOVA with post-hoc Tukey’s test). F Western blot analysis of the control and patient fibroblasts stimulated with serum starvation for 48 h using anti-phospho-AurA (T288) and anti-AurA antibodies. GAPDH was used as a loading control. G Quantification of the normalized p-AurA protein expression from three independent experiments. p-AurA intensity was normalized to total AurA. Data represent mean ± SEM.Comparisons were made against the control (*P < 0.05, **P < 0.01; one-way ANOVA with post-hoc Tukey’s tests). H Quantification of the HDAC6 activity in the control and patient fibroblasts stimulated with serum starvation for 48 h from three independent experiments. Data represent mean ± SEM.Comparisons were made against the control (***P < 0.001, ****P < 0.0001; one-way ANOVA with post-hoc Tukey’s test)
Fig. 4
Fig. 4
ALS-linked NEK1 variants impair intracellular Ca2+ homeostasis and regulate cilia in a Ca2+-dependent manner. A Representative images of the cytosolic Ca2+ in the control and patient fibroblasts stimulated with serum starvation for 48 h. Fluo3-AM, a calcium indicator with green fluorescence, was visualized using confocal microscopy. Scale bar: 10 µm. B Fluorescence intensities of Fluo 3-AM images (A) of cytosolic Ca2+ were quantified using ImageJ with low-power field images. Data represent mean ± SEM (from three independent experiments). Comparisons were made against the control (**P < 0.01, ***P < 0.001; one-way ANOVA with post-hoc Tukey’s test). C Quantitative analysis of the intracellular Ca2+ concentration in the control and patient fibroblasts stimulated with serum starvation for 48 h. Data represent mean ± SEM (from three independent experiments). Comparisons were made against the control (*P < 0.05, **P < 0.01; one-way ANOVA with post-hoc Tukey’s test). D Representative fluorescence images of the primary cilia in the starved control and patient fibroblasts treated with DMSO or 10 µM of the Ca2+ chelator BAPTA for 60 min. The cilia and basal bodies were visualized with antibodies against ARL13B (red) and γ-tubulin (green), respectively. The nuclei were stained with DAPI (blue). The right panels exhibit higher magnification views of the cilia and basal body. Scale bar: 10 µm. E-F Quantification of the ciliary frequency (E) and ciliary length (F) in D. The >100 cells per condition were quantified per replicate experiment (n = 3). Data represent mean ± SEM. Comparisons were made against the DMSO-treated fibroblasts (**P < 0.01, ****P < 0.0001; one-way ANOVA with post hoc Tukey’s tests). G Representative fluorescence images of activated AurA (p-AurA) in the starved control and patient fibroblasts treated with DMSO or 10 µM of the Ca2+ chelator BAPTA for 60 min. Cells were stained with p-AurA (phosphorylated T288) (red), acetylated α-tubulin (green, ciliary axoneme marker), and DAPI (blue). The lower panels demonstrate higher magnification views of the cilia. Scale bar: 10 µm. H Quantification of p-AurA (phosphorylated T288, red) intensity at the ciliary base described in G. The >100 cells per condition were quantified per replicate experiment (n = 3). Data represent mean ± SEM. Comparisons were made against the control (ns, not significant; one-way ANOVA with post-hoc Tukey’s test). I Relative mRNA levels of the cell cycle regulators (CDK4, Cyclin D1, and E2F-1) from G1 to S phase in control and patient fibroblasts pretreated with 10 µM BAPTA for 60 min and stimulated with serum starvation for 48 h. Data represent mean ± SEM (from three independent experiments). Comparisons were made against the control (ns, not significant; one-way ANOVA with post-hoc Tukey’s test)
Fig. 5
Fig. 5
ALS-linked NEK1 variants impaired tubulin acetylation and mitochondrial distribution in patient fibroblasts. A Representative fluorescence images of the acetylated α-tubulin (red) and α-tubulin (green) in control and patient fibroblasts under basal culture conditions. The bottom panels illustrate higher magnification views of white box regions. The nuclei were stained with DAPI. Scale bar: 10 µm. B Western blot analysis of the NEK1 patient and control fibroblast lysates using anti-acetylated α-tubulin and anti-α-tubulin antibodies. C Quantification of normalized expression of acetylated α-tubulin (Ac-tub) from three independent experiments. Ac-tub intensities were normalized to total α-tubulin (tub). Data represent mean ± SEM. Comparisons were made against the control (*P < 0.05, **P < 0.01, ***P < 0.001; one-way ANOVA with post-hoc Tukey’s tests). D Representative fluorescence images of the mitochondria distribution in the control and patient fibroblasts labeled with MitoTracker Green FM (green). The bottom panels illustrate higher magnification views of the white box regions. The nuclei were stained with DAPI. Scale bar: 10 µm. E Quantification of the mitochondrial length in D. The >50 cells per condition were quantified per replicate experiment (n = 3). Data represent mean ± SEM. Comparisons were made against the control (*P < 0.05, ****P < 0.0001; one-way ANOVA with post-hoc Tukey’s test). F Fluorescence images of the mitochondrial membrane potential (Δψm) using JC-1 dye-loaded control and NEK1-LOF patient fibroblasts. The abnormal accumulation of green-fluorescent JC-1 monomers in the mitochondria of NEK1-LOF patients but not control cells. Nuclei were stained with DAPI. Scale bar: 10 μm. G Mitochondrial membrane potential was quantified by analysis of the red-to-green fluorescence intensity ratio for the JC-1 probe. The >50 cells per condition were quantified per replicate experiment (n = 3). Data represent mean ± SEM. Comparisons were made against the control (****P < 0.0001; one-way ANOVA with post-hoc Tukey’s test)
Fig. 6
Fig. 6
ALS-linked NEK1 variants impaired DNA damage repair after ultraviolet (UV) irradiation or etoposide treatment in patient fibroblasts. A Representative fluorescence images of DNA damage response after UV irradiation or etoposide treatment in control and NEK1 patient fibroblasts. Cells were stained with γH2AX (S139) (green, DNA damage marker) and DAPI (blue) either under basal condition, 24 h after 20 J/m2 UV irradiation, or 24 h after 20 μM etoposide treatment. The right panels illustrate higher magnification views of the white box regions. Scale bar: 10 µm. B Quantification of the γH2AX-positive cells in A. The >50 cells per condition were quantified per replicate experiment (n = 3). Data represent mean ± SEM. Comparisons were made against the control (*P < 0.05, ***P < 0.001, ****P < 0.0001; one-way ANOVA with post-hoc Tukey’s test). C Western blot analysis of the lysates from the control and NEK1 patient fibroblasts at the time point of 24 h after UV irradiation using anti-γH2AX-pS139, anti-γH2AX, anti-Chk1-pS345, anti-Chk1, and anti-caspase-3 antibodies. GAPDH was used as a loading control. D Quantification of normalized expression of γH2AX-pS139, Chk1-pS345, and cleaved caspase-3 from three independent experiments.The band intensities of γH2AX-pS139 were normalized to the γH2AX intensity. The band intensities of Chk1-pS345 were normalized to the Chk1 intensity. The band intensities of cleaved caspase-3 (17 kDa) were normalized to the intensity of caspase-3 (35 kDa). Data represent mean ± SEM. Comparisons were made against the control (**P < 0.01, ****P < 0.0001; one-way ANOVA with post-hoc Tukey’s test)
Fig. 7
Fig. 7
Loss of NEK1 due to siRNA knockdown in the fibroblasts affects cilia formation, tubulin acetylation, mitochondrial distribution, and DNA damage repair. A Western blot analysis of NEK1 in the NEK1 knockdown (KD) lysates using a siRNA in the control fibroblasts. GAPDH was used as a loading control. B Quantification of normalized NEK1 protein and mRNA expression. Data represent mean ± SEM (from three independent experiments). Comparisons were made against the control-siRNA (**P < 0.01; Student’s t-test). C Representative fluorescence images of the primary ciliary formation by NEK1 KD in the control fibroblasts were stained with acetylated α-tubulin (green, ciliary axoneme marker) and DAPI (blue). The right panels illustrate higher magnification views of the white box regions. Scale bar: 10 µm. D Quantification of the ciliary length in C. The >100 cells per condition were quantified per replicate experiment (n = 3). Data represent mean ± SEM. Comparisons were made against the control-siRNA (****P < 0.0001; Student’s t-test). E Representative fluorescence images of the tubulin acetylation and mitochondrial distribution by NEK1 KD in the control fibroblasts. Cells were stained with acetylated α-tubulin (red), TOM20 (green, mitochondrial marker), α-tubulin (gray), and DAPI (blue). The lower panels illustrate the higher magnification views of the white box regions. Scale bar: 10 µm. F Quantification of acetylated α-tubulin (Ac-tub) intensity (F) and the mitochondrial length (G) described in E. The >50 cells per condition were quantified per replicate experiment (n = 3). Data represent mean ± SEM. Comparisons were made against the control-siRNA (****P < 0.0001; Student’s t-test). H Representative fluorescence images of DNA damage response in the NEK1 KD fibroblasts. Cells were fixed either in basal condition (without irradiation) or at 24 h after UV irradiation. Cells were stained with γH2AX (S139) (green, DNA damage marker) and DAPI (blue). The right panels show the higher magnification views of the white box regions. Scale bar: 10 µm. I Quantification of the γH2AX-positive cells in G. The >50 cells per condition were quantified per replicate experiment (n = 3). Data represent mean ± SEM. Comparisons were made against the control-siRNA (*P < 0.05, ****P < 0.0001; one-way ANOVA with post-hoc Tukey’s test)
Fig. 8
Fig. 8
NEK1-LOF abnormality in the ALS fibroblasts rescued by pharmacological inhibition of HDAC6. A Western blot analysis of the lysates from DMSO or tubastatin A (Tub-A)-treated control and NEK1-LOF (p.E853Rfs*9 and p.M1?) patient fibroblasts using anti-acetylated α-tubulin (Ac-tub) and anti-α-tubulin (tub) antibodies. α-tubulin (tub) was used as a loading control. B Quantification of the normalized acetylated α-tubulin (Ac-tub) protein expression. Ac-tub intensities were normalized to that of the α-tubulin (tub). Data represent mean ± SEM (from three independent experiments). Comparisons were made against the DMSO-treated control (**P < 0.01, ***P < 0.001, ****P < 0.0001; one-way ANOVA with post-hoc Tukey’s test). C Representative fluorescence images of the tubulin acetylation and mitochondrial distribution in control and NEK1-LOF (p.E853Rfs*9 and p.M1?) patient fibroblasts by Tub-A treatment. Cells were treated with DMSO or 1 μM Tub-A for 24 h and then stained with anti-acetylated α-tubulin antibody (red), TOM20 (green, mitochondrial marker), and DAPI (blue). Scale bar: 10 µm. D Quantification of the mitochondrial length in C. The >50 cells per condition were quantified per replicate experiment (n = 3). Data represent mean ± SEM. Comparisons were made against the DMSO-treated control (****P < 0.0001; one-way ANOVA with post-hoc Tukey’s test). E Representative fluorescence images of the primary cilia formation in the control and NEK1-LOF (p.E853Rfs*9 and p.M1?) patient-derived fibroblasts pretreated with DMSO or 1 μM Tub-A. Cells were stained with acetylated α-tubulin (green, ciliary axoneme marker) and ARL13B (green, ciliary membrane marker) after serum starvation for 48 h. The right panels show the higher-magnification views of the primary ciliary regions. Scale bar: 10 µm. F Quantification of the ciliary length in E. The >100 cells per condition were quantified per replicate experiment (n = 3). Data represent mean ± SEM. Comparisons were made against the DMSO-treated control (****P < 0.0001; one-way ANOVA with post-hoc Tukey’s test)
Fig. 9
Fig. 9
HDAC6 inhibition rescues ciliary defects, tubulin acetylation, and neuronal cell death in NEK1-knockdowned iPSC-MNs. A Representative image of iPSC-MNs stained with Islet1/2 (red), TUJ1 (green), and DAPI (blue). Scale bar: 10 µm. B Fold change in NEK1 mRNA levels in control siRNA (siControl) and NEK1 siRNA (siNEK1)-treated iPSC-MNs. Data represent mean ± SEM (n = 5). Comparisons were made against the siControl (***P < 0.001; Student’s t-test). C Representative fluorescence images of primary cilia formation from iPSC-MNs. Cells were treated with DMSO or 1 μM Tub-A for 24 h and then stained with anti-ACIII (red, neuronal cilia marker), SMI-32 (green, motor neuron marker), and DAPI (blue). Scale bar: 10 µm. D-E Quantification of the ciliary length (D) and ciliary frequency (E) in C. The >90 cells per condition were quantified per replicate experiment (n = 4). Data represent mean ± SEM. Comparisons were made against the DMSO-treated siControl (*P < 0.05, **P < 0.01, ****P < 0.0001; one-way ANOVA with post hoc Tukey’s tests). F Relative mRNA levels of the cell cycle regulators (CDK4 and E2F-1) from G1 to S phase in siControl and siNEK1-treated iPSC-MNs following DMSO or Tub-A treatment. Data represent mean ± SEM (n = 4). Comparisons were made against the DMSO-treated siControl (*P < 0.05, **P < 0.01, ***P < 0.001; one-way ANOVA with post-hoc Tukey’s test). G. Representative fluorescence images stained with cleaved caspase‐3 (green) and DAPI (blue) in siControl and siNEK1-treated iPSC-MNs following DMSO or Tub-A treatment. DAPI (blue) was used to detect nuclei. Scale bar: 20 µm. H Quantification of cleaved Cas-3-positive cells in G. Data represent mean ± SEM (n = 8). Comparisons were made against the DMSO-treated siControl (***P < 0.001; one-way ANOVA with post hoc Tukey’s tests). I Representative fluorescence images of the acetylated α-tubulin (green) and α-tubulin (purple) in siControl and siNEK1-treated iPSC-MNs following DMSO or Tub-A treatment. DAPI (blue) was used to detect nuclei. Scale bar: 100 µm. J Quantification of acetylated α-tubulin (Ac-Tub) intensity in I. Data represent mean ± SEM (n = 3). Comparisons were made against the DMSO-treated siControl (*P < 0.05, **P < 0.01; one-way ANOVA with post hoc Tukey’s tests)

Similar articles

References

    1. Brown RH, Al-Chalabi A. Amyotrophic lateral sclerosis. N Engl J Med. 2017;377(2):162–72. - PubMed
    1. Taylor JP, Brown RH Jr, Cleveland DW. Decoding ALS: from genes to mechanism. Nature. 2016;539(7628):197–206. - PMC - PubMed
    1. Nguyen HP, Van Broeckhoven C, van der Zee J. ALS genes in the genomic era and their Implications for FTD. Trends Genet. 2018;34(6):404–23. - PubMed
    1. Guo W, Vandoorne T, Steyaert J, Staats KA, Van Den Bosch L. The multifaceted role of kinases in amyotrophic lateral sclerosis: genetic, pathological and therapeutic implications. Brain. 2020;143(6):1651–73. - PMC - PubMed
    1. Brenner D, Muller K, Wieland T, Weydt P, Bohm S, Lule D, Hubers A, Neuwirth C, Weber M, Borck G, et al. NEK1 mutations in familial amyotrophic lateral sclerosis. Brain. 2016;139(Pt 5):e28. - PubMed

LinkOut - more resources