. 2025 May 19;44(1):151.
doi: 10.1186/s13046-025-03400-z.

ANXA1 promotes intrahepatic cholangiocarcinoma proliferation and growth by regulating glutamine metabolism through GOT1 stabilization

Affiliations

ANXA1 promotes intrahepatic cholangiocarcinoma proliferation and growth by regulating glutamine metabolism through GOT1 stabilization

Yanyu Gong et al. J Exp Clin Cancer Res. .

Abstract

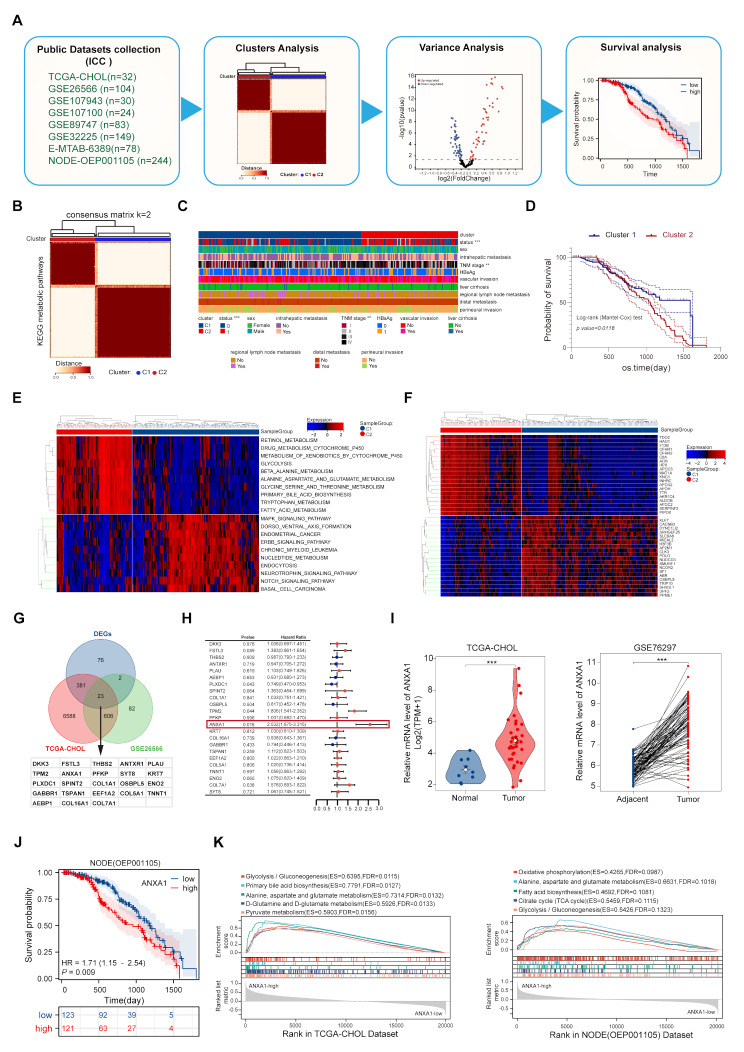
Background: Intrahepatic cholangiocarcinoma (ICC) is a malignant tumor with a poor prognosis, marked by a postoperative recurrence rate of 50-60% and a 5-year survival rate of 8-30%. Abnormal tumor metabolism, particularly, amino acid metabolism, plays a key role in malignant progression. However, the molecular mechanisms linking amino acid metabolism to ICC progression remain unclear.

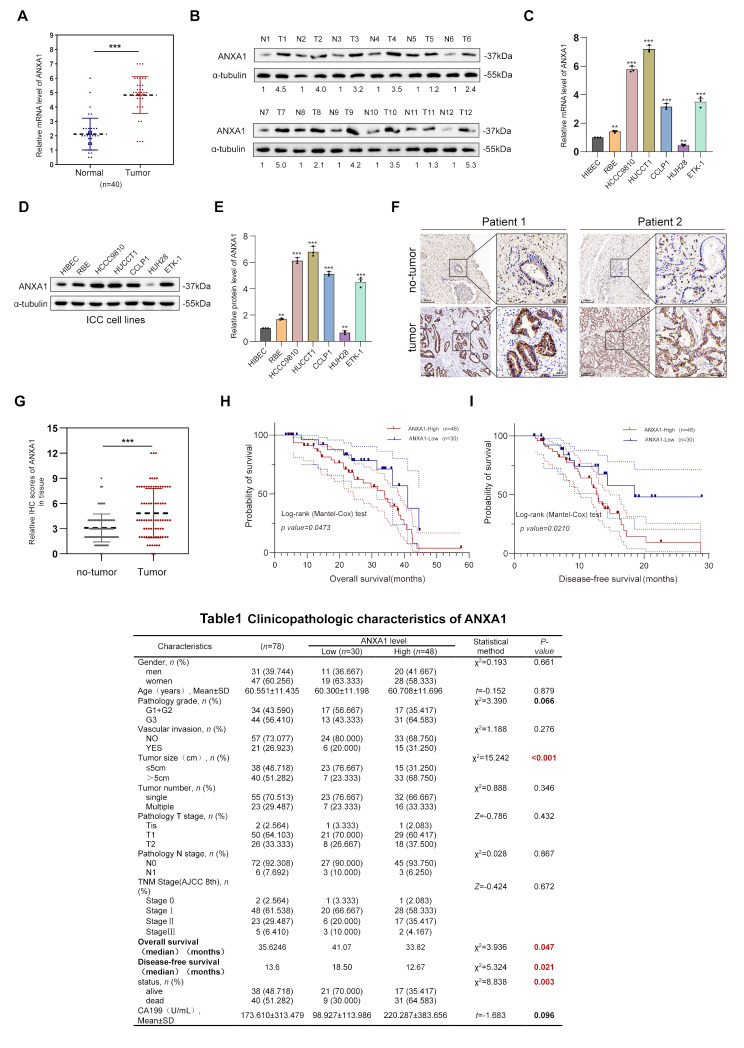
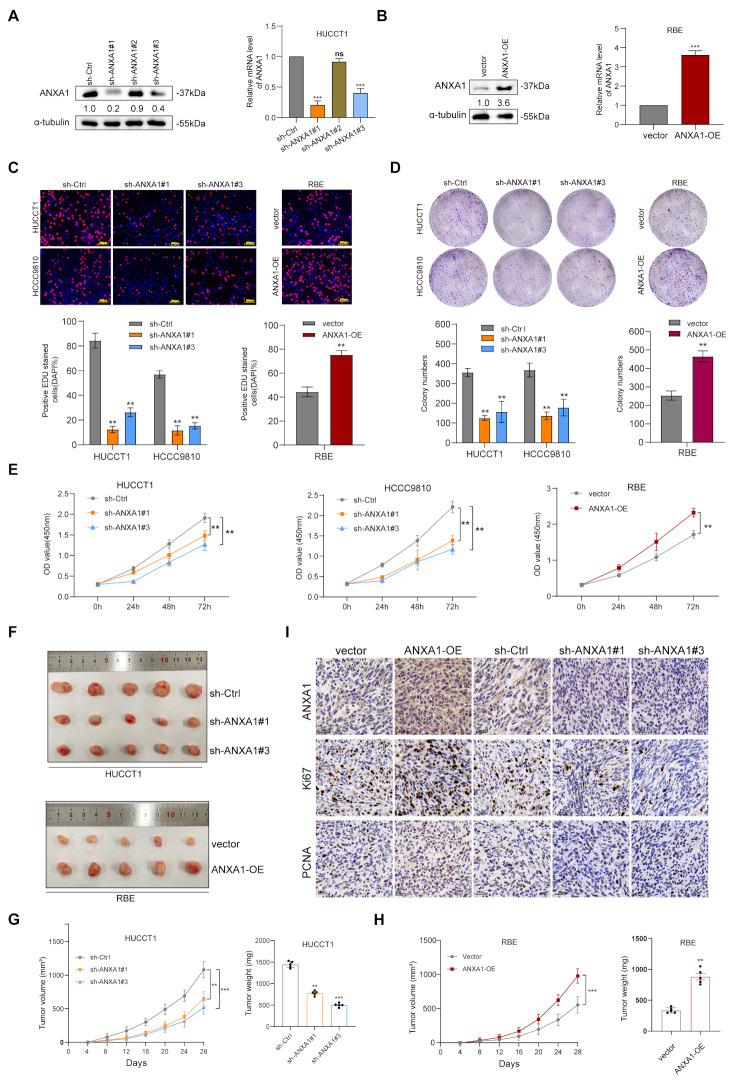
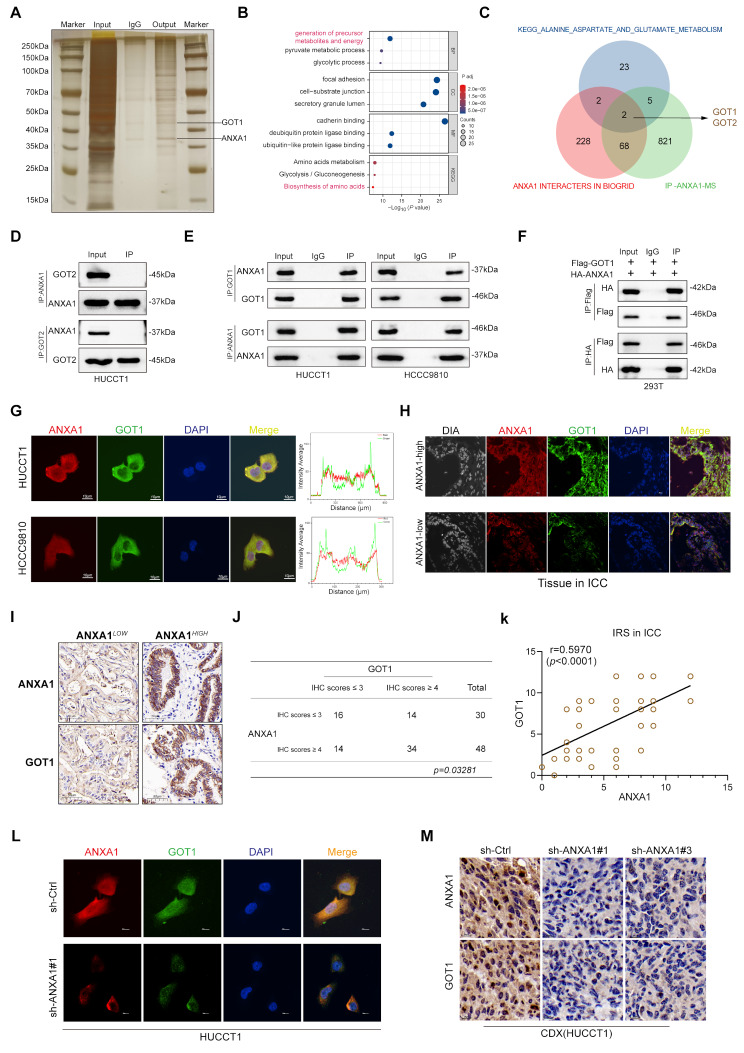
Methods: Bioinformatics was used to identity the key amino acid metabolism related gene in ICC, qRT-PCR, western blotting and immunohistochemical (IHC) were used to detect the expression of ANXA1 in normal tissues or ICC tissues and cells at mRNA and protein levels. The effects of ANXA1 on the proliferation ability of ICC in vitro and in vivo were investigated using CCK8, cloning formation experiment, EdU, IHC, nude mice subcutaneous tumorigenesis model. Immunoprecipitation, mass spectrometry analysis, protein ubiquitin level detection test, immunofluorescence co-localization, and redox stress metabolite detection test were used to explore the metabolism-related regulatory mechanism of ANXA1.

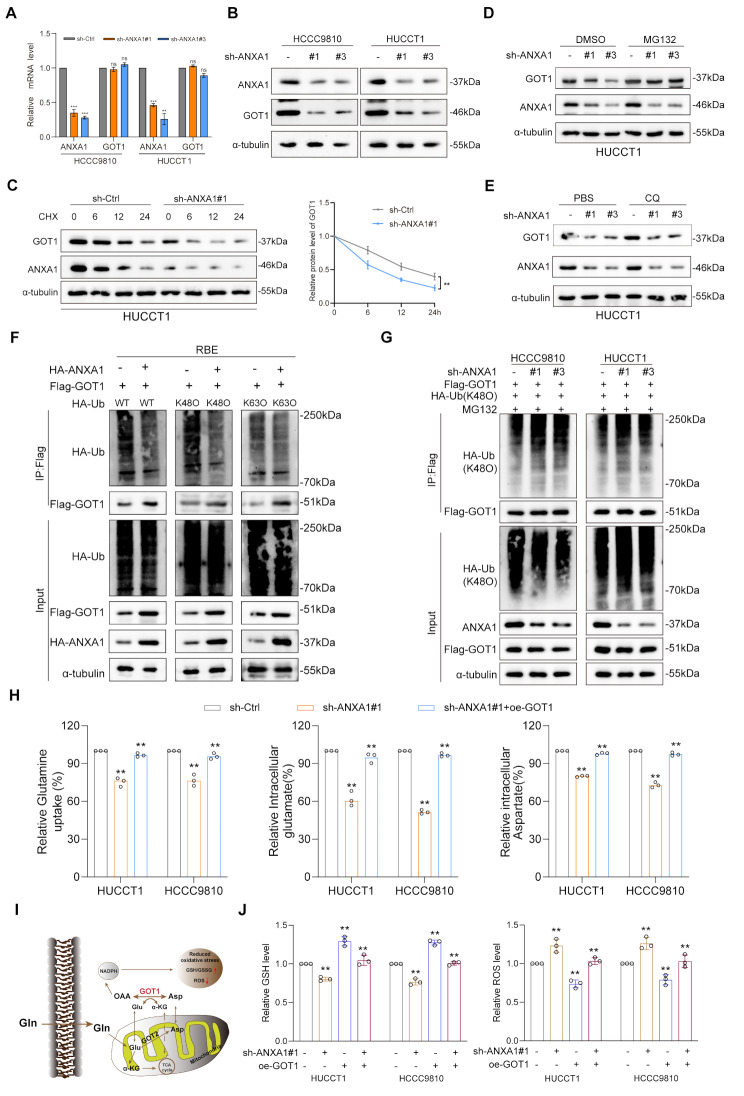
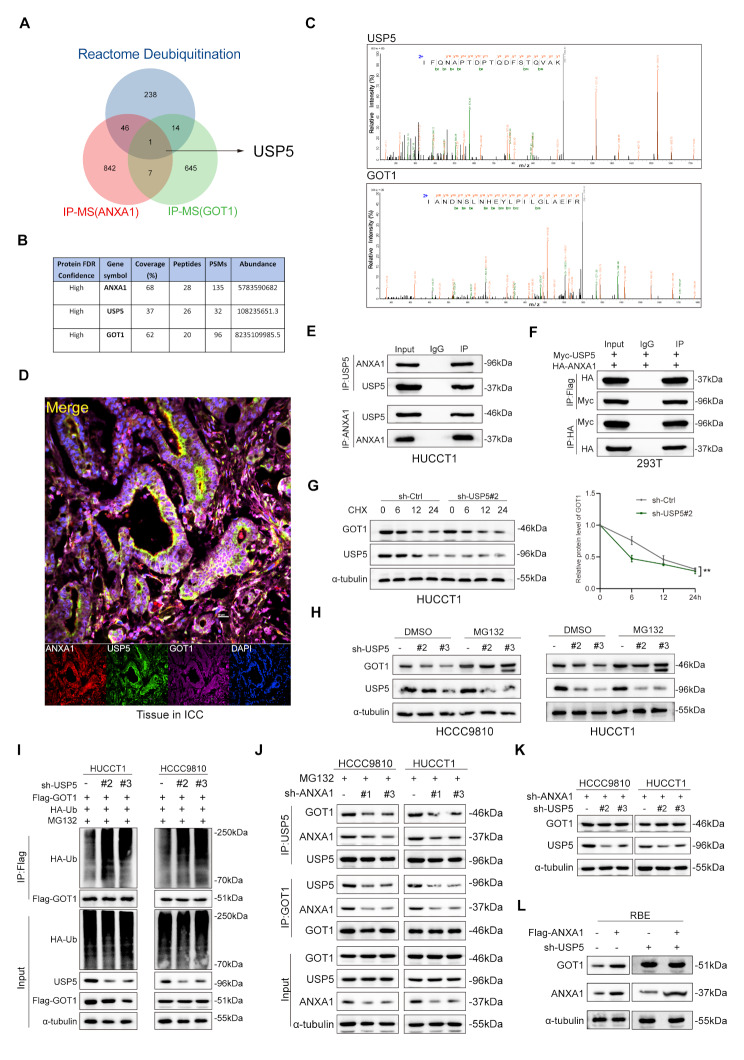
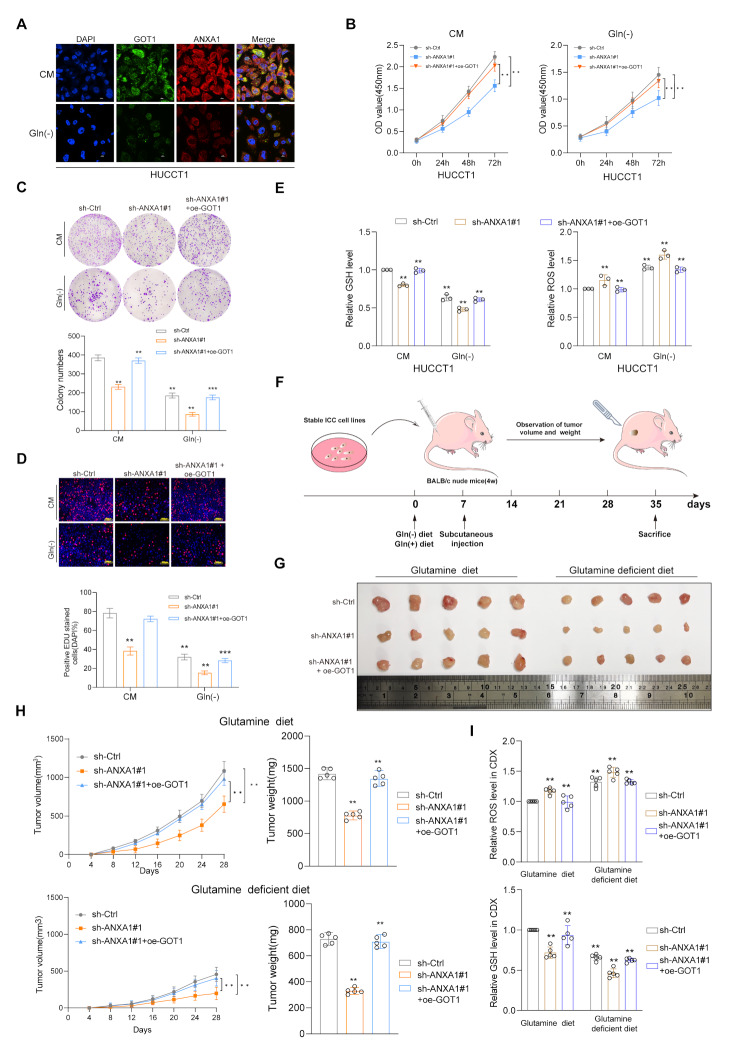
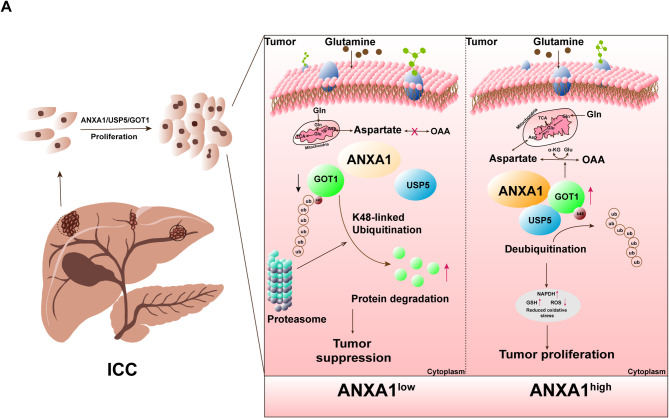
Results: we employed bioinformatics analysis to classify ICC into metabolic subgroups with distinct prognoses and identified the associated biomarker Annexin A1(ANXA1), whose high expression is correlated with poor prognosis and promotes ICC development. Mass spectrometry analysis revealed that ANXA1 interacts with the key enzyme in glutamine metabolism, glutamic-oxaloacetic transaminase 1(GOT1). Through in vitro and in vivo experiments, overexpressed ANXA1 stabilizes GOT1 by recruiting the deubiquitinase USP5. This stabilization enhances glutamine uptake, as well as the production of aspartate and glutamate, which in turn reduces oxidative stress, thereby promoting tumor cell growth. Moreover, knockdown of ANXA1 combined with glutamine uptake inhibition significantly suppressed ICC cell proliferation and Inhibited subcutaneous tumor formation and growth.

Conclusions: These results suggest that the ANXA1/USP5/GOT1 axis promotes glutamine metabolism and ICC proliferation and growth. Inhibiting ANXA1 alongside glutamine uptake inhibition offers a promising strategy for treating ICC.

Keywords: ANXA1; GOT1; Glutamine metabolism; ICC; Oxidative stress.


Conflict of interest statement

Declarations. Ethics approval and consent to participate: The study was supported by the ethics committee of the first affiliated hospital of Guizhou Medical University and the Animal Care and Treatment Committee of Guizhou Medical University. Consent for publication: All the authors agreed to publish the study in the journal. Competing interests: The authors declare no competing interests. relationships that could have appeared to influence the work reported in this paper.

Figures

Fig. 1
Fig. 1
Identification of genes highly associated with metabolism and prognosis of ICC using bioinformatics. A: Workflow for the screening process. B: Consensus clustering analysis based on 76 KEGG metabolic pathways from 744 ICC RNA-seq. C: Heatmap of clinical characteristics with survival information. D: Survival difference between the two metabolic clusters (Log-rank test). E: Top 10 differential metabolic pathways between the two clusters. F: Top 20 differential genes between the two metabolic clusters. G: Intersection of differential metabolic genes with TCGA-CHOL and GSE26566. H: Univariate COX regression analysis of 23 metabolic differential genes. I: Expression levels of ANXA1 in TCGA-CHOL (Mann–Whitney U test, ***, p < 0.001) and GSE76297(Wilcoxon matched-pairs test, ***, p < 0.001). J: Kaplan-Meier analysis of overall survival in low and high ANXA1 expression groups in dataset OEP00001105(Log-rank test). K: Top 5 metabolic pathways from the single-gene GSEA enrichment analysis of ANXA1 in the TCGA-CHOL and NODE (OEP001105) datasets
Fig. 2
Fig. 2
ANXA1 is highly expressed in ICC tissues and cells and is associated with poor prognosis. A: mRNA expression levels of ANXA1 in 40 pairs of ICC tumor and normal tissues(n = 40). B: Protein levels of ANXA1 in 12 pairs of ICC tumor and normal tissues. C-E: mRNA and protein expression of ANXA1 in ICC cell lines and normal biliary epithelial cell lines(n = 3). F-G: Representative immunohistochemical images of ANXA1 in 78 pairs of ICC tissues and corresponding normal tissues (scale bar 250 μm) and statistical graph of immunohistochemical scoring (n = 78, IHC score 0–12). H-I: Kaplan-Meier analysis of overall and disease-free survival in low and high ANXA1 expression groups. Data are representative of three (A, C, E) independent experiments. Unpaired two-tailed Student’s t-tests (A, G); One-way ANOVA with Dunnett’s test (C, E); Log-rank (Mantel–Cox) test (H, I). **, p < 0.01; ***, p < 0.001. Data are mean ± SD
Fig. 3
Fig. 3
ANXA1 promotes ICC cell proliferation and growth in vitro and vivo. A-B: Validation of ANXA1 knockdown in HUCCT1 cell lines and overexpression in RBE cell line by western blot and RT-PCR. C: EDU assay to detect the proliferative capacity of ANXA1 knockdown or overexpression. D: Plate cloning assay to detect the proliferative capacity of ANXA1 knockdown HUCCT1 and HCCC9810 cells and RBE overexpression. E: CCK-8 assay to detect the proliferative capacity of ANXA1 knockdown HUCCT1 and HCCC9810 cells and RBE overexpression. F: Xenograft mouse model of tumors from HUCCT1 cells with ANXA1 knockdown and RBE cells with ANXA1 overexpression. G: Volume and weight changes of xenograft tumors from HUCCT1 cells with ANXA1 knockdown. H: Volume and weight changes of xenograft tumors from RBE cells with ANXA1 overexpression. I: Immunohistochemical staining of KI67 and PCNA in mouse subcutaneous xenograft tumor tissues. Data are representative of three (A, B, C, D, E) or five (G, H) independent experiments. Unpaired two-tailed Student’s t-tests (B, C(right), D(right), H(right)); One-way ANOVA with Dunnett’s test (A, C(left), D(left), G(right)); two-way ANOVA (E, G(left), H(left)); Log-rank (Mantel–Cox) test (H, I). **, p < 0.01; ***, p < 0.001; ns, not significant. Data are mean ± SD
Fig. 4
Fig. 4
ANXA1 interacts with GOT1 and regulates its protein expression. A: Silver staining image before mass spectrometry analysis (IP-ANXA1). B: Enrichment analysis of potential proteins associated with ANXA1 (KEGG and GO). C: Venn diagram based on public database MsigDB, Amino acid metabolism, BIOGRID, and mass spectrometry analysis intersection. D: CO-IP detection of the interaction between ANXA1 and GOT2 in HUCCT1 cells. E: CO-IP detecting the interaction between ANXA1 and GOT1 in HUCCT1 and HCCC9810 cells endogenously. F: CO-IP detecting the interaction between ANXA1 and GOT1 in 293T cells exogenously. G: Immunofluorescence detecting the co-localization of ANXA1 and GOT1 in HUCCT1 and HCCC9810 cells and fluorescence intensity statistics. H: Immunofluorescence detecting the co-localization of ANXA1 and GOT1 in typical ICC tissues. I: Representative immunohistochemical (IHC) staining of ANXA1 and GOT1 in tumor tissues. J: A contingency table was constructed based on IHC scores to assess the expression distribution of ANXA1 and GOT1 in 48 cholangiocarcinoma tissue samples(chi-square test). K: Correlation analysis of ANXA1 and GOT1 expression in intrahepatic cholangiocarcinoma (ICC) tissues based on immunoreactive scores (IRS)(Spearman’s correlation). L: Immunofluorescence detecting the expression of GOT1 in HUCCT1 cells with ANXA1 knockdown. M: Immunohistochemical staining to detect the protein expression level of GOT1 in subcutaneous tumor tissues of HUCCT1 cells with ANXA1 knockdown
Fig. 5
Fig. 5
ANXA1 regulates glutamine metabolism via deubiquitination and protein stability of GOT1. A: RT-PCR detecting the mRNA levels of GOT1 after knockdown of ANXA1 in HUCCT1 and HCCC9810 cells. B: Western blot detecting the expression of GOT1 in HUCCT1 and HCCC9810 cells with ANXA1 knockdown. C: IB of GOT1, ANXA1, and α-tubulin in HUCCT1 cells transduced with sh-ANXA1#1 or sh-control after CHX treatment (100 µg/ml) for the indicated times (left). A graph showing normalized GOT1 levels is also shown (right). D-E: IB of GOT1, ANXA1, and α-tubulin in HUCCT1 cells transduced with sh-control or sh-ANXA1 after treatment with MG132 (10 μm, top) or CQ (50 μm, bottom). F: IP (using anti-Flag antibody) and IB of HA-Ub, Flag, ANXA1, α-Tubulin, and GOT1 in RBE cells transfected with the indicated plasmids.(k48O refers to ubiquitin expression vector mutant plasmid that retains only the K48 site, k63O refers to ubiquitin expression vector mutant plasmid that retains only the K63 site). G: IP (using anti-Flag antibody) and IB of HA-Ub(k48O), Flag, ANXA1, α-Tubulin, and GOT1 in HUCCT1 and HCCC9810 cells transfected with the indicated plasmids after treatment with MG132 (10 μm, 6 h). H: Glutamine uptake and glutamate/ aspartate levels were examined in HUCCT1 and HCCC9810 cells with stable of knockdown ANXA1 or overexpress GOT1. I: Mechanism diagram of GOT1-mediated glutamine metabolism. J: GSH and ROS levels were examined in HUCCT1 and HCCC9810 cells with stable of knockdown ANXA1 or overexpress GOT1. Data are representative of three (A, C(right), H, J) independent experiments. One-way ANOVA (A, H, J); Two-way ANOVA (C(right)). **, p < 0.01; ***, p < 0.001; ns, not significant. Data are mean ± SD
Fig. 6
Fig. 6
ANXA1 Recruits Deubiquitinating Enzyme USP5 to Deubiquitinate and Stabilize GOT1. A-C: Venn diagram based on IP-MS (ANXA1 and GOT1) with Molecular Signatures Database(MsigDB) to find deubiquitinating enzymes that stabilize GOT1 and IP-MS analysis as well as secondary mass spectrometry diagrams of USP5 and GOT1. D: Multiplex immunofluorescence detecting the co-localization of ANXA1, USP5, and GOT1 in ICC tissues. E: CO-IP detecting the interaction between ANXA1 and USP5 in HUCCT1 cells endogenously. F: CO-IP detecting the interaction between ANXA1 and USP5 in 293T cells exogenously. G: IB of GOT1, ANXA1, and α-tubulin in HUCCT1 cells transduced with sh-USP5 or sh-control after CHX treatment (100 µg/ml)for the indicated times (left). A graph showing normalized GOT1 levels is also shown (right). (Mean values (n = 3) ± s.d. two-way ANOVA, **p < 0.01.). H: IB of GOT1, USP5, and α-Tubulin in HUCCT1 and HCCC9810 cells transduced with sh-control or sh-USP5 after treatment with MG132 (10 μm, 6 h). I: IP with anti-Flag antibody and IB of HA-Ub, Flag-GOT1, USP5, and α-Tubulin in HUCCT1 and HCCC9810 cells transfected with the indicated plasmids after treatment with MG132 (10 μm, 6 h). J: IP (using anti-USP5 or anti-GOT1 antibody) and IB of GOT1, ANXA1, and USP5 in HUCCT1 and HCCC9810 cells transduced with sh-control or sh-ANXA1 after treatment with MG132 (10 μm, 6 h). K:IB of GOT1, USP5, and α-Tubulin in HUCCT1 and HCCC9810 cells transduced with sh-control or sh-USP5 and with ANXA1 knockdown. L: IB of GOT1, ANXA1, and α-Tubulin in RBE cells transfected with vector or Flag-ANXA1 and with USP5 knockdown
Fig. 7
Fig. 7
ANXA1 inhibiting combine with glutamine deficiency suppress tumor cells growth and proliferation. A: Immunofluorescence co-localization of ANXA1 and GOT1 in HUCCT1 cells cultured in CM or Gln (-). B: CCK8 proliferation assay was used to detect the proliferation ability of HUCCT1 cells treated with sh-Ctrl、sh-ANXA1#1、sh-ANXA1#1 + oe-GOT1 in complete medium (CM) and glutamine-deficient Gln (-) medium. C: Plate cloning was used to detect the proliferation ability of HUCCT1 cells treated with sh-Ctrl、sh-ANXA1#1、sh-ANXA1#1 + oe-GOT1 in complete medium (CM) and glutamine-deficient (Gln (-)) medium. D: EDU assay was used to detect the proliferation ability of HUCCT1 cells treated with sh-Ctrl、sh-ANXA1#1、sh-ANXA1#1 + oe-GOT1 in complete medium (CM) and glutamine-deficient (Gln (-)) medium. E:Levels of ROS and GSH was detected in HUCCT1 cells in complete medium (CM) and glutamine-deficient (Gln (-)) medium. F: Different groups of stable cell lines were transplanted subcutaneously into nude mice and raised with or without glutamine. G: HUCCT1 cells of sh-Ctrl, sh-ANXA1#1, sh-ANXA1#1 + oe-GOT1 were subcutaneously inoculated into nude mice fed with glutamine diet or lacking glutamine diet. H: The corresponding tumor volume growth curve and weight are shown. I: GSH or ROS levels were examined in CDX with stable of knockdown ANXA1 or overexpress GOT1. Data are representative of three (B, C, D, H(left)) or five (H(right), I) independent experiments. One-way ANOVA (C, D, E, H(right), I); Two-way ANOVA (B, H(left)). **, p < 0.01; ***, p < 0.001. Data are mean ± SD
Fig. 8
Fig. 8
Summary illustration. A: Molecular mechanism diagram of ANXA1-USP5-GOT1 axis mediated glutamine metabolism promoting tumor growth and proliferation

Similar articles

References

    1. Siegel RL, Miller KD, Fuchs HE, Jemal A. Cancer statistics, 2022. CA Cancer J Clin. Jan. 2022;72(1):7–33. 10.3322/caac.21708. - PubMed
    1. Chang Y-J, Chang Y-J, Chen L-J. Prognostic factors in patients with intrahepatic cholangiocarcinoma. Sci Rep. Aug. 2024;14(1):19084. 10.1038/s41598-024-70124-z. - PMC - PubMed
    1. Khan SA, Tavolari S, Brandi G. Cholangiocarcinoma: epidemiology and risk factors. Liver Int. May 2019;39(1):19–31. 10.1111/liv.14095. - PubMed
    1. Forner A, Vidili G, Rengo M, Bujanda L, Ponz-Sarvisé M, Lamarca A. Clinical presentation, diagnosis and staging of cholangiocarcinoma. Liver Int. May 2019;39(1):98–107. 10.1111/liv.14086. - PubMed
    1. El-Diwany R, Pawlik TM, Ejaz A. Intrahepatic Cholangiocarcinoma, Surg Oncol Clin N Am, vol. 28, no. 4, pp. 587–599, Oct. 2019, 10.1016/j.soc.2019.06.002 - PubMed

MeSH terms