

A meta-analysis on application and prospect of cell therapy in the treatment of diabetes mellitus
- PMID: 40390031
- PMCID: PMC12090454
- DOI: 10.1186/s13287-025-04377-4
A meta-analysis on application and prospect of cell therapy in the treatment of diabetes mellitus
Abstract
Objective: Diabetes mellitus (DM) is a grave autoimmune disorder because of no insulin self-generation. Currently, mainly clinical methods exist, serious adverse effects leading to stem cell therapy are considered. The mesenchymal stem cells (MSCs), require high differentiation capacity and are judged as crucial in DM treatment. The meta-analysis aimed to systemically analyze the particular types of MSCs which play a more important role in DM and which DM is treated more effectively.
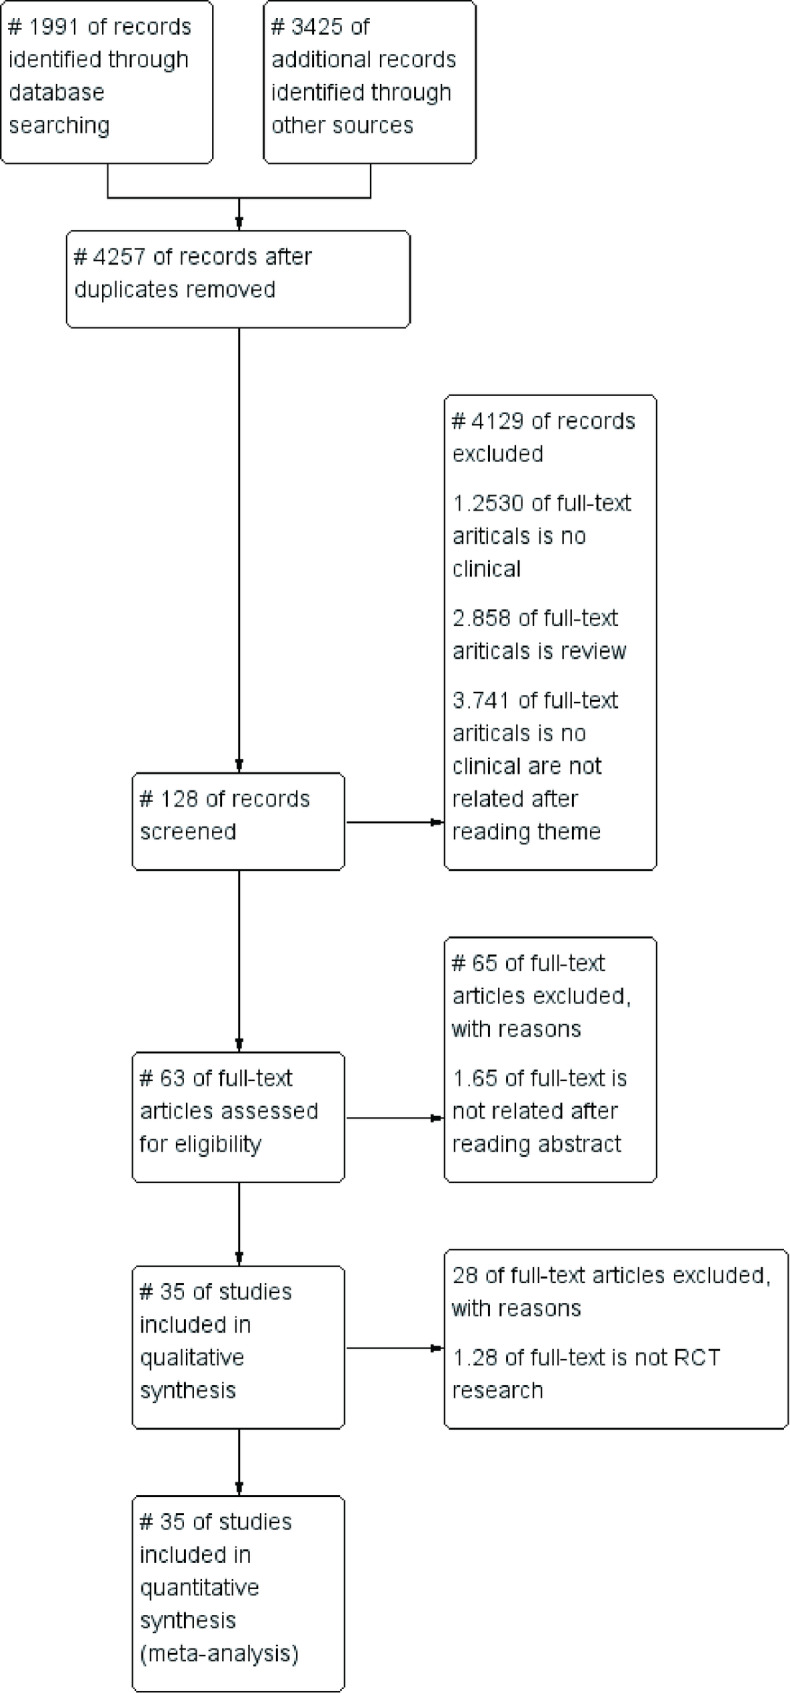
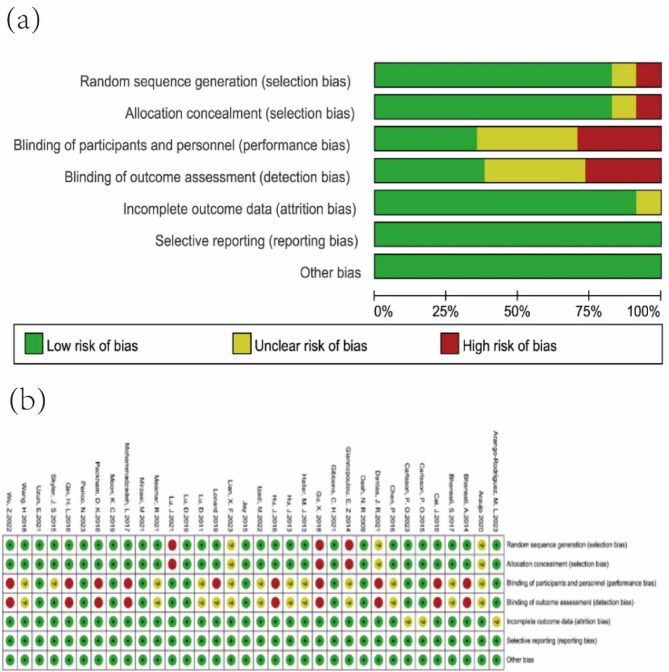
Method: A systematic review was conducted on the published literature, clinical trials and observational studies, utilizing databases such as PubMed, Embase, Cochrane and clinicaltrial.gov. RevMan software was adopted to draw Forest Plot and Funnel Plot, and subgroup analysis were employed to evaluate heterogeneity between different groups.
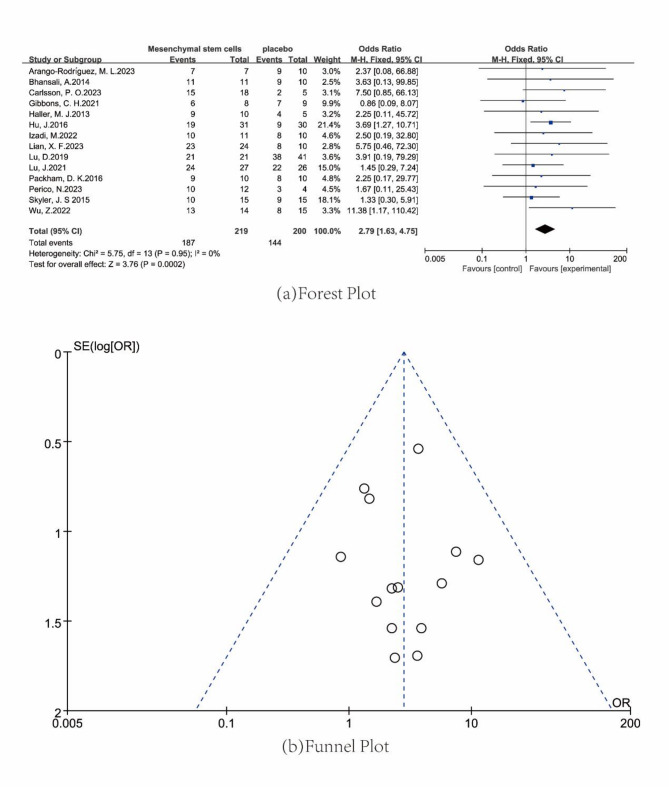
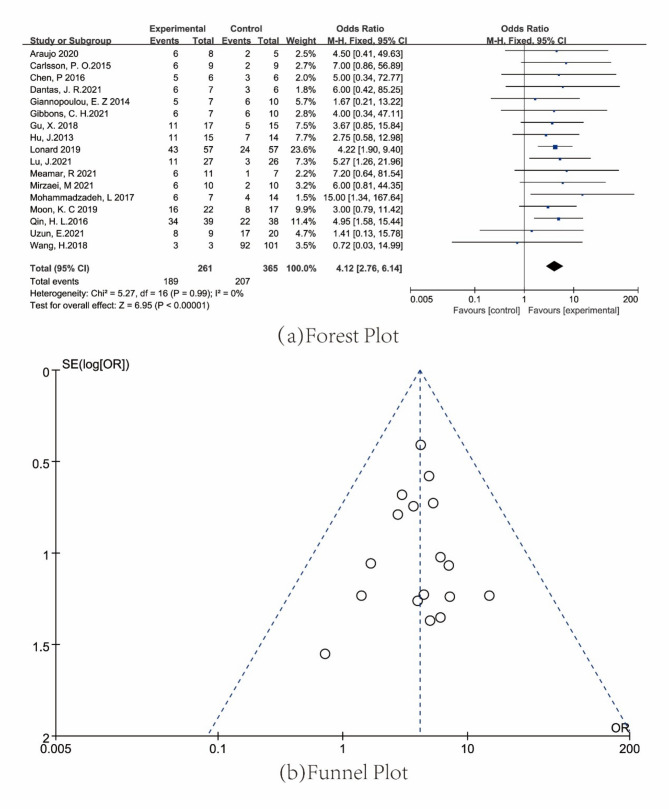
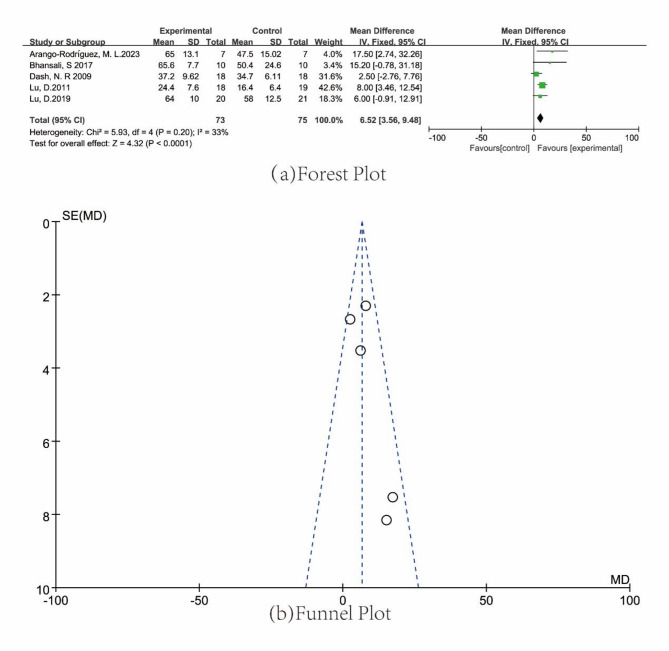
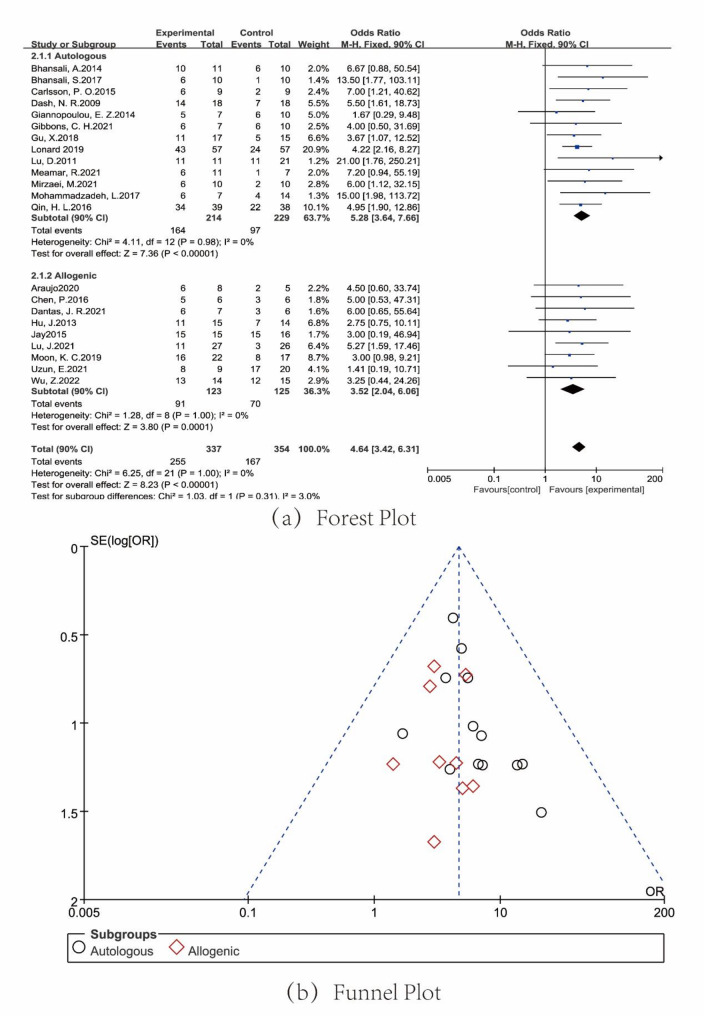
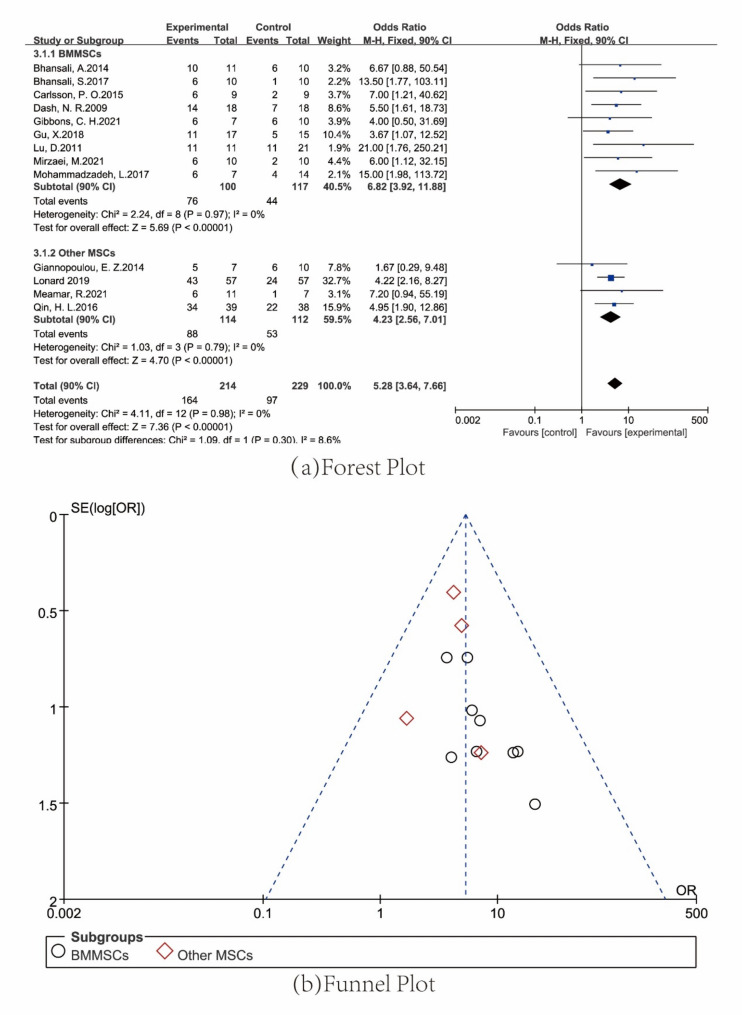
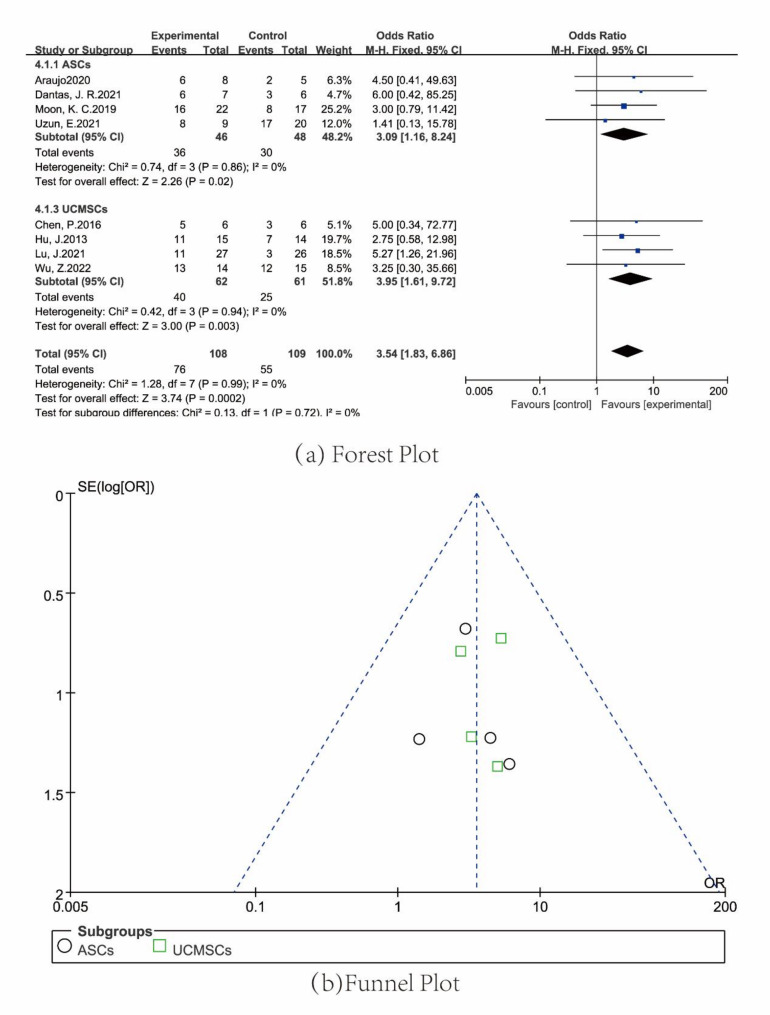
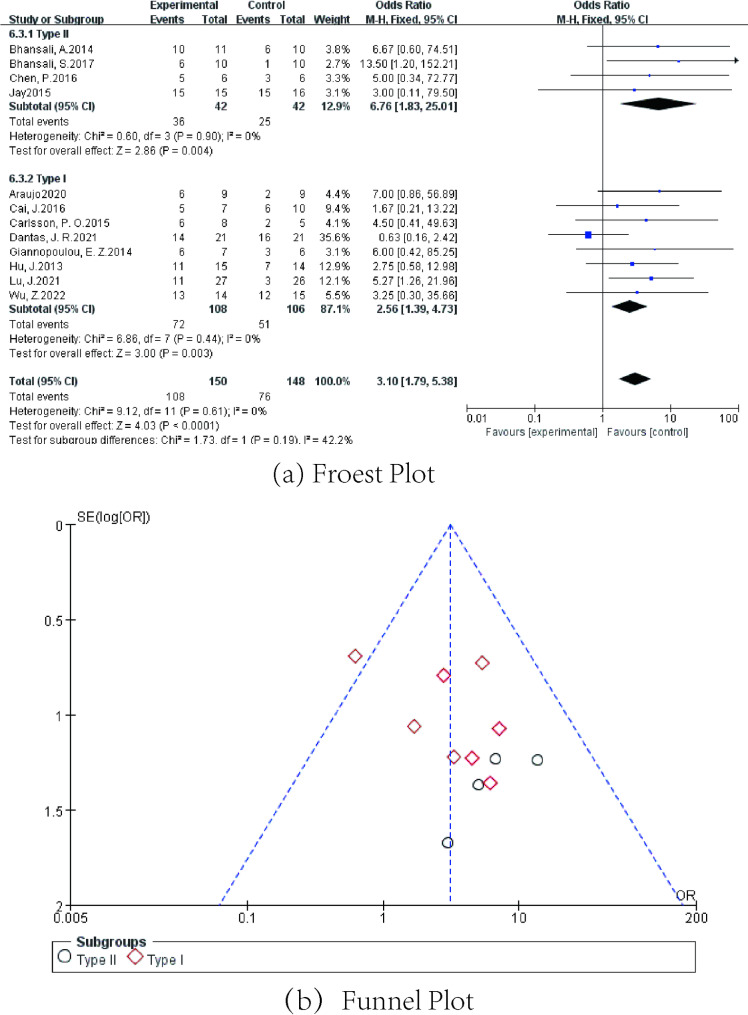
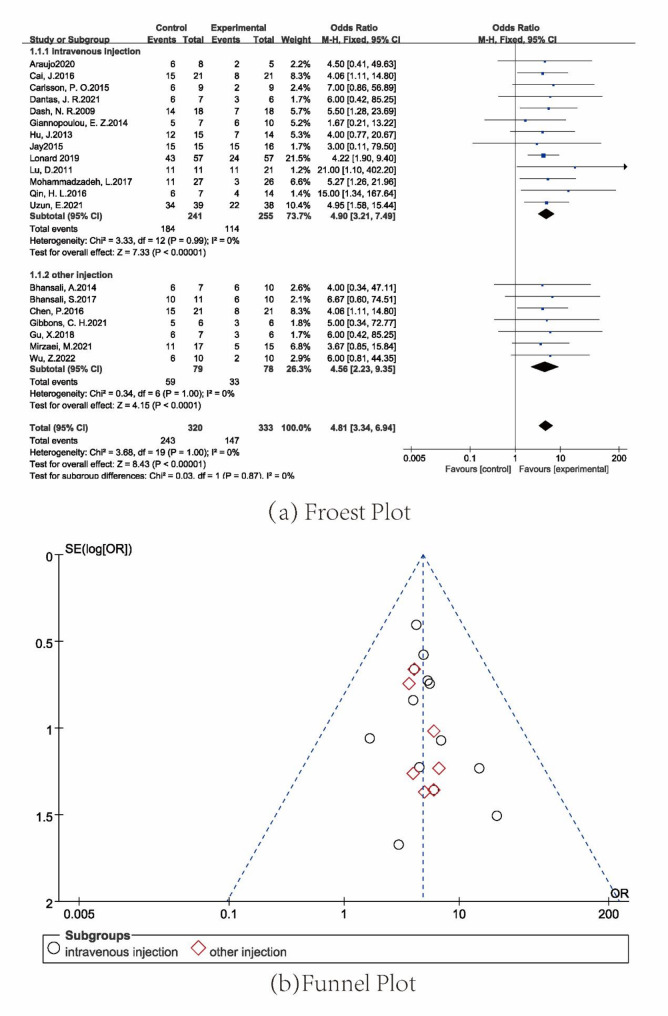
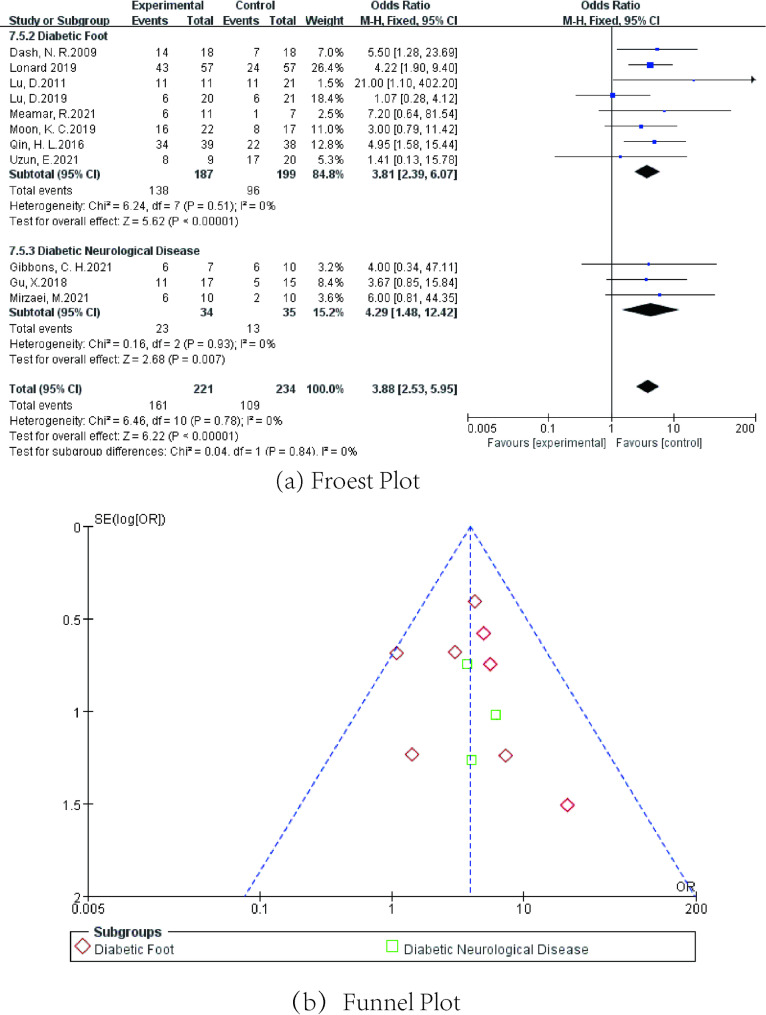
Results: We identified the meta-analyses of 34 unique random controlled trials and divided our own systematic reviews into 8 groups. The MSCs were associated with placebo (OR = 2.79, 95% CI [1.63, 4.75]), Standard Clinical Treatment (SCT) (OR = 4.12, 95% CI [2.76, 6.14]), and monocyte (OR = 6.52, 95% CI [3.56, 9.48]). The comparison between Autologous MSCs and Allogenic MSCs (OR = 4.64, 95% CI [3.42, 6.31]), Autologous BMMSCs and other MSCs (OR = 5.28, 95% CI [3.64, 7.66]), Allogenic ASCs and UCMSCs (OR = 3.54, 95% CI [1.83, 6.86]), Type I DM and Type II DM (OR = 3.10, 95% CI [1.79, 5.38]), intravenous injection and other injections (OR = 4.81, 95% CI [3.34, 6.94]), diabetic foot ulcers and diabetic neurological disease (OR = 3.88,,95% CI [2.53,5.95]).
Conclusion: Current evidence suggests that MSCs hold significant potential for treating DM, demonstrating considerably high safety and efficacy. MSCs exhibit higher therapeutic benefits compared to monocytes, with autologous MSCs offering better clinical outcomes than allogenic sources. MSCs (BMMSCs) proved more effective than other types of MSCs. However, no significant differences were observed between adipose-derived MSCs (ASCs) and umbilical cord-derived MSCs (UCMSCs) in the allogeneic setting. Moreover, MSCs show more pronounced therapeutic effects in Type II DM, and the difference among the injection methods is minimally observed. In conclusion, the research scope on DM is relatively limited in this study and further research is necessary to improve the reliability of the estimates.
Keywords: Allogenic MSCs; Autologous MSCs; Exosomes; MSCs; Type I DM; Type II DM; iPSC.
© 2025. The Author(s).
Conflict of interest statement
Declarations. Ethics approval and consent to participate: Not applicable. Consent for publication: Not applicable. Competing interests: The authors declare that there are no conflicts of interest.
Figures
Similar articles
-
Therapeutic efficacy of umbilical cord-derived stem cells for diabetes mellitus: a meta-analysis study.Stem Cell Res Ther. 2020 Nov 16;11(1):484. doi: 10.1186/s13287-020-01996-x. Stem Cell Res Ther. 2020. PMID: 33198815 Free PMC article.
-
Human Umbilical Cord-Derived Stem Cells: Isolation, Characterization, Differentiation, and Application in Treating Diabetes.Crit Rev Biomed Eng. 2018;46(5):399-412. doi: 10.1615/CritRevBiomedEng.2018027377. Crit Rev Biomed Eng. 2018. PMID: 30806260 Review.
-
A Systematic Review and Meta-Analysis: Safety and Efficacy of Mesenchymal Stem Cells Therapy for Heart Failure.Curr Stem Cell Res Ther. 2021;16(3):354-365. doi: 10.2174/1574888X15999200820171432. Curr Stem Cell Res Ther. 2021. PMID: 32867655
-
The inconclusive superiority debate of allogeneic versus autologous MSCs in treating patients with HFrEF: a systematic review and meta-analysis of RCTs.Stem Cell Res Ther. 2025 Apr 12;16(1):175. doi: 10.1186/s13287-025-04209-5. Stem Cell Res Ther. 2025. PMID: 40221807 Free PMC article.
-
Mesenchymal stem cell therapy in aqueous deficient dry eye disease.Acta Ophthalmol. 2023 Oct;101 Suppl 277:3-27. doi: 10.1111/aos.15739. Acta Ophthalmol. 2023. PMID: 37840443 Review.
References
-
- Hotamisligil GS. Inflammation, metaflammation and immunometabolic disorders. Nature. 2017;542(7640):177–85. - PubMed
-
- Pandey A, Chawla S, Guchhait P. Type-2 diabetes: current Understanding and future perspectives. IUBMB Life. 2015;67(7):506–13. - PubMed
-
- Sumi Y, Sakai Y, et al. Association of adipocytokines with peritoneal function. Perit dialysis International: J Int Soc Perit Dialysis. 2021;41(1):79–85. - PubMed
-
- Toschi E. Type 1 diabetes and aging. Endocrinol Metab Clin North Am. 2023;52(2):389–403. - PubMed
Publication types
MeSH terms
Grants and funding
LinkOut - more resources
Full Text Sources
Medical
