Horizontal cell connectivity in the anchovy retina-a 3D electron microscopic study
- PMID: 40390032
- PMCID: PMC12090589
- DOI: 10.1186/s12915-025-02242-7
Horizontal cell connectivity in the anchovy retina-a 3D electron microscopic study
Abstract
Background: Block-face scanning electron microscopy has opened a new era of connectomics research, in which it is possible to make dense reconstructions of all cells in a clipping of a neuronal network, such as the retina, resolving synaptic contacts. Anchovies, exceptionally abundant marine teleosts, have retinae with regions for triple cone-based color vision and a region with specialized cone photoreceptors, so-called polycones, made of long and short cones with axially oriented outer segment lamellae for polarization contrast vision. This modality, discovered in the 1970s, is unique in vertebrates, but the neural wiring for contrast generation in deeper retinal layers is unknown so far.
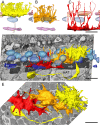
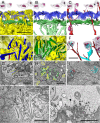
Results: To elucidate the retinal connectomics of the European anchovy Engraulis encrasicolus (Linnaeus, 1758), in a first project, we investigated the shapes and cone-specific wiring rules of 3 horizontal cell types using volume electron microscopy and subsequent computer-aided reconstruction: H1 cells contact both cone types of the polycone, H2 cells contact only the short cones, and H3 cells are exclusively connected to rods. In addition, a distinctive double band of Müller fibers and a layer of H1 axon terminals were structurally clarified.
Conclusions: The findings suggest that (1) the monochromatic polarization contrast system based on fine structure specializations in the outer retina is connected to an inherited (bichromatic) color contrast mechanism in the inner retina, (2) the anchovy polycones arose from red (now long) and green (now short) cones, and (3) the blue single cones disappeared in the relevant retinal region.
Keywords: Neural network; Polarization vision; Vertebrate retina; Volume electron microscopy.
© 2025. The Author(s).
Conflict of interest statement
Declarations. Ethics approval and consent to participate: Ethics approval not applicable: dead animal material (ca. 1 h postmortem) was supplied by fisherman. Consent for publication: Not applicable. Competing interests: The authors declare no competing interests.
Figures


Similar articles
-
Unique photoreceptor arrangements in a fish with polarized light discrimination.J Comp Neurol. 2011 Mar 1;519(4):714-37. doi: 10.1002/cne.22544. J Comp Neurol. 2011. PMID: 21246551
-
The pattern of cone pedicles and horizontal cells in the retina of the European anchovy, Engraulis encrasicolus L. (Engraulididae, Clupeiformes).J Submicrosc Cytol Pathol. 2002 Oct;34(4):355-65. J Submicrosc Cytol Pathol. 2002. PMID: 12575834
-
The structure of anchovy outer retinae (Engraulididae, Clupeiformes) - a comparative light- and electron-microscopic study using museum-stored material.J Morphol. 2006 Nov;267(11):1356-80. doi: 10.1002/jmor.10482. J Morphol. 2006. PMID: 17051549
-
The neuronal organization of the outer plexiform layer of the primate retina.Int Rev Cytol. 1984;86:285-320. doi: 10.1016/s0074-7696(08)60181-3. Int Rev Cytol. 1984. PMID: 6368448 Review.
-
Grouped retinae and tapetal cups in some Teleostian fish: occurrence, structure, and function.Prog Retin Eye Res. 2014 Jan;38:43-69. doi: 10.1016/j.preteyeres.2013.10.001. Epub 2013 Oct 22. Prog Retin Eye Res. 2014. PMID: 24157316 Review.
References
-
- Dowling JE. The retina: an approachable part of the brain. Cambridge: Harvard University Press; 1987.
-
- Lythgoe JN. The ecology of vision. Oxford: Clarendon Press; 1979.
-
- Engström K. Cone types and cone arrangements in teleost retinae. Acta Zoologica. 1963;44:179–243.
-
- Wagner HJ. Vergleichende Untersuchungen über das Muster der Sehzellen und Horizontalen in der Teleostierretina (Pisces). Z Morph Tiere. 1972;72:77–130.
-
- Collin SP, Pettigrew JD. Retinal topography in reef teleosts I. Some species with well-developed areae but poorly-developed streaks. Brain Behav Evol. 1988;31:269–82. - PubMed
MeSH terms
LinkOut - more resources
Full Text Sources

