. 2025 May 19;13(1):128.
doi: 10.1186/s40168-025-02122-w.

Microbiota alterations leading to amino acid deficiency contribute to depression in children and adolescents

Affiliations

Microbiota alterations leading to amino acid deficiency contribute to depression in children and adolescents

Teng Teng et al. Microbiome. .

Abstract

Background: Major depressive disorder (MDD) in children and adolescents is a growing global public health concern. Metabolic alterations in the microbiota-gut-brain (MGB) axis have been implicated in MDD pathophysiology, but their specific role in pediatric populations remains unclear.

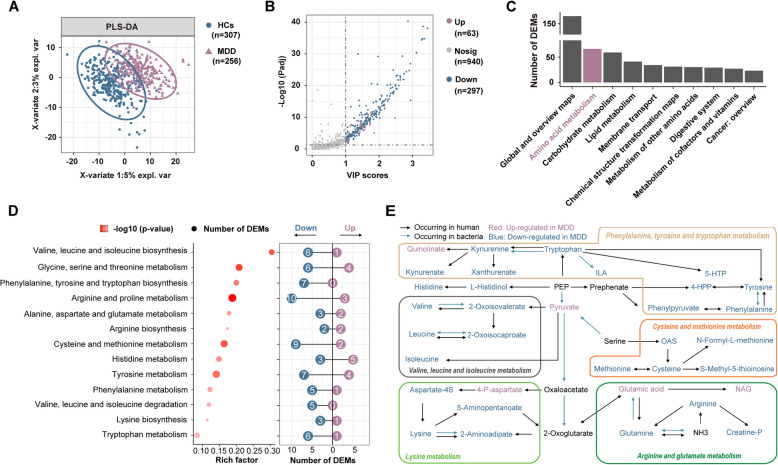
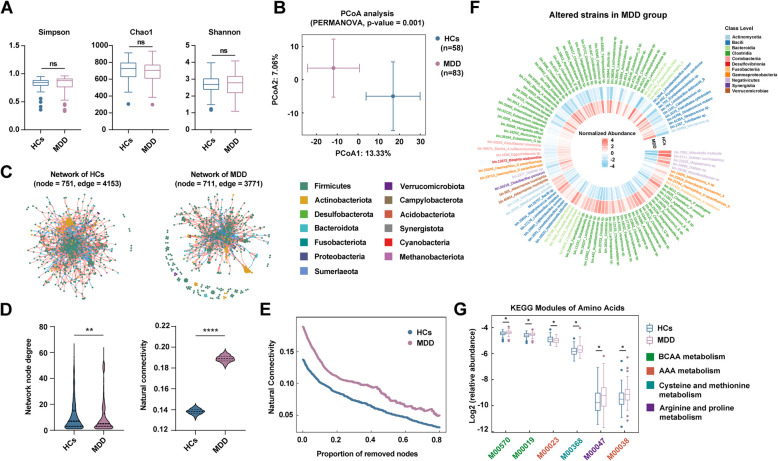
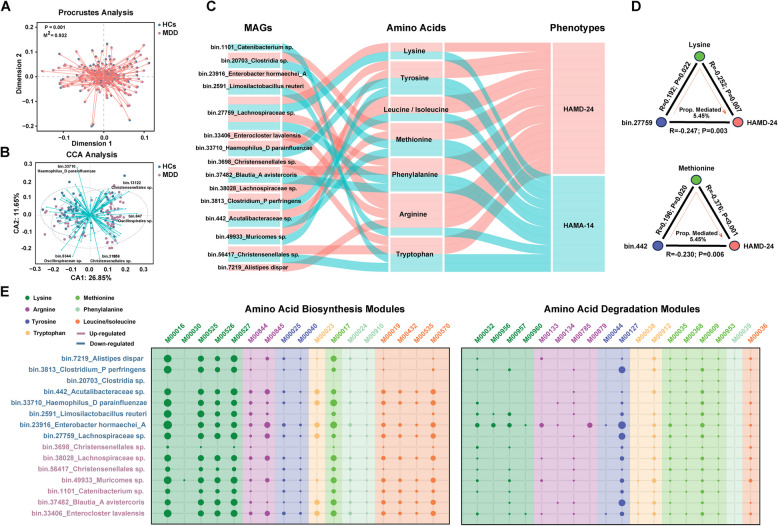
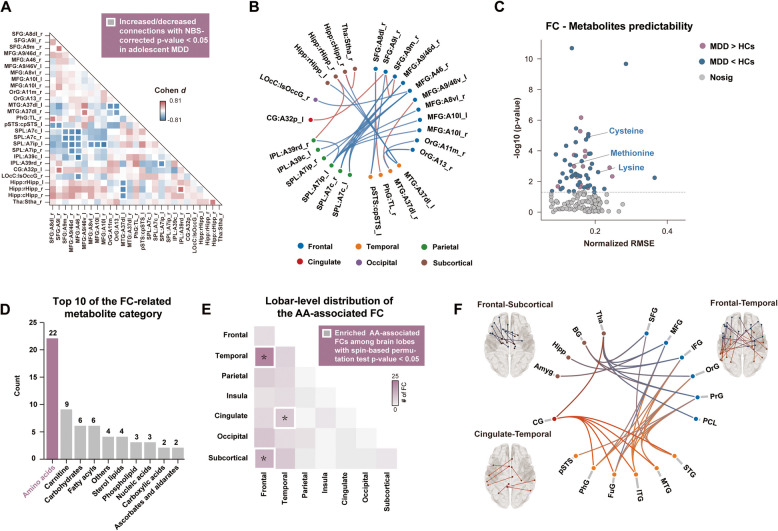
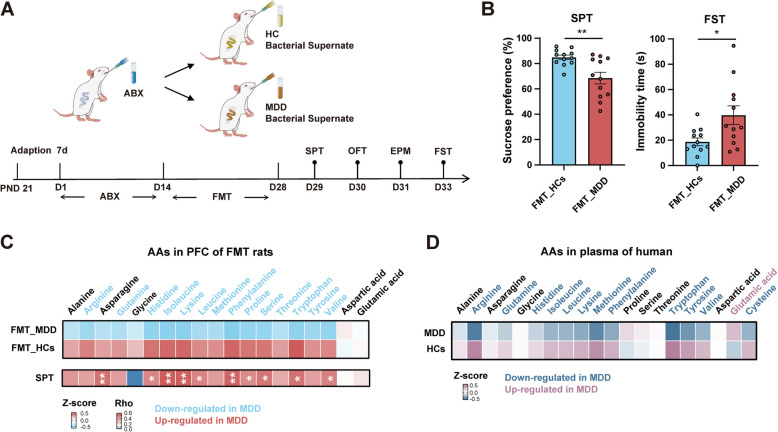
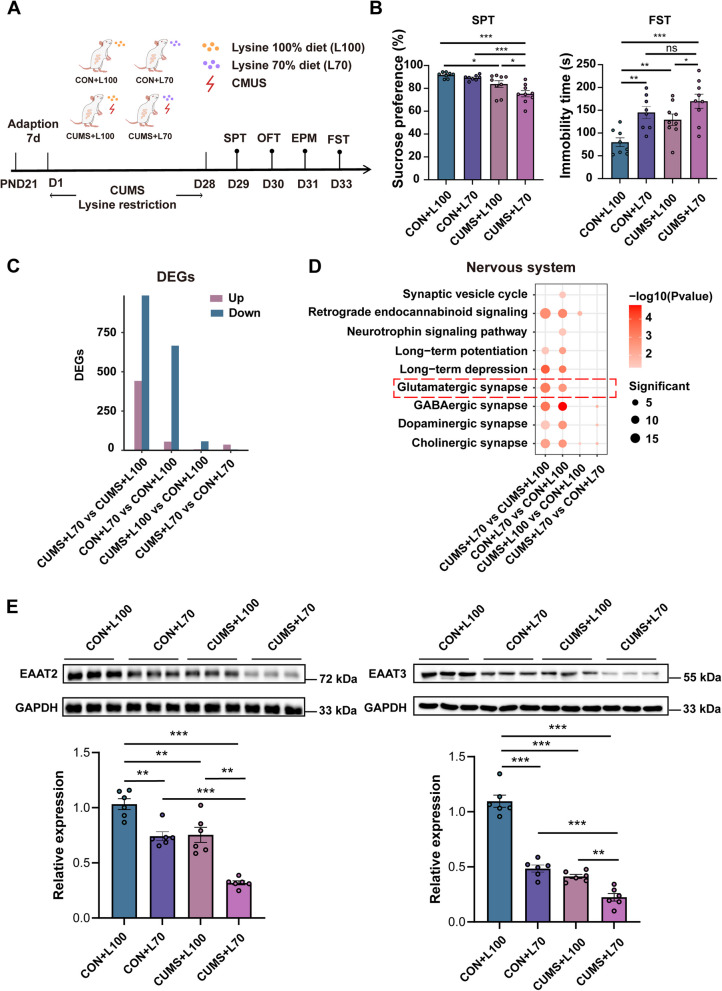
Results: We conducted a multi-omics study on 256 MDD patients and 307 healthy controls in children and adolescents, integrating plasma metabolomics, fecal metagenomics, and resting-state functional magnetic resonance imaging (rs-fMRI) of the brain. KEGG enrichment analysis of 360 differential expressed metabolites (DEMs) indicated significant plasma amino acid (AA) metabolism deficiencies (p-value < 0.0001). We identified 58 MDD-enriched and 46 MDD-depleted strains, as well as 6 altered modules in amino acid metabolism in fecal metagenomics. Procrustes analysis revealed the association between the altered gut microbiome and circulating AA metabolism (p-value = 0.001, M2 = 0.932). Causal analyses suggested that plasma AAs might mediate the impact of altered gut microbiota on depressive and anxious symptoms. Additionally, rs-fMRI revealed that connectivity deficits in the frontal lobe are associated with depression and 22 DEMs in AA metabolism. Furthermore, transplantation of fecal microbiota from MDD patients to adolescent rats induced depressive-like behaviors and 14 amino acids deficiency in the prefrontal cortex (PFC). Moreover, the dietary lysine restriction increased depression susceptibility in adolescent rats by reducing the expression of excitatory amino acid transporters in the PFC.

Conclusions: Our findings highlight that gut microbiota alterations contribute to AAs deficiency, particularly lysine, which plays a crucial role in MDD pathogenesis in children and adolescents. Targeting AA metabolism may offer novel therapeutic strategies for pediatric depression. Video Abstract.

Keywords: Amino acid; Children and adolescents; Depression; Glutaminergic synapse; MGB axis; Microbiota.


Conflict of interest statement

Declarations. Ethics approval and consent to participate: This study was approved by the Ethics Committee of the First Affiliated Hospital of Chongqing Medical University. All participants have signed the consent form. All rat experiments were approved by the Institutional Animal Care and Use Committee of Chongqing Medical University. Consent for publication: Not applicable. Competing interests: The authors declare no competing interests.

Figures

Fig. 1
Fig. 1
The deficiency of plasma amino acids in children and adolescents with MDD. A A clear discrepancy of plasma metabolome between MDD patients (n = 256) and HCs (n = 307), revealed by Partial Least-Squares Discriminant Analysis (PLS-DA). B The volcano plot for all the 1300 identified metabolic features, including 63 up-regulated metabolites (red), 297 down-regulated metabolites (blue) and 940 non-significant metabolites (grey) in children and adolescents with MDD. C Kyoto Encyclopedia of Genes and Genomes (KEGG) enrichment analysis of all the 360 differentially expressed metabolites (DEMs) highlighted the amino acid metabolism was the most enriched KEGG level-2 functional pathway. D The KEGG enrichment analysis highlighted a total of 13 KEGG level-3 functional pathways in amino acid metabolism (left), and the number of differentially expressed metabolites (DEMs) in MDD patients are shown respectively (right), red dot color indicated the increased DEMs and blue dot indicated the decreased DEMs. E Representation of connections of phenylalanine, tyrosine, tryptophan, histidine, valine, leucine, isoleucine, cysteine, methionine, lysine, arginine, glutamic acid and glutamine metabolic pathways. ILA, Indole-3-lactic acid. 5-HTP, 5-Hydroxy-L-tryptophan. HPP, 4-Hydroxyphenylpyruvate. OAS, O-Acetyl-L-serine. Pcr, Creatine-P. NAG, N-Acetyl-L-glutamate. Data were sourced from the KEGG database
Fig. 2
Fig. 2
Specific fecal microbial ecosystem in children and adolescents with MDD. A Box and whiskers plots (in the style of Turkey) for the α-diversity analysis of four indices (Simpson, Chao1 and Shannon) at the microbial strain level between MDD patients (n = 83) and HCs (n = 58). B Principal component analysis (PCoA) indicates a partial but significant separation between patients with MDD and HCs at microbial strain level. Significance was determined using permutational multivariate analysis of variance (Binomial distance). C Visualization of constructed co-occurrence network for the relative abundance of all the 793 metagenome-assembled genomes (MAGs) by using Sparcc in HCs (left) and MDD groups (right). D Violin chart demonstrating the connectivity property of the network including network node degree and natural connective (Wilcox test p-value; ** < 0.01, **** < 0.0001). E Fragility of the co-occurrence network was measured by the natural connective after removing the nodes. A larger natural connective indicated the corresponding network was more robust/less fragile. F The cladogram shows the 104 MAGs were differentially abundant between MDD and HCs by using LEfSe analysis, including 58 up-regulated and 46 down-regulated MAGs in MDD group. G Box and whiskers plots (in the style of Turkey) show the 6 MDD-associated microbial Kyoto Encyclopedia of Genes and Genomes (KEGG) modules in amino acids (AAs) pathways between MDD and HCs (Wilcox test p-value; * p-value < 0.05)
Fig. 3
Fig. 3
Interactions of fecal microbial compositions and host circulating amino acids in children and adolescents with MDD. A Procrustes analysis of plasma metabolome versus fecal microbiome. Blue and red color of node represent HCs (n = 58) and MDD (n = 83), respectively. The plasma metabolome and fecal samples from the same individual are connected by red arrows. B Canonical correlation analysis (CCA) of the relationships between 66 metabolites related with amino acid metabolism and 104 differentially expressed metagenome-assembled genomes (MAGs). Each MAG is represented with a blue arrow, with the names of the MAGs with the top five distances. Blue and red colors of node represent HCs and MDD, respectively. The sample projections in MAGs and metabolite space are represented by the starting point and the end of the arrow, respectively. C Sankey diagram showing the inferred causal relationship network of bacterial features on total scores of 24-item Hamilton Depression Rating Scale (HAMD-24) and the 14-item Hamilton Anxiety Rating Scale (HAMA-14) mediated by amino acids. D Examples of inferred causal relationships between microbial features, amino acids and total scores of HAMD-24 and the HAMA-14. E Circles represent the presence or absence of amino acid metabolism modules encoded by microbial genomes. The size of each circle indicates the number of genomes within a given bacterial strain encoding enzymes involved in the corresponding metabolic pathway. Colored ranges represent biosynthesis or degradation modules associated with different categories of amino acid pathways
Fig. 4
Fig. 4
Depression-related plasma metabolites correlate with brain dysfunction. A The group differences of functional connectivity between MDD and HCs in children and adolescents evaluated by network-based statistics (NBS). Grids with white bounding box indicate functional connections that comprise the group-differed network (the family-wise error corrected p = 0.030). B The group-differed functional connectivity between MDD and HCs in children and adolescents identified via NBS. The linkage between nodes indicates the functional connectivity with significant group differences; the red/blue color of linkage indicates increased (MDD > HC)/decreased (MDD < HC) connections in children and adolescents with MDD; the node color indicates the brain lobe. C The predictability of depressive-related metabolites by brain functional connectivity. Significant predictability indicates associations between the metabolites and brain function. The grey dots (n = 138) represent metabolites without significant functional connectivity (FC) associations; the red dots (n = 17) represent the metabolites with significant FC associations but without group differences between MDD and HCs in children and adolescents. The metabolites that show both significant FC associations and group differences are marked with red (MDD > HCs; n = 17)/blue (MDD < HCs; n = 55). Only metabolites with positive r are presented (736 out of 1300 metabolites). D The count of metabolites belonging to different categories that are both associated with brain function and adolescent depression. Only the top 10 categories are shown. E The lobar-level distribution of amino acid (AA)-associated FCs. Grids with white bounding box indicate the lobar-level network enriched with AA-associated FCs identified with spin-based permutation test. *, pspin < 0.05. F The regional-level distribution of the AA-associated FCs. Only the distributions of the lobar-level networks with significant enrichment of AA-associated FCs are presented. The color linkage in the circle plot and glass brain plot indicates the AA-associated functional connectivity. The node color in the circle plot and glass brain plot indicates the brain lobe. The bar plot around a node indicates the count of AAs with FC associations related to that region. For abbreviations of brain regions, please refer to Table S3, both macro-anatomical and subregional names were presented in the diagram and were separated by a colon
Fig. 5
Fig. 5
Fecal microbiota transplantation (FMT) from children and adolescents with MDD-induceddepressive-like behaviors in adolescent rats accompanied by AAs deficiency in the prefrontal cortex (PFC). A The experiment schedule of the antibiotic-treated (Abx), FMT and behavioral tests. B Lower sucrose preference in sucrose preference test (SPT, left) and higher immobility time in forced swim test (FST, right) was found in FMT_MDD (n = 12) than FMT_HCs (n = 12). Significance was calculated by t-test. C The abundances of amino acids in prefrontal cortex of FMT_MDD (n = 8) were significantly lower than FMT_HCs (n = 8), and most of the abundances of amino acids were positively correlated with sucrose preference by Spearman correlation analysis. D The down-regulated amino acids (AAs) in plasma of children and adolescents with MDD overlapped with most of the down-regulated AAs in PFC of rats in FMT_MDD group
Fig. 6
Fig. 6
Dietary lysine restriction may increase depression susceptibility in adolescent chronic unpredictable mild stress (CUMS) rats via modulating excitatory amino acid transporters (EAATs) in the prefrontal cortex (PFC). A The experiment schedule of the dietary lysine restriction study including four groups: Con+L100 (n = 8), Con+L70 (n = 8), CUMS+L100 (n = 9) and CUMS+L70 (n = 9). PND, postnatal day. SPT, sucrose preference test. OFT, open field test. EPM, elevated plus-maze test. FST, forced swim test. B Lower sucrose preference in SPT (left) and higher immobility time in FST (right) was found in CUMS+L70 group than CUMS+L100 and CON+L100 groups. Significance was calculated by Two-way ANOVA. C The number of up- and down-regulated differentially expressed genes (DEGs) in four comparisons of CUMS+L70 vs. CUMS+L100, Con+L70 vs. Con+L100, CUMS+L100 vs. Con+L100, and CUMS+L70 vs. Con+L70 (n = 8/group). D The DEGs involved Kyoto Encyclopedia of Genes and Genomes (KEGG) pathways in nervous system among four comparisons of CUMS+L70 vs. CUMS+L100, Con+L70 vs. Con+L100, CUMS+L100 vs. Con+L100, and CUMS+L70 vs. Con+L70. E Protein expression levels of EAAT2 and EAAT3 in CON+L70, CON+L100, CUMS+L70 and CUMS+L100 (n = 6/group)

Similar articles

References

    1. Mokdad AH, Forouzanfar MH, Daoud F, Mokdad AA, El Bcheraoui C, Moradi-Lakeh M, et al. Global burden of diseases, injuries, and risk factors for young people’s health during 1990–2013: a systematic analysis for the global burden of disease study 2013. Lancet. 2016;387(10036):2383–401. 10.1016/S0140-6736(16)00648-6. - PubMed
    1. World Health Organization. Depression and other common mental disorders: global health estimates. World Health Organization; 2017. Licence: CC BY-NC-SA 3.0 IGO. https://iris.who.int/bitstream/handle/10665/254610/WHO-MSD-MER-2017.2-en....
    1. Thapar A, Collishaw S, Pine DS, Thapar AK. Depression in adolescence. Lancet. 2012;379(9820):1056–67. 10.1016/S0140-6736(11)60871-4. - PMC - PubMed
    1. World Health Organization. Adolescent and young adult health. 2024. https://www.who.int/newsroom/fact-sheets/detail/adolescents-health-risks....
    1. Sarchiapone M, D’Aulerio M, Iosue M. Suicidal ideation, suicide attempts and completed suicide in adolescents: neuro-biological aspects. Biol Aspects Suicidal Behav. 2015;30:11–20.

MeSH terms

LinkOut - more resources