

MicroRNA-486: a dual-function biomarker for diagnosis and tumor immune microenvironment characterization in non-small cell lung cancer
- PMID: 40390034
- PMCID: PMC12090393
- DOI: 10.1186/s12920-025-02158-9
MicroRNA-486: a dual-function biomarker for diagnosis and tumor immune microenvironment characterization in non-small cell lung cancer
Abstract
Background: This investigation evaluates the clinical significance and molecular mechanisms of microRNA-486 (miR-486) as a potential biomarker in non-small cell lung cancer (NSCLC) through an integrative analytical approach.
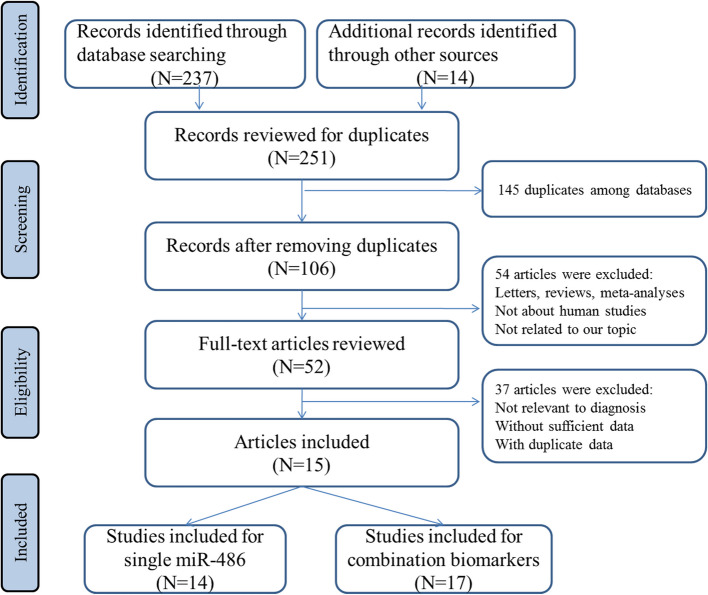
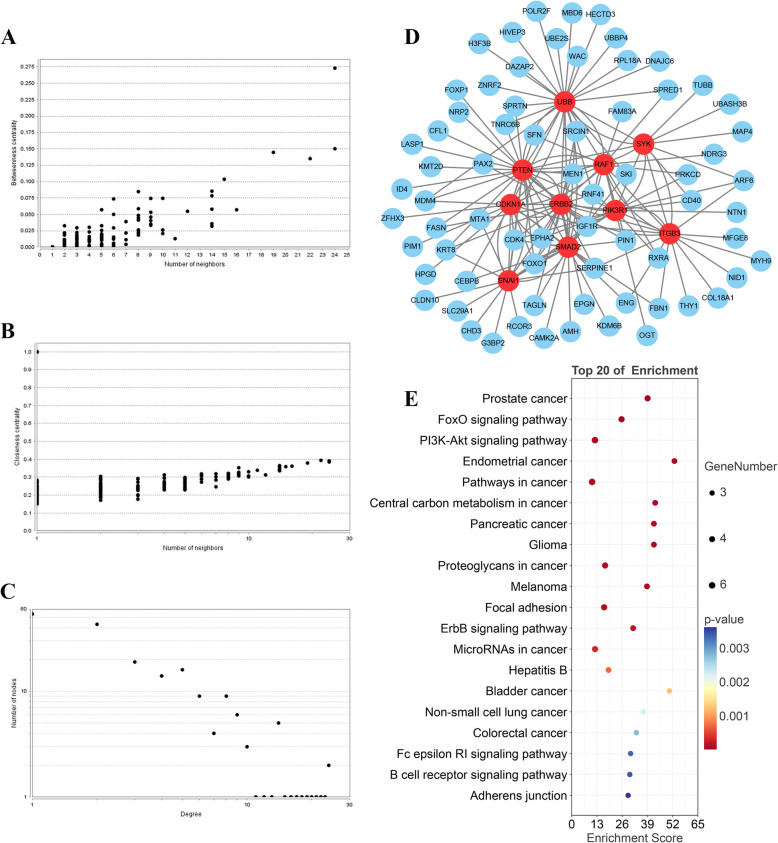
Methods: We conducted systematic search and meta-analysis of diagnostic studies from major biomedical databases from inception through April 04, 2025, followed by comprehensive bioinformatics interrogation. Protein-protein interaction (PPI) networks were constructed using STRING to identify key hub genes regulated by miR-486. Validation of hub genes employed TCGA datasets, while immune infiltration analysis utilized TIMER2.0 platform.
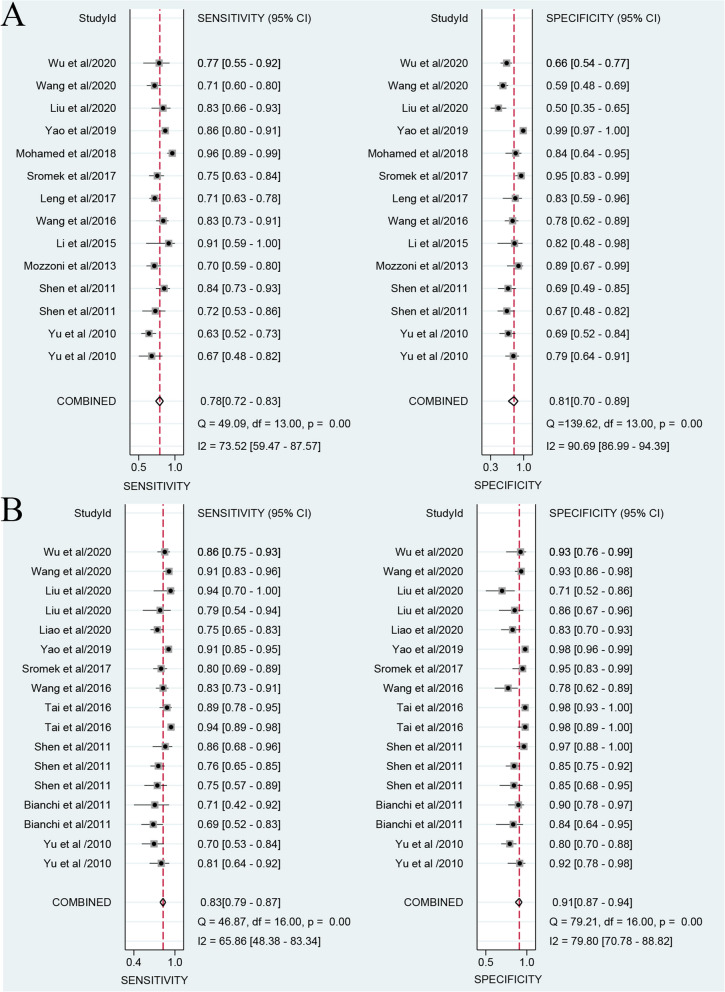
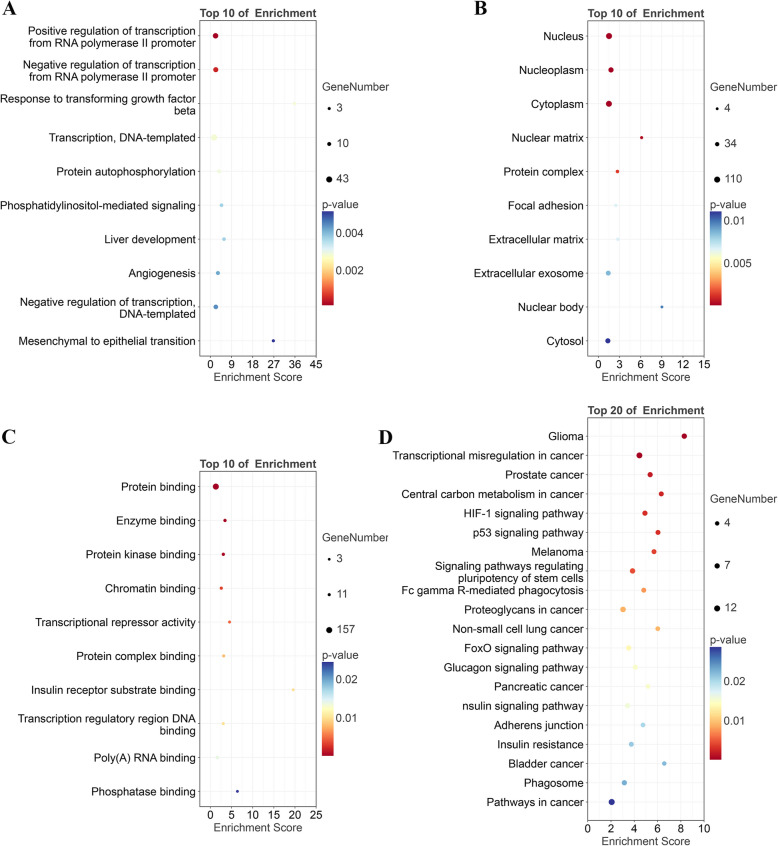
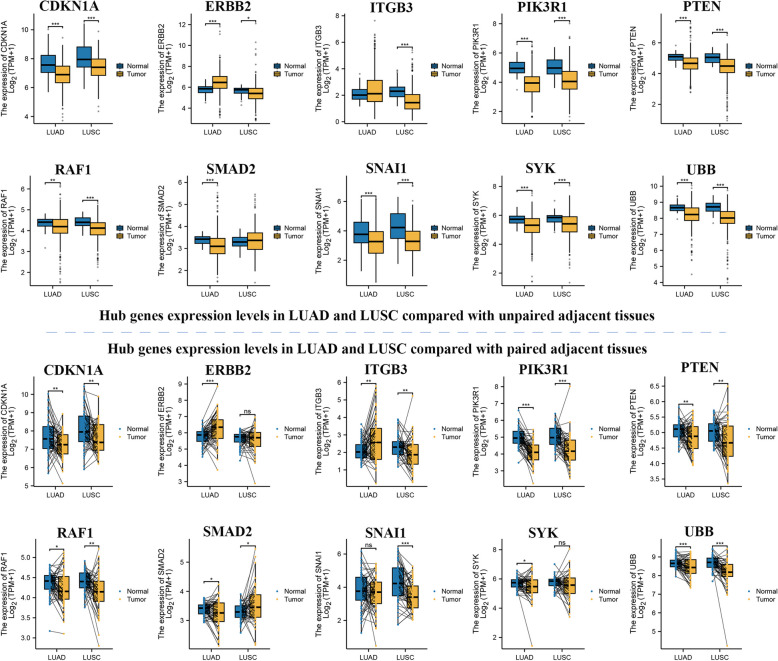
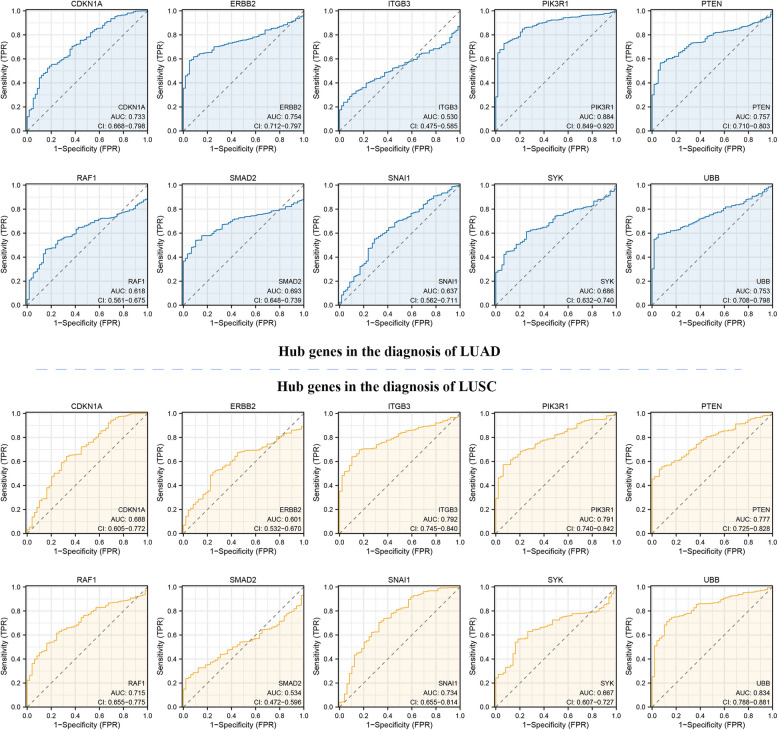
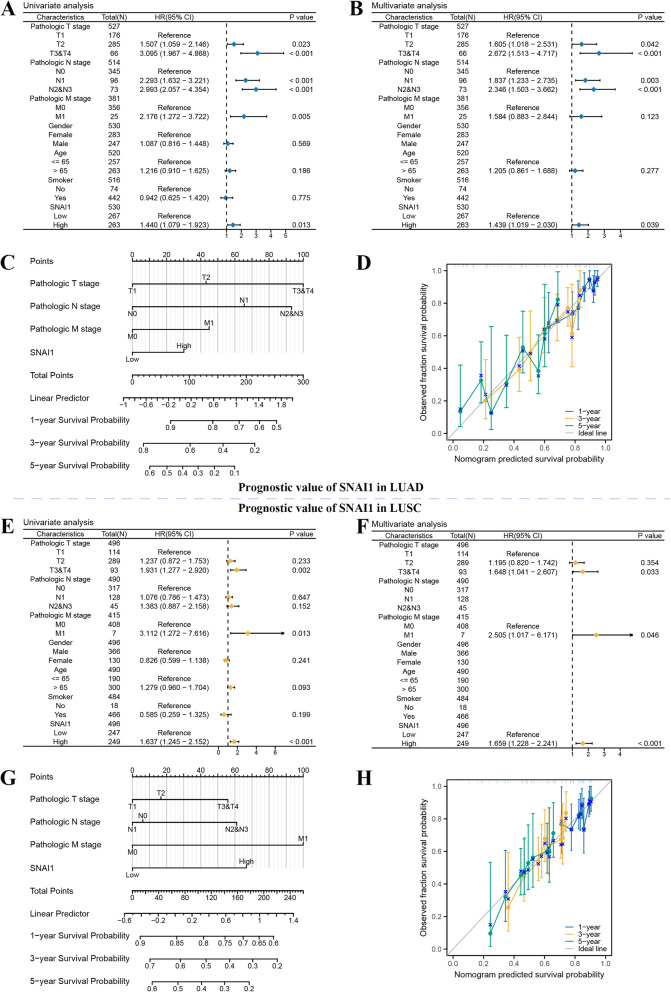
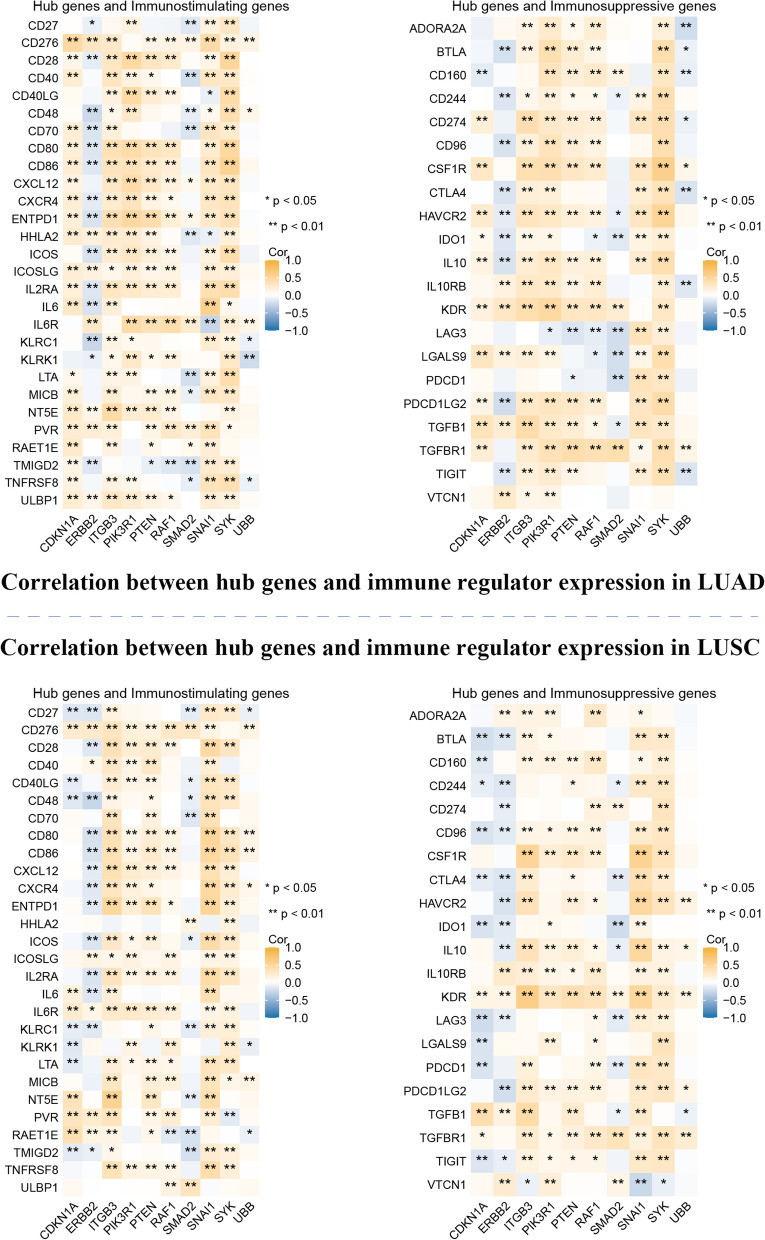
Results: The meta-analysis indicated that miR-486, both individually and in combination, could be effective biomarkers for NSCLC detection. Afterwards, functional enrichment analyses of miR-486 target genes highlighted significant ontology terms and pathways crucial to the initiation and progression of NSCLC. PPI networks revealed key proteins and modules that participate in multiple essential pathways associated with NSCLC pathogenesis. Furthermore, the identified hub genes were validated for differential expression in cancerous versus normal tissues, suggesting their potential diagnostic utility, while subsequent survival analyses confirmed their prognostic value through significant associations with overall survival. Notably, these hub genes were found to be significantly associated with immune infiltration levels, immune microenvironment scores, and immune-related proteins in NSCLC.
Conclusions: This dual-modality investigation establishes miR-486 as a multi-functional biomarker in NSCLC, demonstrating both diagnostic utility and immunoregulatory potential through tumor microenvironment modulation.
Keywords: Biomarker; Immune-cell infiltration; MicroRNA-486; Non-small cell lung cancer.
© 2025. The Author(s).
Conflict of interest statement
Declarations. Ethics approval and consent to participate: Not applicable. Consent for publication: Not Applicable. Competing interests: The authors declare no competing interests.
Figures


Similar articles
-
Identification of key microRNAs and hub genes in non-small-cell lung cancer using integrative bioinformatics and functional analyses.J Cell Biochem. 2020 Mar;121(3):2690-2703. doi: 10.1002/jcb.29489. Epub 2019 Nov 6. J Cell Biochem. 2020. PMID: 31692035
-
Using biological information to analyze potential miRNA-mRNA regulatory networks in the plasma of patients with non-small cell lung cancer.BMC Cancer. 2022 Mar 21;22(1):299. doi: 10.1186/s12885-022-09281-1. BMC Cancer. 2022. PMID: 35313857 Free PMC article.
-
Down-regulation of microRNA-144-3p and its clinical value in non-small cell lung cancer: a comprehensive analysis based on microarray, miRNA-sequencing, and quantitative real-time PCR data.Respir Res. 2019 Mar 4;20(1):48. doi: 10.1186/s12931-019-0994-1. Respir Res. 2019. PMID: 30832674 Free PMC article.
-
Identification of miR-210 and combination biomarkers as useful agents in early screening non-small cell lung cancer.Gene. 2020 Mar 1;729:144225. doi: 10.1016/j.gene.2019.144225. Epub 2019 Dec 9. Gene. 2020. PMID: 31830514
-
Prognostic immune markers in non-small cell lung cancer.Clin Cancer Res. 2011 Aug 15;17(16):5247-56. doi: 10.1158/1078-0432.CCR-10-2805. Epub 2011 Jun 9. Clin Cancer Res. 2011. PMID: 21659461 Review.
Cited by
-
Molecular mechanism of aerobic exercise in miRNAs and the anti-tumoral effects.Front Oncol. 2025 Aug 13;15:1595982. doi: 10.3389/fonc.2025.1595982. eCollection 2025. Front Oncol. 2025. PMID: 40881862 Free PMC article. Review.
References
Publication types
MeSH terms
Substances
LinkOut - more resources
Full Text Sources
Medical
Miscellaneous
