. 2025 May 19;26(1):130.
doi: 10.1186/s13059-025-03602-w.

The gene regulatory mechanisms shaping the heterogeneity of venom production in the Cape coral snake

Affiliations

The gene regulatory mechanisms shaping the heterogeneity of venom production in the Cape coral snake

Pedro G Nachtigall et al. Genome Biol. .

Abstract

Background: Venoms and their associated glands and delivery structures have evolved numerous times among animals. Within these venom systems, the molecular, cellular, and morphological components interact and co-evolve to generate distinct, venom phenotypes that are increasingly recognized as models for studying adaptive evolution. However, toxins are often unevenly distributed across venom-producing tissues in patterns that are not necessarily adaptive but instead likely result from constraints associated with protein secretion.

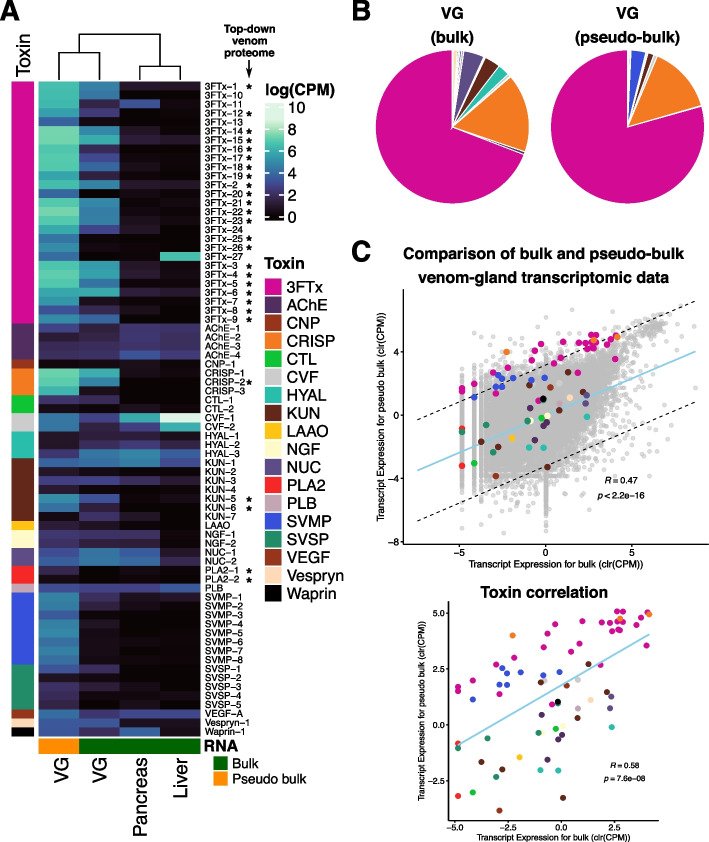
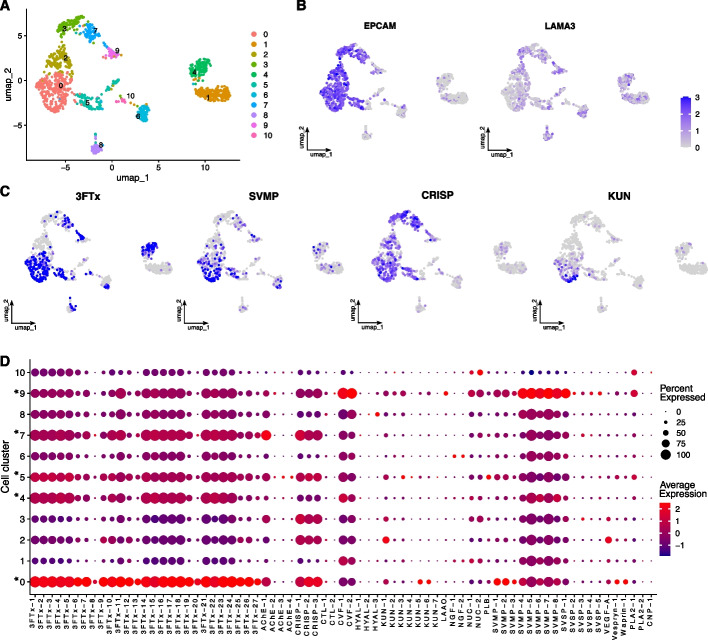
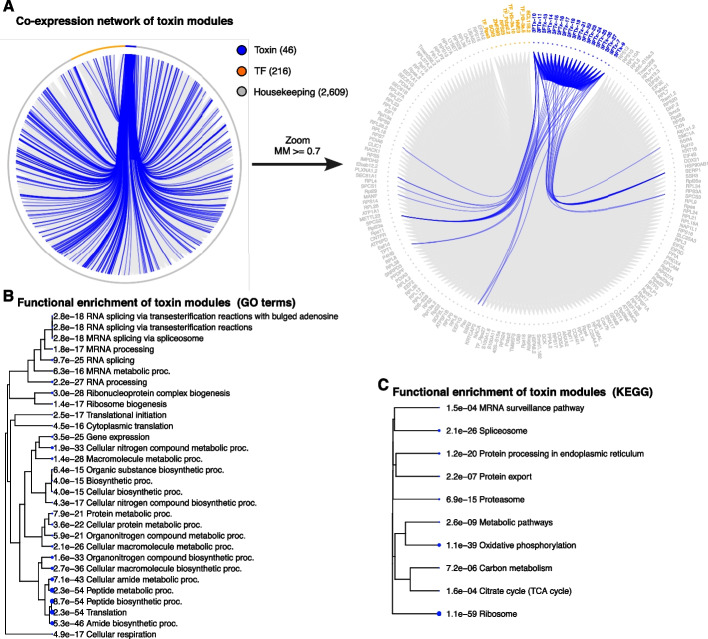
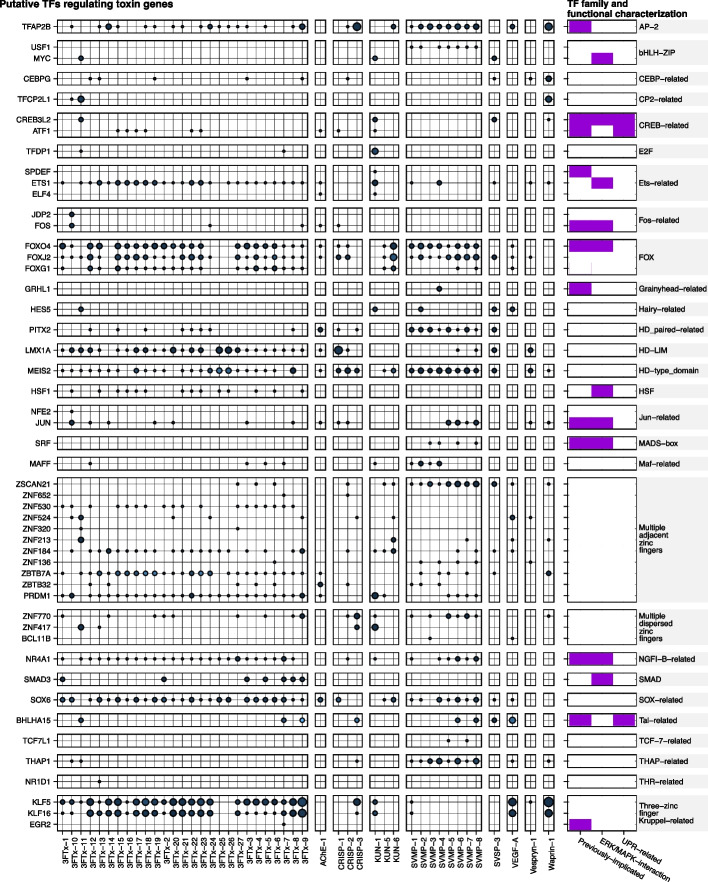
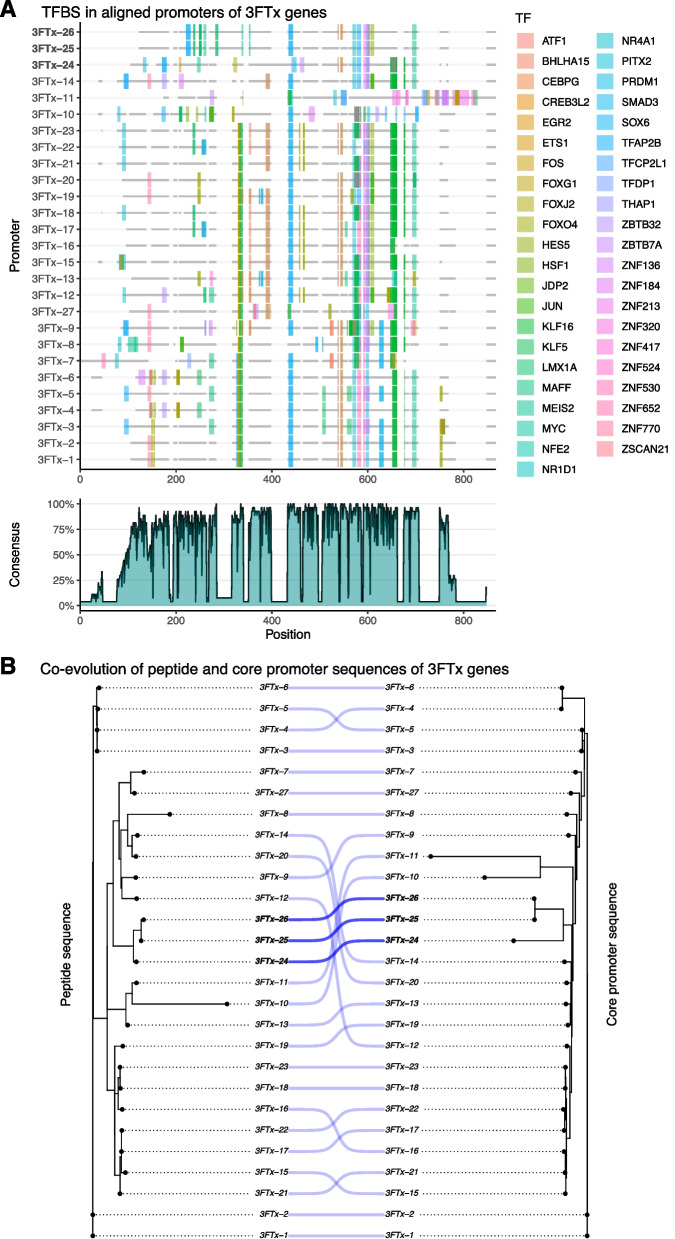
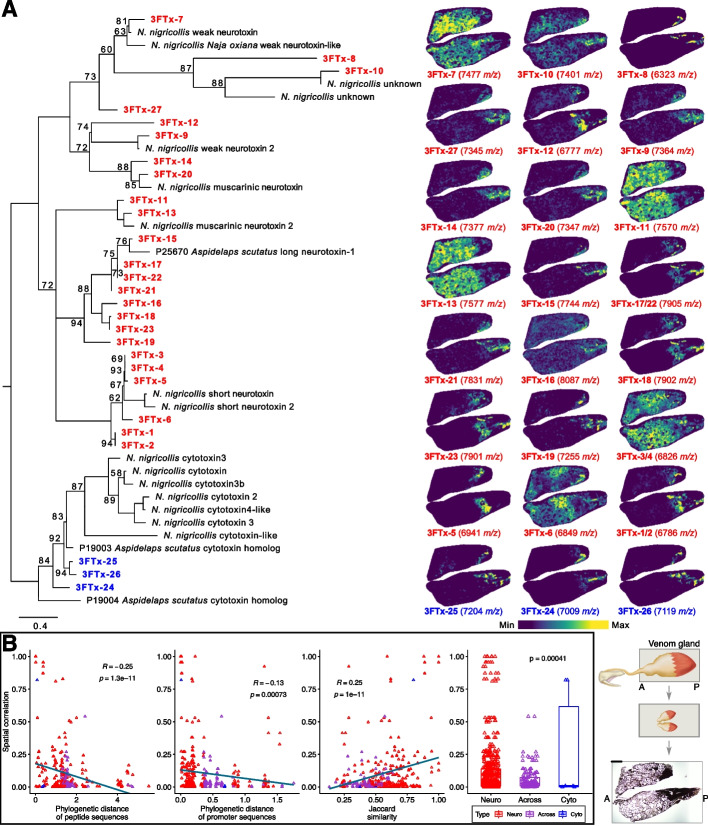
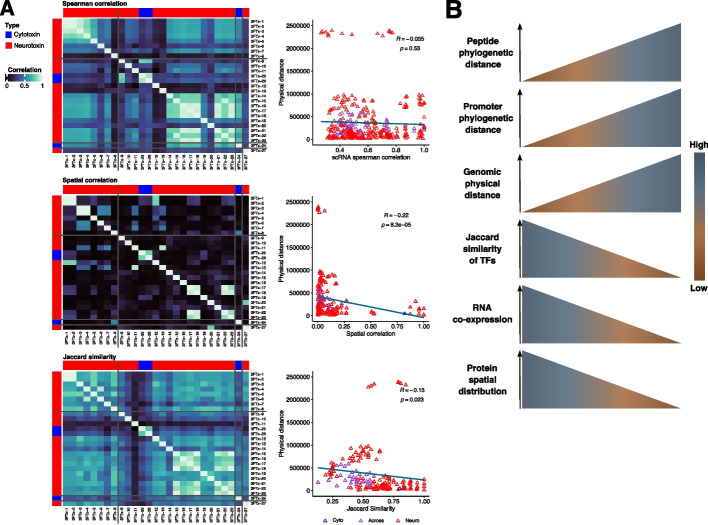
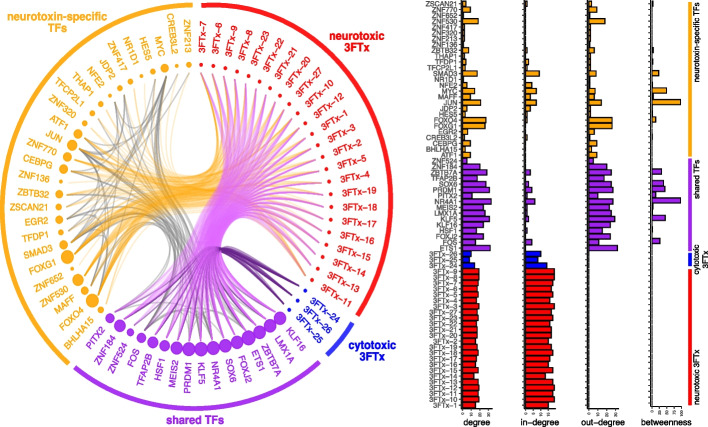
Results: We generate a high-quality draft genome of the Cape coral snake (Aspidelaps lubricus) and combine analyses of venom gland single-cell RNA-seq data with spatial venom gland in situ toxin distributions. Our results reveal that while different toxin families are produced by distinct populations of cells, toxin expression is fine-tuned by regulatory modules that result in further specialization of toxin production within each cell population. We also find that the evolution of regulatory elements closely mirrors the evolution of their associated toxin genes, resulting in spatial association of closely related and functionally similar toxins in the venom gland. While this compartmentalization is non-adaptive, the modularity of the underlying regulatory network likely facilitated the repeated evolution of defensive venom in spitting cobras.

Conclusions: Our results provide new insight into the variability of toxin regulation across snakes, reveal the molecular mechanisms underlying the heterogeneous toxin production in snake venom glands, and provide an example of how constraints can result in non-adaptive character states that appear to be adaptive, which may nevertheless facilitate evolutionary innovation and novelty.

Keywords: Elapidae; Gene regulatory network; Genomics; Mass spectrometry imaging; Toxin; Venomics.


Conflict of interest statement

Declarations. Ethics approval and consent to participate: Not applicable. Competing interests: The authors declare no competing interests.

Figures

Fig. 1
Fig. 1
Comparison of venom gland scRNA-seq (accounted as pseudo-bulk) to bulk transcriptome data. A Heatmap of toxin gene expression in venom gland pseudo-bulk (in orange) and bulk RNA-seq of venom gland, pancreas, and liver (in green). Venom peptide and low molecular weight protein paralogs identified by top-down proteomics are marked with an asterisk. B Proportion of toxin expression in both bulk and pseudo-bulk venom glands. C Bulk and pseudo-bulk toxin expression profiles are correlated when comparing toxin and non-toxin genes as observed in the top scatter plot. The correlation is retained when analyzing only toxin genes. Dashed lines in the top scatter plots denote the 99% confidence interval of non-toxin expression and the light blue line shows the line of best fit based on orthogonal residuals. The light blue line in the bottom scatter plot denotes the line of best fit based on orthogonal residuals. The values within both scatter plots are the Pearson’s correlation coefficient (R) obtained when comparing the expression profile of both datasets. CPM, counts per million; 3 FTx, three-finger toxin; AChE, acetylcholinesterase; CNP, C-type natriuretic peptide; CRISP, cysteine-rich secretory protein; CTL, C-type lectin; CVF, cobra venom factor; HYAL, hyaluronidase; KUN, Kunitz-type toxin; LAAO, L-amino acid oxidase; NGF, nerve growth factor; NUC, nucleotidase; PDE, phosphodiesterase; PLA2, phospholipase A2; PLB, phospholipase B; SVMP, snake venom metalloproteinase; SVSP, snake venom serine protease; VEGF, vascular endothelial growth factor
Fig. 2
Fig. 2
Cell clustering of the scRNA-seq data derived from the venom gland of A. lubricus. A Venom gland cell clustering (n = 1224) visualized using the UMAP approach. Colors represent each cell cluster (n = 11). B Expression levels of epithelial markers (i.e., EPCAM and LAMA3) in UMAP. Color represents a logarithmic scale of transcript expression with darker blue indicating higher expression level. C Average expression levels of the most abundant toxin families: 3 FTx, SVMP, CRISP, and KUN. D Expression profile of toxin genes in each cell cluster. The circle size represents the percent of cells within that cluster expressing that gene, whereas the colors represent the average expression of that toxin in that cluster (with red representing higher expression and dark purple representing lower expression). Asterisks (“*”) represent the toxin clusters
Fig. 3
Fig. 3
Modules of co-expression of toxin producing cells from the venom gland of A. lubricus. A The weighted gene co-expression network of toxin modules using toxin cells comprised 2871 genes. Of these, 46 were toxins (blue), 216 were transcription factors (orange), and 2609 were housekeeping (gray). On the left, a network with all genes within toxin modules. On the right, a zoom in showing genes filtered to have module membership (MM) greater or equal to 0.7 and adjacency greater than 0.01 for better visualization purposes. In both networks, the edges linking to toxin genes are highlighted in blue. B The 30 most significant GO terms of biological processes enriched in the toxin modules. C The 10 most significant KEGG pathways enriched in the toxin modules. Te pathways are shown based on their relationships of GO terms and the calculated p-values are shown before the GO names
Fig. 4
Fig. 4
Transcription factors (TFs) identified as candidates to regulate the toxin gene expression using the toxin cells. Rows correspond to the TFs homologous to profiles at JASPAR in toxin modules and columns correspond to toxin genes in the toxin modules. Circles indicate transcription factor binding sites (TFBSs) in the promoter of the toxin gene. The size corresponds to the number of predicted TFBSs in a given promoter, in which larger circles represent more bound sites. The color corresponds to the network adjacency weights calculated using GENIE3, in which lighter colors represent higher weights. The columns on the far right show the family and function for each TF, indicating whether they were previously implicated in toxin production, directly interacting to the ERK/MAPK pathway, and/or interacting into the UPR pathway (purple squares)
Fig. 5
Fig. 5
Transcription factor binding sites in promoter of 3 FTx genes. A Alignment and conservation of promoter sequences of 3 FTx with the TFBSs identified based on the toxin cells. The gray regions represent alignment gaps. The cytotoxins are highlighted in bold (i.e., 3 FTx-24, 3 FTx-25, and 3 FTx-26). B Co-evolution of peptide and promoter sequence of 3 FTX (see Additional file 1: Figs. S15 and S16 for bootstrap values; Additional file 1: Fig. S17 for correlation of patristic values). The phylogenetic trees inferred from both promoter and peptide sequences reveal similar evolutionary histories for both regions. The cytotoxins and their relationships are highlighted in bold
Fig. 6
Fig. 6
Spatial distributions of 3 FTx in the venom gland of A. lubricus. A On the left, the 3 FTx phylogeny with the bootstraps displayed at nodes and the cytotoxins and neurotoxins colored in blue and red, respectively. On the right, spatial distributions of 3 FTx as determined by MSI are shown as heat-maps across two near-serial sections from the same venom gland. Sections are positioned in mirrored orientation and heatmap color legend is shown below. Bottom right shows (from top to bottom) a schematic representation of the venom gland connected to the fang, the orientation of the sections used for the MSI, and the unstained sections used for MSI (bottom). The anterior region, which is near to the fang, is indicated with “A” and the posterior region, which is distant from the fang, is indicated with “P”. The scale bar represents a size of 500 μm. B Pairwise genetic distance of peptide and promoter sequences and Jaccard similarity of TFs correlated to the pairwise spatial correlations of the 3 FTx paralogs obtained in the MSI. Comparisons within neurotoxins, within cytotoxins, and across them are colored in red, blue, and purple, respectively
Fig. 7
Fig. 7
Correlation of spatial 3 FTx co-occurrence and their physical genomic distance. A Correlation of physical distance when compared to the following (from top to bottom): the spearman correlation of expression within cells in the scRNA-seq data, the spatial correlation of protein distribution within the venom gland, and the Jaccard similarity based on the toxin cells dataset. The heatmap shows each correlation and the dark gray lines indicate whether a 3 FTx is located within the same scaffold. The 3 FTx are sorted by their genomic distances. On the right, scatterplots show the correlation analysis. B Schematic overview of the analysis performed in the present study showing that modules of TF correlated to the heterogeneity of 3 FTx toxin production in A. lubricus
Fig. 8
Fig. 8
Modules of transcription factors in the genetic regulatory network (GRN) of 3 FTx. GRN inferred for the cytotoxic and neurotoxic 3 FTx using the toxin cells. Neurotoxins, cytotoxins, shared TFs, and neurotoxin-specific TFs are colored in red, blue, purple, and orange, respectively. The size of circles represents the out-degree of genes in the GRN. The orange edges indicate which neurotoxin-specific TF is binding to the neurotoxic 3 FTx. The magenta and dark purple edges indicate which shared TF is binding to neurotoxins or cytotoxins, respectively. The gray edges indicate the protein-protein interactions between TFs retrieved from the STRING database. On the right, the degree (total number of connections of each node), in-degree (number of incoming connections), out-degree (number of outgoing connections), and betweenness (number of times a node is the shortest path between other nodes) centrality measures obtained for each gene in the GRN showing relevant TFs controlling the 3 FTx expression profile observed

Similar articles

References

    1. Asp M, Giacomello S, Larsson L, Wu C, Fürth D, Qian X, et al. A spatiotemporal organ-wide gene expression and cell atlas of the developing human heart. Cell. 2019;179(7):1647–60. - PubMed
    1. Jiang S, Huang Z, Li Y, Yu C, Yu H, Ke Y, et al. Single-cell chromatin accessibility and transcriptome atlas of mouse embryos. Cell Rep. 2023;42(3):112210. - PubMed
    1. Altschuler SJ, Wu LF. Cellular heterogeneity: do differences make a difference? Cell. 2010;141(4):559–63. - PMC - PubMed
    1. Snijder B, Pelkmans L. Origins of regulated cell-to-cell variability. Nat Rev Mol Cell Biol. 2011;12(2):119–25. - PubMed
    1. Carter B, Zhao K. The epigenetic basis of cellular heterogeneity. Nat Rev Genet. 2021;22(4):235–50. - PMC - PubMed

LinkOut - more resources