

Distinct microbial communities drive methane cycling in below- and above-ground compartments of tropical cloud forests growing on peat
- PMID: 40390074
- PMCID: PMC12090414
- DOI: 10.1186/s40793-025-00718-1
Distinct microbial communities drive methane cycling in below- and above-ground compartments of tropical cloud forests growing on peat
Abstract
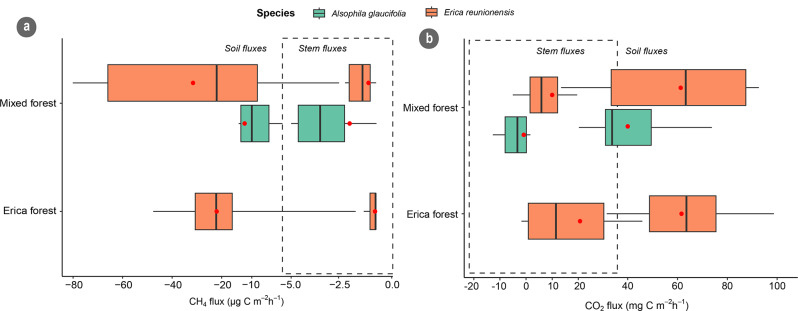
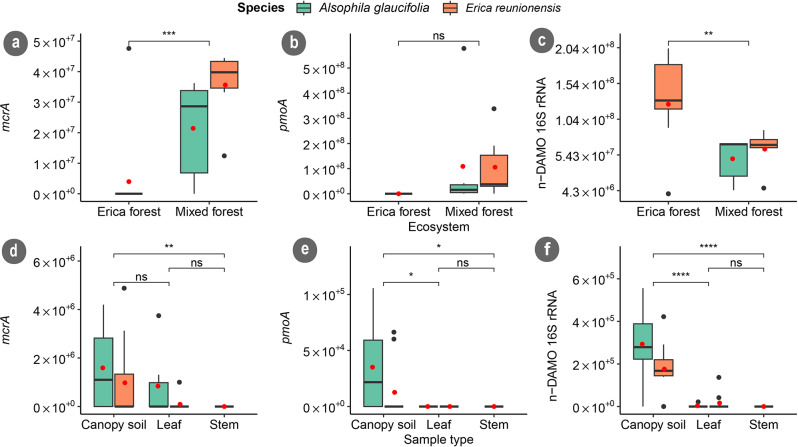
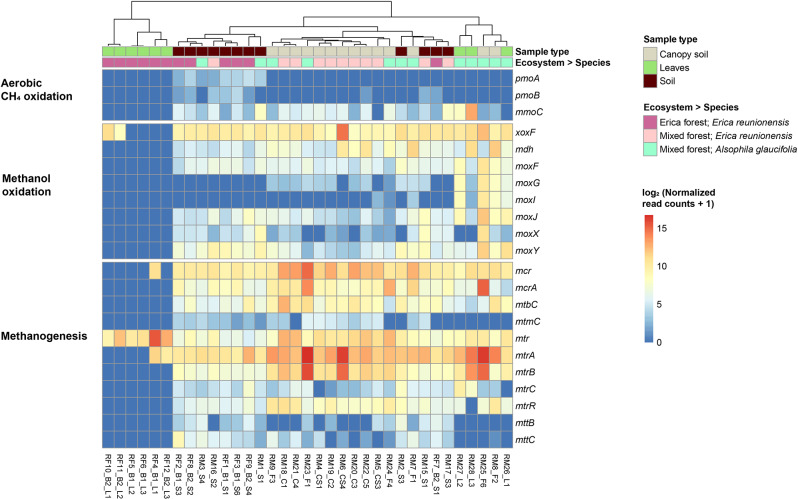
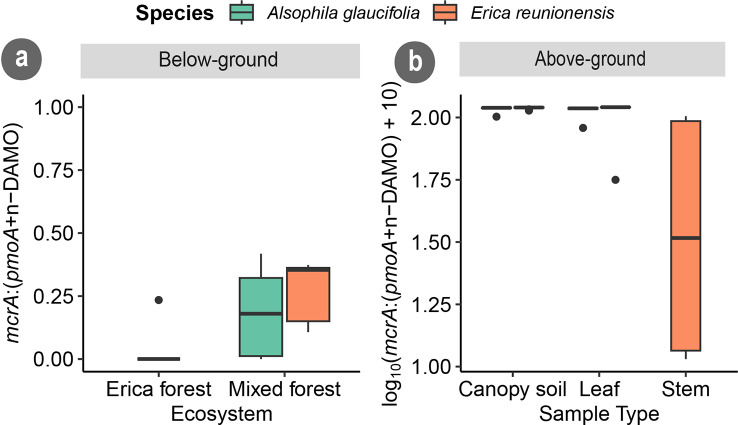
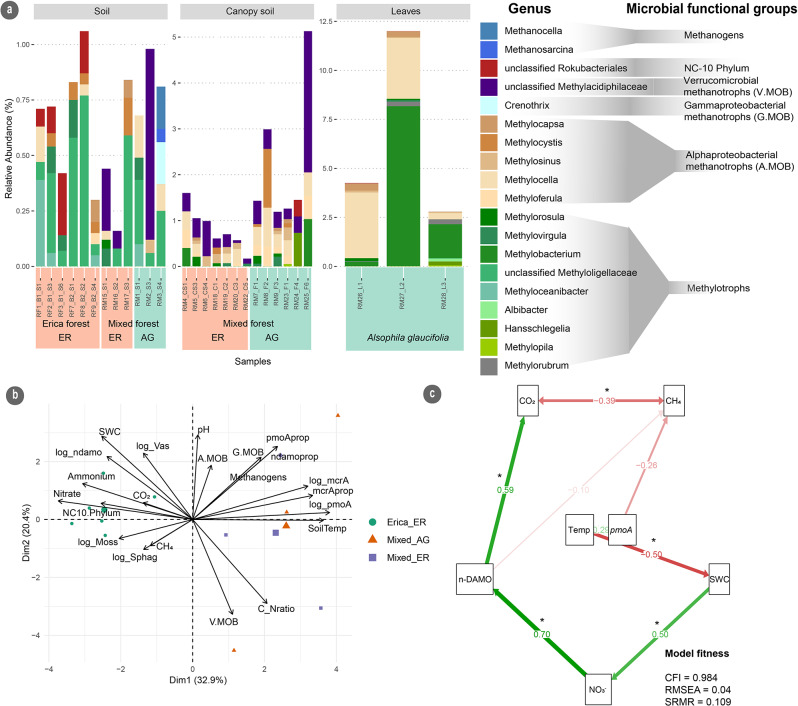
Cloud forests are unique yet understudied ecosystems regarding CH4 exchange despite their significance in carbon storage. We investigated CH4 fluxes in peat soil and tree stems of two tropical cloud forests on Réunion Island, one featuring Erica reunionensis and the second a mix of E. reunionensis and Alsophila glaucifolia. The study examined microbiomes across below-ground (soil) and above-ground (canopy soil, leaves, and stems) forest compartments. Metagenomics and qPCR analyses targeted key genes in methanogenesis and methanotrophy in soil and above-ground samples, alongside soil physicochemical measurements. CH4 fluxes from peat soil and tree stems were measured using gas chromatography and portable trace gas analyzers. Peat soil in both forests acted as a CH4 sink (- 23.8 ± 4.84 µg C m- 2 h- 1) and CO2 source (55.5 ± 5.51 µg C m- 2 h- 1), with higher CH4 uptake in sites dominated by endemic tree species E. reunionensis. In forest soils, a high abundance of n-DAMO 16 S rRNA gene (3.42 × 10⁷ ± 7 × 10⁶ copies/g dw) was associated with nitrate levels and higher rates of CH4 uptake and CO2 emissions. NC-10 bacteria (0.1-0.3%) were detected in only the Erica forest soil, verrucomicrobial methanotrophs (0.1-3.1%) only in the mixed forest soil, whereas alphaproteobacterial methanotrophs (0.1-3.3%) were present in all soils. Tree stems in both forests were weak sinks of CH4 (-0.94 ± 0.4 µg C m- 2 h- 1). The canopy soil hosted verrucomicrobial methanotrophs (0.1-0.3%). The leaves in both forests exhibited metabolic potential for CH4 production, e.g., exhibiting high mcrA copy numbers (3.5 × 10⁵ ± 2.3 × 10⁵ copies/g dw). However, no CH4-cycling functional genes were detected in the stem core samples. Tropical cloud forest peat soils showed high anaerobic methanotrophy via the n-DAMO process, while aerobic methanotrophs were abundant in canopy soils. Leaves hosted methanotrophs but predominantly methanogens. These results highlight the significant differences between canopy and soil microbiomes in the CH4 cycle, emphasizing the importance of above-ground microbiomes in forest CH4 gas budgets.
Keywords: Canopy soil microbiome; Leaf microbiome; Peatlands; Phyllosphere microbiome; Soil microbiome; Stem microbiome.
© 2025. The Author(s).
Conflict of interest statement
Declarations. Competing interests: The authors declare no competing interests.
Figures
Similar articles
-
Nitrogen cycling genes abundance in soil and aboveground compartments of tropical peatland cloud forests and a wetland on Réunion Island.Sci Rep. 2025 Jul 25;15(1):27155. doi: 10.1038/s41598-025-12367-y. Sci Rep. 2025. PMID: 40715451 Free PMC article.
-
Temporal dynamics of soil microbial C and N cycles with GHG fluxes in the transition from tropical peatland forest to oil palm plantation.Appl Environ Microbiol. 2025 Jan 31;91(1):e0198624. doi: 10.1128/aem.01986-24. Epub 2024 Dec 23. Appl Environ Microbiol. 2025. PMID: 39714193 Free PMC article.
-
Ecosystem-scale methane flux in tropical peat swamp forest in Indonesia.Glob Chang Biol. 2018 Nov;24(11):5123-5136. doi: 10.1111/gcb.14410. Epub 2018 Sep 2. Glob Chang Biol. 2018. PMID: 30175421
-
Methane cycling in temperate forests.Carbon Balance Manag. 2024 Oct 22;19(1):37. doi: 10.1186/s13021-024-00283-z. Carbon Balance Manag. 2024. PMID: 39438363 Free PMC article. Review.
-
Methane production and emissions in trees and forests.New Phytol. 2019 Apr;222(1):35-51. doi: 10.1111/nph.15624. Epub 2019 Jan 11. New Phytol. 2019. PMID: 30521089 Review.
Cited by
-
Nitrogen cycling genes abundance in soil and aboveground compartments of tropical peatland cloud forests and a wetland on Réunion Island.Sci Rep. 2025 Jul 25;15(1):27155. doi: 10.1038/s41598-025-12367-y. Sci Rep. 2025. PMID: 40715451 Free PMC article.
References
-
- IPCC. Climate Change 2023: Synthesis Report. Contribution of Working Groups I, II and III to the Sixth Assessment Report of the Intergovernmental Panel on Climate Change. Geneva, Switzerland: IPCC; 2023.
-
- Conrad R. The global methane cycle: recent advances in Understanding the microbial processes involved. Environ Microbiol Rep. 2009;1:285–92. - PubMed
-
- Feng H, Guo J, Peng C, Ma X, Kneeshaw D, Chen H, et al. Global estimates of forest soil methane flux identify a temperate and tropical forest methane sink. Geoderma. 2023;429:116239.
-
- Dutaur L, Verchot LV. A global inventory of the soil CH4 sink. Glob Biogeochem Cycles. 2007;21.
-
- Bastviken D, Treat CC, Pangala SR, Gauci V, Enrich-Prast A, Karlson M, et al. The importance of plants for methane emission at the ecosystem scale. Aquat Bot. 2023;184:103596.
Grants and funding
LinkOut - more resources
Full Text Sources