Urbanization and genetic homogenization in the medieval Low Countries revealed through a ten-century paleogenomic study of the city of Sint-Truiden
- PMID: 40390081
- PMCID: PMC12090598
- DOI: 10.1186/s13059-025-03580-z
Urbanization and genetic homogenization in the medieval Low Countries revealed through a ten-century paleogenomic study of the city of Sint-Truiden
Abstract
Background: Processes shaping the formation of the present-day population structure in highly urbanized Northern Europe are still poorly understood. Gaps remain in our understanding of when and how currently observable regional differences emerged and what impact city growth, migration, and disease pandemics during and after the Middle Ages had on these processes.
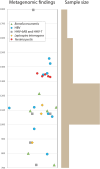
Results: We perform low-coverage sequencing of the genomes of 338 individuals spanning the eighth to the eighteenth centuries in the city of Sint-Truiden in Flanders, in the northern part of Belgium. The early/high medieval Sint-Truiden population was more heterogeneous, having received migrants from Scotland or Ireland, and displayed less genetic relatedness than observed today between individuals in present-day Flanders. We find differences in gene variants associated with high vitamin D blood levels between individuals with Gaulish or Germanic ancestry. Although we find evidence of a Yersinia pestis infection in 5 of the 58 late medieval burials, we were unable to detect a major population-scale impact of the second plague pandemic on genetic diversity or on the elevated differentiation of immunity genes.
Conclusions: This study reveals that the genetic homogenization process in a medieval city population in the Low Countries was protracted for centuries. Over time, the Sint-Truiden population became more similar to the current population of the surrounding Limburg province, likely as a result of reduced long-distance migration after the high medieval period, and the continuous process of local admixture of Germanic and Gaulish ancestries which formed the genetic cline observable today in the Low Countries.
Keywords: Flanders; Low countries; Medieval; Migration; Palaeo-genomics; Plague; Urbanization.
© 2025. The Author(s).
Conflict of interest statement
Declarations. Ethics approval and consent to participate: Formal approval for destructive sampling of the skeletal material for this study was obtained from the City Council of Sint-Truiden. The study was approved by the KU Leuven Ethics Committee Research (number S65247). Consent for publication: Not applicable. Competing interests: The authors declare no competing interests.
Figures


Similar articles
-
Capturing the fusion of two ancestries and kinship structures in Merovingian Flanders.Proc Natl Acad Sci U S A. 2024 Jul 2;121(27):e2406734121. doi: 10.1073/pnas.2406734121. Epub 2024 Jun 24. Proc Natl Acad Sci U S A. 2024. PMID: 38913897 Free PMC article.
-
Integrative approach using Yersinia pestis genomes to revisit the historical landscape of plague during the Medieval Period.Proc Natl Acad Sci U S A. 2018 Dec 11;115(50):E11790-E11797. doi: 10.1073/pnas.1812865115. Epub 2018 Nov 26. Proc Natl Acad Sci U S A. 2018. PMID: 30478041 Free PMC article.
-
Yersinia pestis DNA from skeletal remains from the 6(th) century AD reveals insights into Justinianic Plague.PLoS Pathog. 2013;9(5):e1003349. doi: 10.1371/journal.ppat.1003349. Epub 2013 May 2. PLoS Pathog. 2013. PMID: 23658525 Free PMC article.
-
Molecular history of plague.Clin Microbiol Infect. 2016 Nov;22(11):911-915. doi: 10.1016/j.cmi.2016.08.031. Epub 2016 Sep 8. Clin Microbiol Infect. 2016. PMID: 27615720 Review.
-
Reflections on crisis burials related to past plague epidemics.Clin Microbiol Infect. 2012 Mar;18(3):218-23. doi: 10.1111/j.1469-0691.2012.03787.x. Clin Microbiol Infect. 2012. PMID: 22369154 Review.
References
Publication types
MeSH terms
Grants and funding
- G0A4521N/Fonds Wetenschappelijk Onderzoek
- S003422N/Fonds Wetenschappelijk Onderzoek
- G0A4521N/Fonds Wetenschappelijk Onderzoek
- G0A4521N/Fonds Wetenschappelijk Onderzoek
- G0A4521N/Fonds Wetenschappelijk Onderzoek
- G0A4521N/Fonds Wetenschappelijk Onderzoek
- ZKD6488 C24M/19/075/KU Leuven
- ZKD6488 C24M/19/075/KU Leuven
- ZKD6488 C24M/19/075/KU Leuven
- PRG1027/Estonian Research Council
- PRG1027/Estonian Research Council
- PRG1027/Estonian Research Council
- PRG1027/Estonian Research Council
- PRG1027/Estonian Research Council
- 10.55776/ESP162/Austrian Science Fund
- TK215/Estonian Ministry of Education and Research
- TK215/Estonian Ministry of Education and Research
- TK215/Estonian Ministry of Education and Research
- TK215/Estonian Ministry of Education and Research
- 885137/ERC_/European Research Council/International
- CZ.02.01.01/00/22_008/0004593/Czech Ministry of Education, Youth and Sports
- 3M220588/Agentschap Onroerend Erfgoed
LinkOut - more resources
Full Text Sources

