. 2025 May 19;17(1):57.
doi: 10.1186/s13073-025-01476-y.

RNA polymerase I is essential for driving the formation of 3D genome in early embryonic development in mouse, but not in human

Affiliations

RNA polymerase I is essential for driving the formation of 3D genome in early embryonic development in mouse, but not in human

Changliang Hou et al. Genome Med. .

Abstract

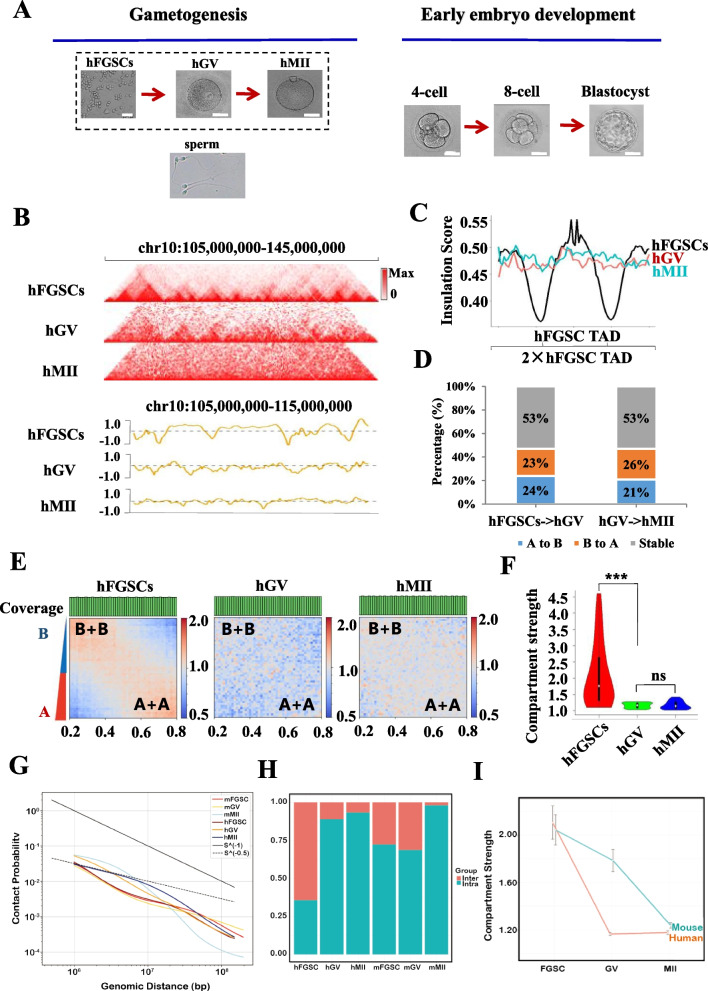
Background: Three-dimensional (3D) chromatin architecture undergoes dynamic reorganization during mammalian gametogenesis and early embryogenesis. While mouse studies have shown species-specific patterns as well as mechanisms underlying de novo organization, these remain poorly characterized in humans. Although RNA polymerases II and III have been shown to regulate chromatin structure, the potential role of RNA polymerase I (Pol I), which drives ribosomal RNA production, in shaping 3D genome organization during these developmental transitions has not been investigated.

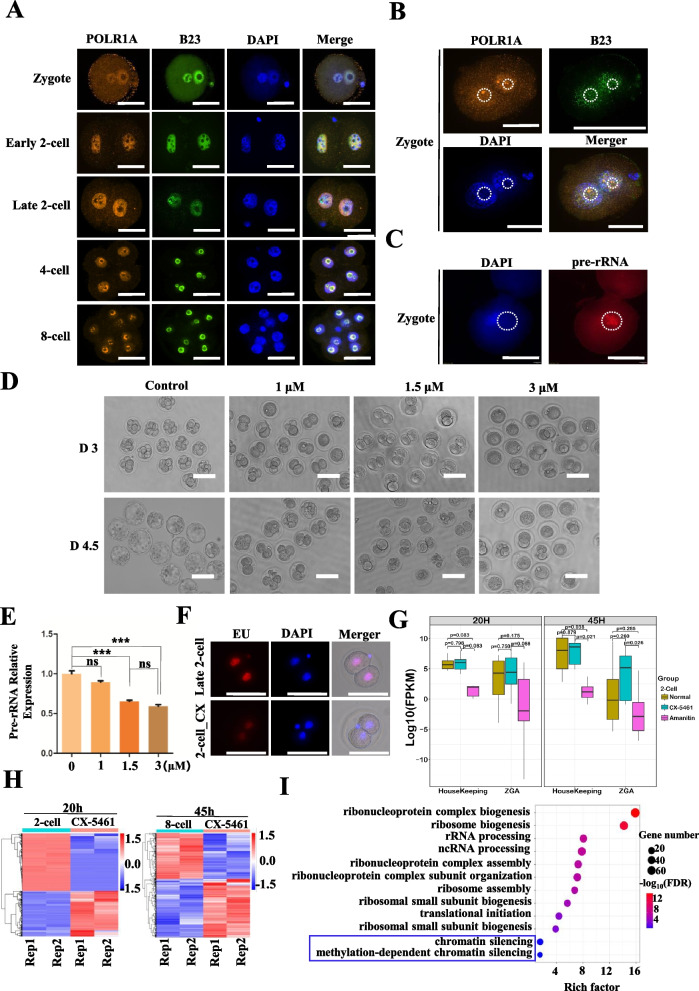
Methods: We employed a modified low-input in situ Hi-C approach to systematically compare 3D genome architecture dynamics from gametogenesis through early embryogenesis in human and mouse. Complementary Smart-seq2 for low-input transcriptomics, CUT&Tag for Pol I profiling, and Pol I functional inhibition assays were performed to elucidate the mechanisms governing chromatin organization.

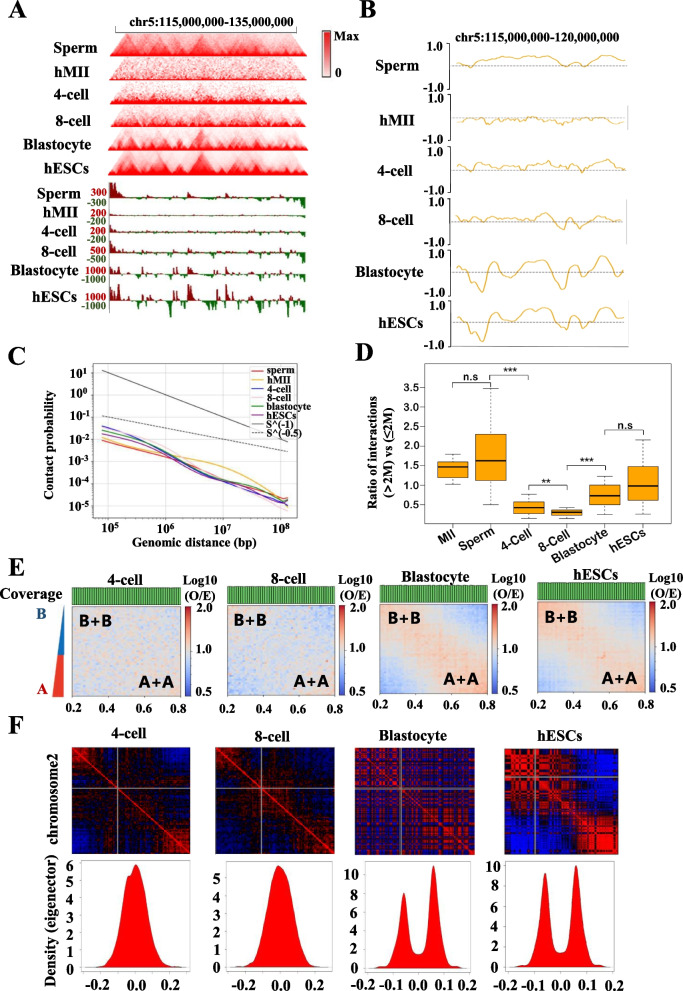
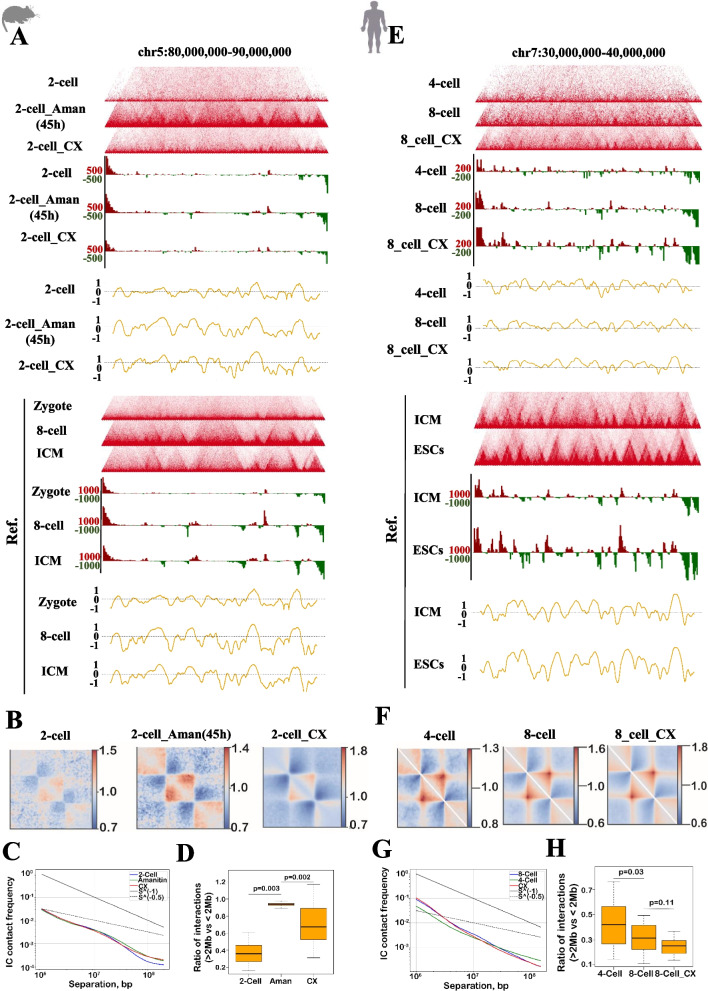
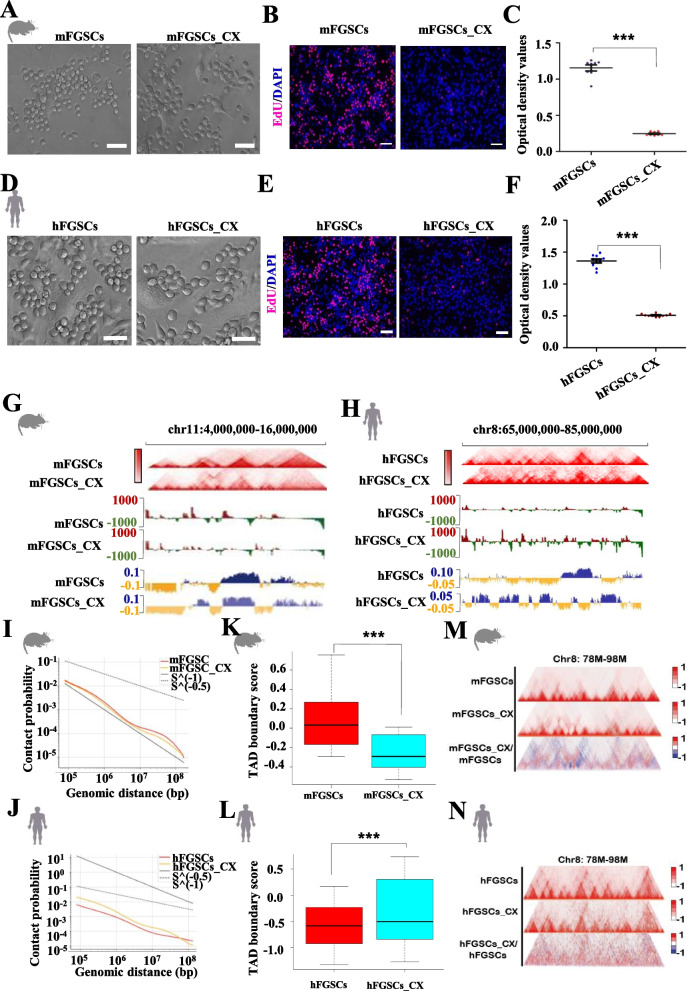
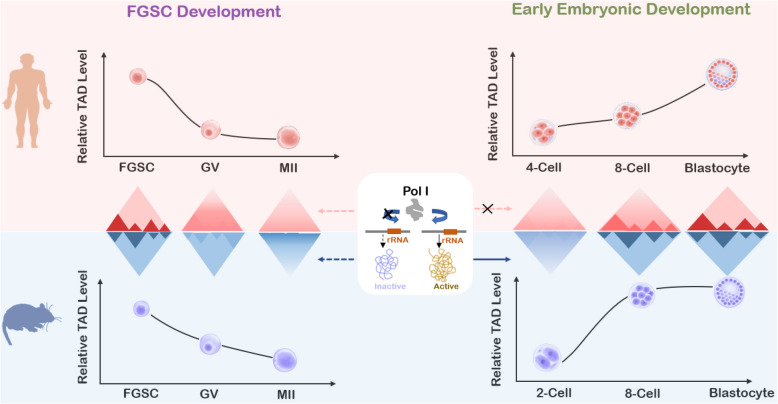
Results: Our study revealed an extensive reorganization of the 3D genome from human oogenesis to early embryogenesis, displaying significant differences with the mouse, including dramatically attenuated topologically associating domains (TADs) at germinal vesicle (GV) stage oocytes. The 3D genome reconstruction timing is a fundamental difference between species. In human, reconstruction initiates at the 4-cell stage embryo in human, while in mouse, it commences at the 2-cell stage embryo. We discovered that Pol I is crucial for establishing the chromatin structures during mouse embryogenesis, but not in human embryos. Intriguingly, the absence of Pol I transcription weakens TAD structure in mouse female germline stem cells, whereas it fortifies it in human counterparts.

Conclusions: These observed interspecies distinctions in chromatin organization dynamics provide novel insights into the evolutionary divergence of chromatin architecture regulation during early mammalian development. Our findings provide mechanistic insights into species-specific chromatin organization during germ cell and embryonic development and have potential implications for fertility preservation and birth defect prevention.

Keywords: Chromatin structure; Early embryonic development; Polymerase I; Stem cell.


Conflict of interest statement

Declarations. Ethics approval and consent to participate: This study was approved by the institutional review boards of The Affiliated Ren Ji Hospital of Shanghai Jiao Tong University (2019122701), Affiliated Tongji Hospital of Tongji University (2020-KYSB- 048), Shanghai First Maternity, and Infant Hospital (KS21280), The First Affiliated Hospital of Anhui Medical University (2020H026), and Shuguang Hospital Affiliated to Shanghai University of Traditional Chinese Medicine (2020–866 - 75–01). The study was conducted in accordance with the measures of the People’s Republic of China on the administration of human-assisted reproductive technology, the ethical principles of human-assisted reproductive technology, and the Helsinki Declaration. All participants provided written informed consent to participate in the study. All animal experiments were conducted in accordance with the recommendations of the Guide for the Care and Use of Laboratory Animals and relevant Chinese laws and regulations, and were approved by the Institutional Animal Care and Use Committee (IACUC) of Shanghai Jiao Tong University (Spatiotemporal dynamics and regulatory mechanisms of gametogenesis and embryonic development in mammals, A2019118). Competing interests: The authors declare that they have no competing interests.

Figures

Fig. 1
Fig. 1
Dynamic TADs and chromatin compartmentalization during human FGSC development. A Morphology of human germ cells and early embryos. Scale bar, 50 µm or 10 µm (Sperm). B Normalized Hi-C interaction frequencies displayed as a heatmap (top) and TAD signals (bottom) during hFGSC development at chromosome 10. C Average insulation scores (IS) of various stages at TAD and nearby regions. IS measures the frequency of chromatin interactions across a given genomic position, with local minima indicating potential TAD boundaries where cross-boundary interactions are depleted. A lower insulation score suggests stronger boundary activity. D Percentage of switched A/B compartments occupied in the genome during hFGSC development. E Saddle plot showing the compartment strength of (A+A) and (B+B) during hFGSC development. F Violin plot showing the change in compartment strength during hFGSC development (Wilcox test, ***p<0.001, ns: p>0.05). G Average contact probability across the genome was decreased as a function of genomic distance between humans and mice during FGSC development. H Percentage of inter-chromosomal and intra-chromosomal contacts between humans and mice during FGSC development. I Compartment strength between humans and mice during FGSC development (P<0.05, calculated by the Wilcoxon test)
Fig. 2
Fig. 2
Dynamic TADs and chromatin compartmentalization during early embryonic development. A Top: Heatmap showing the normalized Hi-C interaction frequency. Bottom: Barplot showing the directional index (DI) at various developmental stages. B Relative variation degree of TAD signals in human embryo. C Average contact probability across the genome decreases as a function of genomic distance during human early embryonic development. D The total interaction ratio between genome distance >2 Mb and ≤2 Mb during human early embryonic development (Wilcox test, ns: p>0.05, ***p<0.001). E Saddle plot showing the compartment strength of (A+A) and (B+B) during human early embryonic development. F Top: Pearson correlation heatmap of chromosome 2 in human early embryos at a 500 kb resolution during human early embryonic development. Bottom: Density plots of eigenvector values considering autosomes during human early embryonic development
Fig. 3
Fig. 3
Pol I I plays a critical role in mouse early embryonic development. A Immunofluorescence of POLR1A in early mouse embryos fixed with paraformaldehyde. It is stained by the nucleolar marker B23 (Npm1, green), POLR1A (orange), and DAPI (blue). Scale bar, 50 µm. B Immunofluorescence of POLR1A in mouse zygotic embryos fixed with Carnoy’s fixative. It is stained by the nucleolar marker B23 (Npm1, green), POLR1A (orange), and DAPI (blue). Scale bar, 50 µm. C RNA-FISH detection of Pol I transcription in mouse zygotic embryos. It is stained by pre-rRNA (red) and DAPI (blue). Scale bar, 50 µm. D Inhibition of Pol I transcription affected mouse embryonic development. Scale bar, 50 µm. E qRT-PCR was used to measure the rRNA transcription after CX-5461 treatment (Students’ t test, ns: p>0.05, ***p<0.001). F EU detection of RNA transcription in mouse zygotic embryos. Scale bar, 50 µm. G Expression of ZGA genes and house-keeping genes in different condition of treatment. H Clustering analysis of differential gene expression patterns between control and CX-5461 inhibitor treatment. I GO enrichment analysis of different expressed genes after CX-5461 treatment for 45 h
Fig. 4
Fig. 4
Changes of the TAD structure in mouse and human embryos after inhibiting Pol I transcription. A Interaction frequency heatmap of mouse early embryos at a 25 kb resolution. B Genome-wide TAD signals in mouse 2-Cell, mouse 2-Cell_α-amanitin, and mouse 2-Cell_CX5461 groups. C Average contact probability across the genome was decreased as a function of genomic distance in 2-Cell, 2-Cell_α-amanitin, and 2-Cell_CX5461 groups in mouse. D Ratio of total interactions between genomic distances of >2 Mb and 2 Mb in mouse (Wilcox test, ns: p>0.05). E Interaction frequency heatmap of human early embryos at a 25 kb resolution. F Genome-wide TAD signals in human 4-Cell, human 8-Cell, and human 8-Cell_CX5461 groups. G Average contact probability across the genome was decreased as a function of genomic distance in 2-Cell, 2-Cell_α-amanitin, and 2-Cell_CX5461 groups in human. H Ratio of total interactions between genomic distances of >2 Mb and 2 Mb in humans (Wilcox test, ns: p>0.05)
Fig. 5
Fig. 5
Effect of RNA transcription on chromatin structures in mouse and human FGSCs. A Morphological changes of mFGSCs before and after CX-5461 treatment. Scale bar, 50 µm. B mFGSC proliferation was assessed by EdU assays. C mFGSC viability was assessed by CCK-8 assays (Students’ t test, ***p<0.001). D Morphological changes of hFGSCs before and after CX-5461 treatment. Scale bar, 50 µm. E hFGSC proliferation was assessed by EdU assays. F hFGSC viability was assessed by CCK-8 assays (Students’ t test, ***p<0.001). G,H Standardized Hi-C interaction heatmap, directional indexes (DIs), and first principal component (PC1) values in mice (G) and humans (H) at a 40 kb resolution. I, J Average contact probability across the genome decreases as a function of genomic distance in mice (I) and humans (J). K, L Box plot showing the change in the TAD boundary intensity before and after Pol I transcriptional inhibition in mouse (K) and human FGSCs (L) (Wilcox test, **p<0.01, ***p<0.001). M, N Representative region showing the chromatin interaction within the TAD structure at a 40 kb resolution in mouse (M) and human FGSCs (N) between control and treatment
Fig. 6
Fig. 6
Graph of Pol I function of 3D genome in FGSC development and early embryonic development between mouse and human

Similar articles

References

    1. Pope BD, Ryba T, Dileep V, Yue F, Wu W, Denas O, Vera DL, Wang Y, Hansen RS, Canfield TK, et al. Topologically associating domains are stable units of replication-timing regulation. Nature. 2014;515(7527):402–5. - PMC - PubMed
    1. Lieberman-Aiden E, van Berkum NL, Williams L, Imakaev M, Ragoczy T, Telling A, Amit I, Lajoie BR, Sabo PJ, Dorschner MO, et al. Comprehensive mapping of long-range interactions reveals folding principles of the human genome. Science. 2009;326(5950):289–93. - PMC - PubMed
    1. Nora EP, Lajoie BR, Schulz EG, Giorgetti L, Okamoto I, Servant N, Piolot T, van Berkum NL, Meisig J, Sedat J, et al. Spatial partitioning of the regulatory landscape of the X-inactivation centre. Nature. 2012;485(7398):381–5. - PMC - PubMed
    1. Bonev B, Mendelson Cohen N, Szabo Q, Fritsch L, Papadopoulos GL, Lubling Y, Xu X, Lv X, Hugnot JP, Tanay A, Cavalli G. Multiscale 3D genome rewiring during mouse neural development. Cell. 2017;171(3):557–72. - PMC - PubMed
    1. Rao SSP, Huntley MH, Durand NC, Stamenova EK, Bochkov ID, Robinson JT, Sanborn AL, Machol I, Omer AD, Lander ES. A 3D map of the human genome at kilobase resolution reveals principles of chromatin looping. Cell. 2014;159(7):1665–80. - PMC - PubMed

LinkOut - more resources