. 2025 May 19;13(1):126.
doi: 10.1186/s40168-025-02120-y.

Interactions with native microbial keystone taxa enhance the biocontrol efficiency of Streptomyces

Affiliations

Interactions with native microbial keystone taxa enhance the biocontrol efficiency of Streptomyces

Tianyu Sun et al. Microbiome. .

Erratum in

Abstract

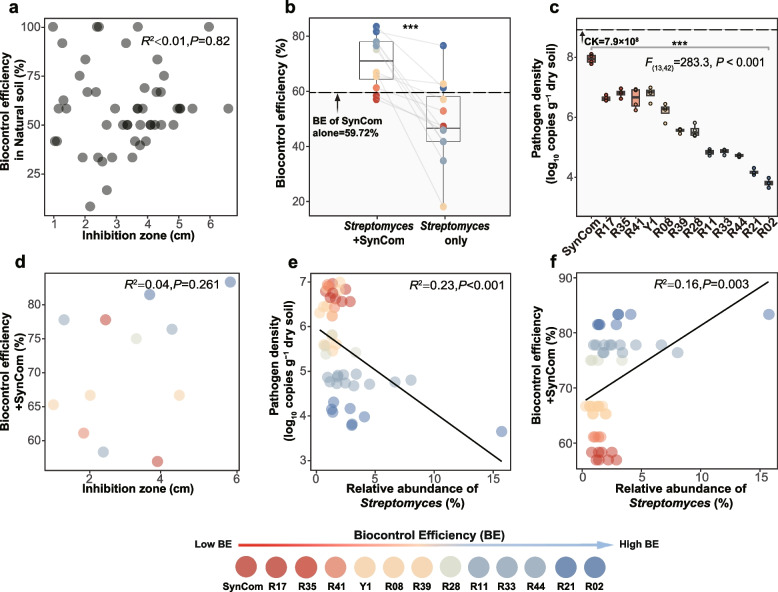
Background: Streptomyces spp. are known for producing bioactive compounds that suppress phytopathogens. However, previous studies have largely focused on their direct interactions with pathogens and plants, often neglecting their interactions with the broader soil microbiome. In this study, we hypothesized that these interactions are critical for effective pathogen control. We investigated a diverse collection of Streptomyces strains to select those with strong protective capabilities against tomato wilt disease caused by Ralstonia solanacearum. Leveraging a synthetic community (SynCom) established in our lab, alongside multiple in planta and in vitro co-cultivation experiments, as well as transcriptomic and metabolomic analyses, we explored the synergistic inhibitory mechanisms underlying bacterial wilt resistance facilitated by both Streptomyces and the soil microbiome.

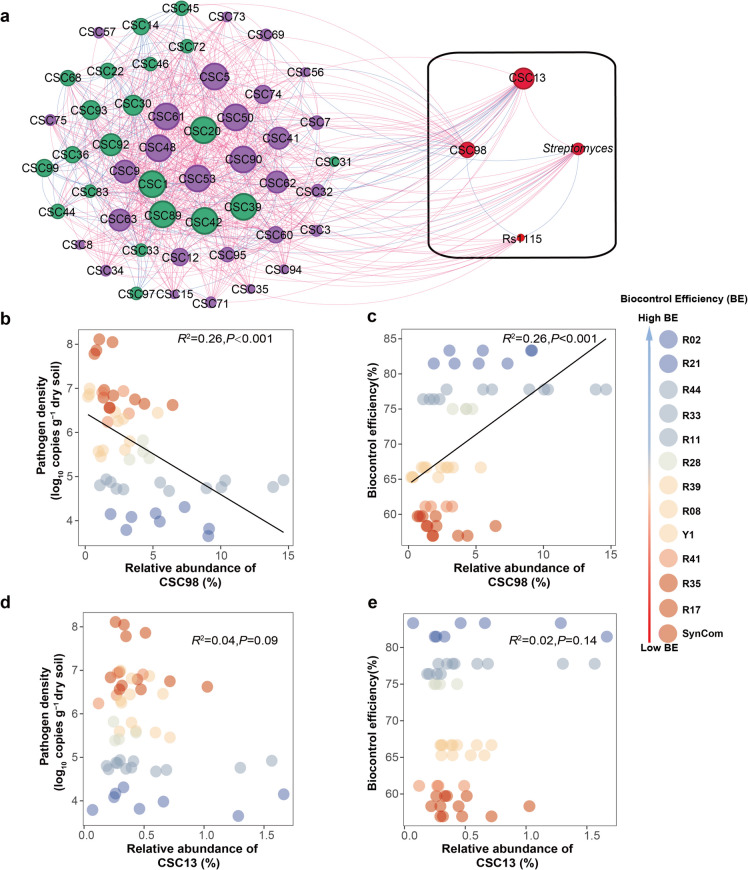
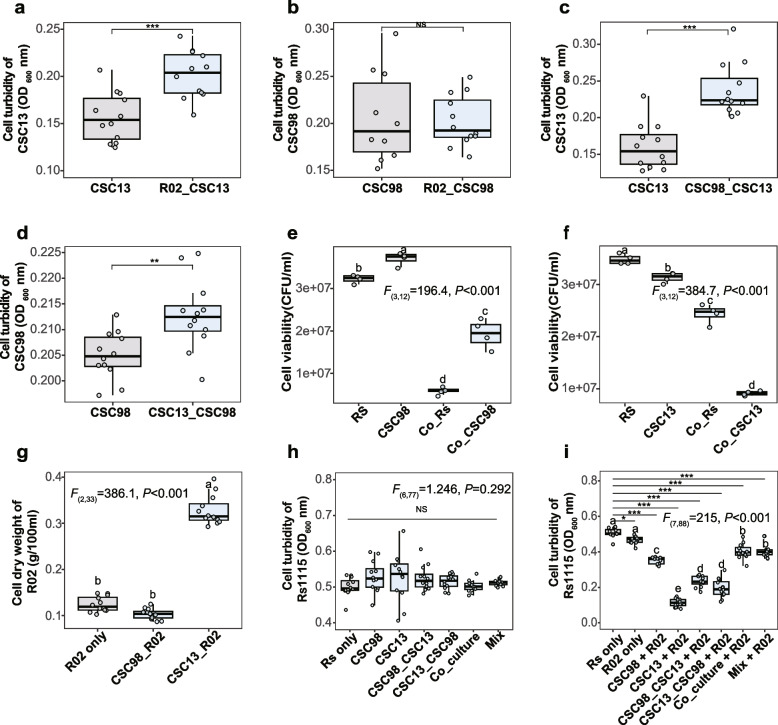
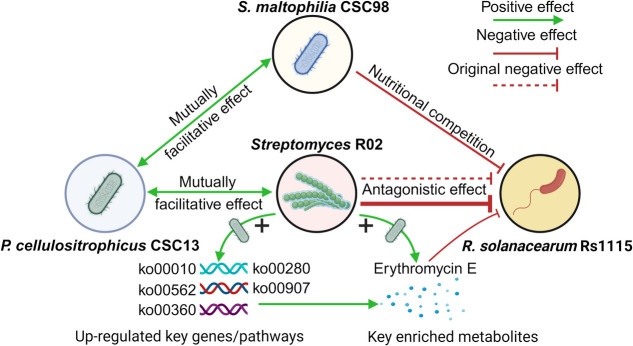
Results: Our findings indicate that direct antagonism by Streptomyces is not sufficient for their biocontrol efficacy. Instead, the efficacy was associated with shifts in the rhizosphere microbiome, particularly the promotion of two native keystone taxa, CSC98 (Stenotrophomonas maltophilia) and CSC13 (Paenibacillus cellulositrophicus). In vitro co-cultivation experiments revealed that CSC98 and CSC13 did not directly inhibit the pathogen. Instead, the metabolite of CSC13 significantly enhanced the inhibition efficiency of Streptomyces R02, a highly effective biocontrol strain in natural soil. Transcriptomic and metabolomic analyses revealed that CSC13's metabolites induced the production of Erythromycin E in Streptomyces R02, a key compound that directly suppressed R. solanacearum, as demonstrated by our antagonism tests.

Conclusions: Collectively, our study reveals how beneficial microbes engage with the native soil microbiome to combat pathogens, suggesting the potential of leveraging microbial interactions to enhance biocontrol efficiency. These findings highlight the significance of intricate microbial interactions within the microbiome in regulating plant diseases and provide a theoretical foundation for devising efficacious biocontrol strategies in sustainable agriculture. Video Abstract.

Keywords: Paenibacillus; Stenotrophomonas; Streptomyces; Microbial interaction; Multi-omics analysis; Synthetic community; Tomato bacterial wilt.


Conflict of interest statement

Declarations. Ethics approval and consent to participate: Not applicable. Consent for publication: Not applicable. Competing interests: The authors declare no competing interests.

Figures

Fig. 1
Fig. 1
Antagonistic effect of Streptomyces against the pathogen and impact of rhizosphere microbes on biocontrol efficiency. a Correlation analysis between the direct pathogen inhibition capacity of 50 Streptomyces isolates (as indicated by the average diameter of the inhibition zone) and their biocontrol effectiveness in natural soil. b Comparison of biocontrol efficiency between individual applications of Streptomyces and its use within a synthetic community (SynCom); the shaded area highlights the biocontrol efficiency attributable to SynCom alone (biocontrol efficiency of SynCom = 59.72%). c Box plots depicting the pathogen density in each treatment (RXX/Y1: various Streptomyces combinations with SynCom against Rs1115; SynCom: inoculated only with the synthetic community). The shaded area shows the pathogen density in the control treatment (CK) where Rs1115 was present alone (pathogen density in CK = 7.9 × 108 log10 copies g−1 dry soil). d Correlation analysis of direct pathogen inhibition and biocontrol efficiency for twelve Streptomyces isolates in combination with SynCom. e Significant correlation observed between Streptomyces relative abundance and pathogen density in a greenhouse experiment involving Streptomyces combined with SynCom. f Correlation analysis between the relative abundance of Streptomyces and its biocontrol effectiveness in the same experiment. The different colors of the nodes (from red to blue) represent low to high biocontrol efficiency for each treatment. Linear regression was fitted using the lm function
Fig. 2
Fig. 2
Impact of Streptomyces on community diversity in greenhouse experiments. a Principal coordinate analysis (PCoA) with Bray-Curtis dissimilarity showing the community structure when combining Streptomyces with SynCom. Significant differences in microbiome community structures were observed among various Streptomyces treatments, with the structure of the bacterial community distinctly separated along the PCoA2 axis. The PCoA1 and PCoA2 values for each isolate were extracted to demonstrate changes in microbiome structure under different Streptomyces spp. treatments based on biocontrol efficiency, with each point colored according to biocontrol efficiency. b Relationship between PCoA2 and pathogen density, with the black line representing the linear regressions and 95% confidence intervals (n = 52, P = 0.004). c Correlation analysis between PCoA2 and biocontrol efficiency, illustrated by linear regressions with 95% confidence intervals (n = 52, P = 0.004). d UpSet plots showing all significantly enriched bacterial species in SynCom; CSC98 (Stenotrophomonas sp.) was particularly prevalent in treatments with high biocontrol efficiency (blue). All linear regressions were performed using the lm function
Fig. 3
Fig. 3
An integrated analysis of microbial community interactions between Streptomyces and SynCom, highlighting their impact on biocontrol efficiency. a Co-occurrence network analysis for rhizosphere samples from 12 Streptomyces strains and SynCom, showing specific interactions, particularly between CSC13, Streptomyces, and CSC98. The node of Streptomyces represents 12 strains of Streptomyces. Nodes are color-coded by module (green and purple) and sized by their network degree (target members in red). Red edges denote synergistic interactions, while blue edges indicate antagonistic effects. b Correlation analysis between the relative abundance of CSC98 and pathogen density, with a black line showing linear regression and 95% confidence intervals (n = 52, P < 0.001). c Analysis of the correlation between the relative abundance of CSC98 and biocontrol efficiency, with regression lines as described (n = 52, P < 0.001). d Correlation analysis between the relative abundance of CSC13 and pathogen density. e Analysis of the correlation between the relative abundance of CSC13 and biocontrol efficiency. Each point was color-coded to indicate pathogen suppression efficiency. The different colors of the nodes (from red to blue) represent low to high biocontrol efficiency (BE) for each treatment. All regressions were fitted using the lm function
Fig. 4
Fig. 4
Quantitative analyses of microbial growth characteristics and interactions for Streptomyces R02, pathogen Rs1115, and strains CSC98 and CSC13. a Box plots comparing the impact of Streptomyces R02 supernatant on strain CSC13’s growth. b Box plots showing the influence of Streptomyces R02 supernatant on strain CSC98’s growth. c Box plots illustrating the effect of CSC98 supernatant on CSC13’s growth. d Impact of CSC13 supernatant on CSC98’s growth. e Co-culture of strain CSC98 with Rs1115. f Co-culture of strain CSC13 with Rs1115. g Effects of supernatants from strains CSC98 and CSC13 on the growth of Streptomyces R02. h Impact of supernatants from various strains and their combinations (excluding Streptomyces R02) on Rs1115 growth. i Effects of single and combined bacterial supernatants on Rs1115’s inhibition by Streptomyces R02 supernatant. Legend: R02_CSCXX indicates strain CSCXX treated with Streptomyces R02 supernatant. CSCXX_R02 indicates the biomass of Streptomyces R02 treated with strain CSCXX’s supernatant. CSCXX represents strain CSCXX alone. CSCAA_CSCBB shows strain CSCBB treated with strain CSCAA supernatant. RS indicates the growth of Rs1115 alone. Co_RS (e) and Co_RS (f) refer to Rs1115 in co-culture systems with strains CSC98 and CSC13, respectively. Co_CSCXX indicates strain CSCXX in co-culture with Rs1115. R02 only (g) represents the biomass of Streptomyces R02 alone. Rs only (h, i) represents OD600 nm of Rs1115 alone. R02 only (i) represents OD600 nm of Rs1115 treated with strain R02 supernatant. Co_culture (h, i) represents the co-culture of strains CSC13 and CSC98. Mix (h, i) denotes supernatant from mixed strains CSC13 and CSC98 in equal proportions
Fig. 5
Fig. 5
Transcriptomic and metabolomic analysis of Streptomyces R02 under Paenibacillus cellulositrophicus CSC13 treatment (using supernatant metabolites). a Two-dimensional principal coordinate analysis (PCoA) of Bray-Curtis dissimilarity comparing the transcriptome of Streptomyces R02 with the co-culture of Streptomyces R02 and P. cellulositrophicus CSC13’s metabolites (71% of variance explained, P = 0.005, n = 12). b Bubble plot showing significantly enriched key genes from the KEGG enrichment analysis. Major transcriptional changes were observed in genes associated with pathways of (i) valine, leucine, and isoleucine degradation, (ii) glycolysis/gluconeogenesis, (iii) inositol phosphate metabolism, (iv) phenylalanine metabolism, and (v) geraniol degradation and secondary metabolite biosynthesis, which are highlighted in red. c PCoA illustrating significant differences in metabolite compositions between Streptomyces R02 only, P. cellulositrophicus CSC13 only, and co-culture of Streptomyces R02 and P. cellulositrophicus CSC13’s metabolites (CSC13 + R02) (62% of variance explained, P = 0.001, n = 18). d Bubble plot showing enriched metabolites in the R02 + CSC13 treatment group compared with the R02-only control. The pathway containing the key metabolite, Erythromycin E, is highlighted in red (Lactones). e Mantel test demonstrating significant correlations between the metabolite Erythromycin E and key genes, and the inset graph showed the structure and abundance of Erythromycin E under different conditions
Fig. 6
Fig. 6
The inhibition effect of Erythromycin E against Rs1115. a Images of agar diffusion assays showing the inhibition zones of Rs1115 in response to different concentrations of Erythromycin E. The compound was applied in a gradient from 0.125 to 256 µg/mL, with negative controls CK (nutrient broth medium) and CK (dimethyl sulfoxide, DMSO). The mean diameters of inhibition zones (± standard error) are indicated below each corresponding plate. b Images of bacterial growth in liquid NB medium supplemented with different concentrations of Erythromycin E. Optical density (OD600) measurements are provided, showing bacterial turbidity at 24 h post-incubation. c Quantification of inhibition zones from the agar diffusion assay. d Growth inhibition of Rs1115 in liquid culture, as determined by OD600 measurements after 24 h of incubation with different concentrations of Erythromycin E. Statistical significance in these graphs is indicated (***P < 0.001; NS, not significant)
Fig. 7
Fig. 7
The diagram illustrates the enhanced inhibition of Streptomyces R02 on Ralstonia solanacearum Rs1115 through interactions with Stenotrophomonas maltophilia CSC98 and Paenibacillus cellulositrophicus CSC13 in soil. S. maltophilia CSC98 and P. cellulositrophicus CSC13 demonstrated a mutually facilitative relationship, where each species promoted the growth and/or activity of the other. Similarly, P. cellulositrophicus CSC13 and Streptomyces R02 also exhibited mutual facilitation, with both species benefiting from their interaction. Under this facilitation, Streptomyces R02 exhibited stronger inhibition of R. solanacearum Rs1115, compared to when CSC13 was absent. This inhibition was attributed to the CSC13-induced production of bioactive secondary metabolites in Streptomyces R02, Erythromycin E, which we confirmed to directly inhibit R. solanacearum on nutrient agar and in nutrient broth. The induction of Erythromycin E in Streptomyces R02 by CSC13 was associated with the upregulation of key genes across five major genetic pathways. In contrast, S. maltophilia CSC98 and R. solanacearum Rs1115 displayed nutritional competition, resulting in a negative interaction likely due to competition for shared resources and limiting their growth potential. The microbial interaction model reveals the critical role of Streptomyces R02 and its interactions with two bacterial strains in controlling against a major plant pathogen, mediated by upregulations of key genes and a metabolite in the Streptomyces

Similar articles

Cited by

References

    1. Mendes R, Kruijt M, De Bruijn I, Dekkers E, Van Der Voort M, Schneider JH, et al. Deciphering the rhizosphere microbiome for disease-suppressive bacteria. Science. 2011;332(6033):1097–100. 10.1126/science.1203980. - PubMed
    1. Liu H, Brettell LE. Plant defense by VOC-induced microbial priming. Trends Plant Sci. 2019;24(3):187–9. 10.1016/j.tplants.2019.01.008. - PubMed
    1. Vejan P, Abdullah R, Khadiran T, Ismail S, Nasrulhaq BA. Role of plant growth promoting rhizobacteria in agricultural sustainability-a review. Molecules. 2016;21(5): 573. 10.3390/molecules21050573. - PMC - PubMed
    1. Chen XH, Koumoutsi A, Scholz R, Schneider K, Vater J, Süssmuth R, et al. Genome analysis of Bacillus amyloliquefaciens FZB42 reveals its potential for biocontrol of plant pathogens. J Biotechnol. 2009;140(1–2)(-):27–37. 10.1016/j.jbiotec.2008.10.011. - PubMed
    1. Du Y, Wang T, Jiang J, Wang Y, Lv C, Sun K, et al. Biological control and plant growth promotion properties of Streptomyces albidoflavus St-220 isolated from Salvia miltiorrhiza rhizosphere. Front Plant Sci. 2022;13: 976813. 10.3389/fpls.2022.976813. - PMC - PubMed

LinkOut - more resources