. 2025 May 19;13(1):108.
doi: 10.1186/s40478-025-02000-4.

hiPSC-neurons recapitulate the subtype-specific cell intrinsic nature of susceptibility to neurodegenerative disease-relevant aggregation

Affiliations

hiPSC-neurons recapitulate the subtype-specific cell intrinsic nature of susceptibility to neurodegenerative disease-relevant aggregation

Ian Weidling et al. Acta Neuropathol Commun. .

Abstract

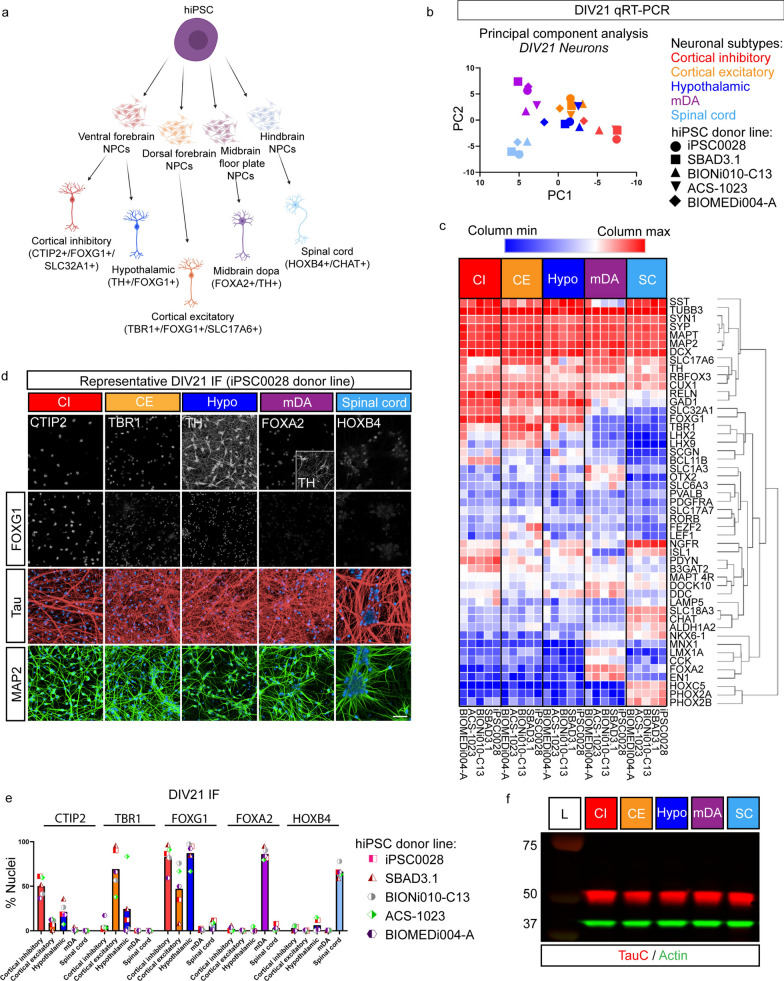
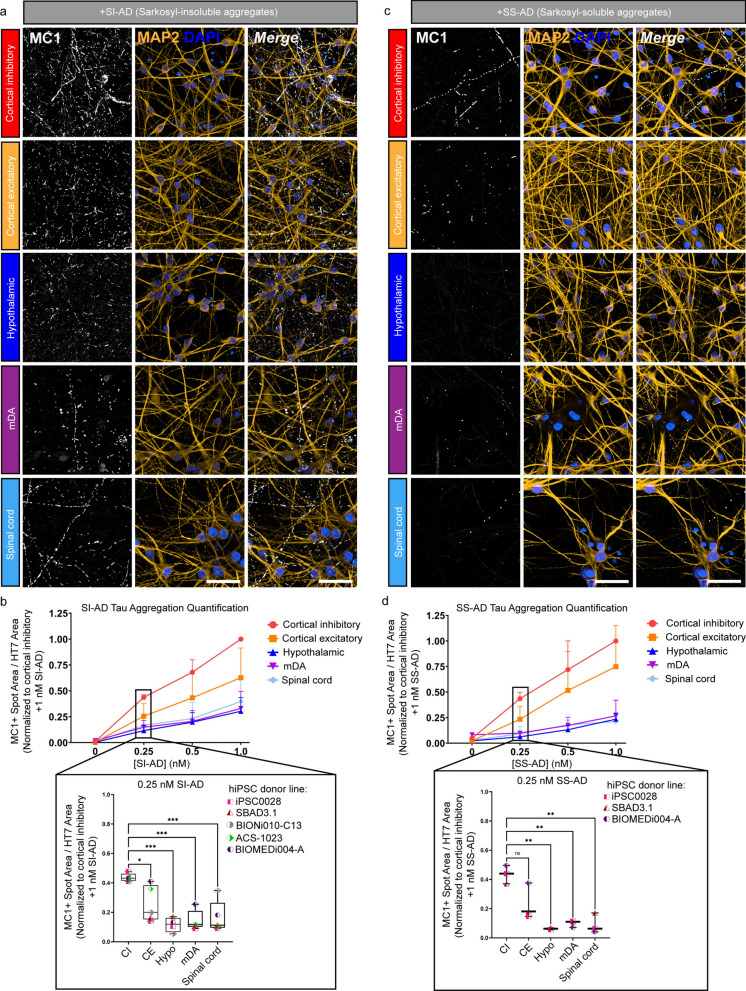
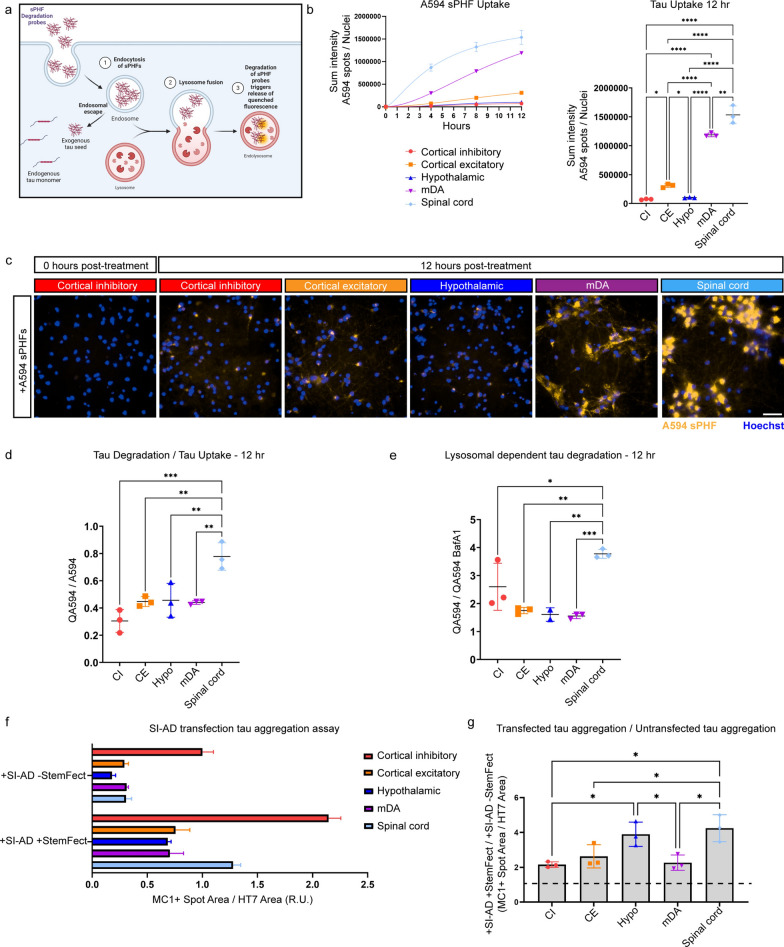
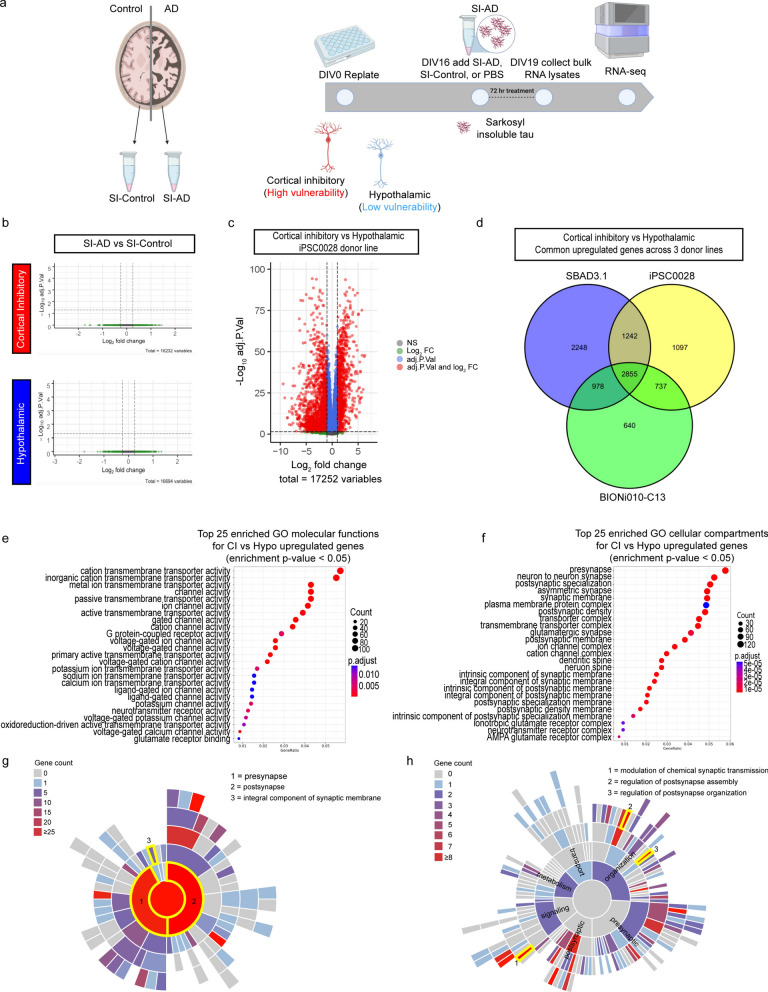
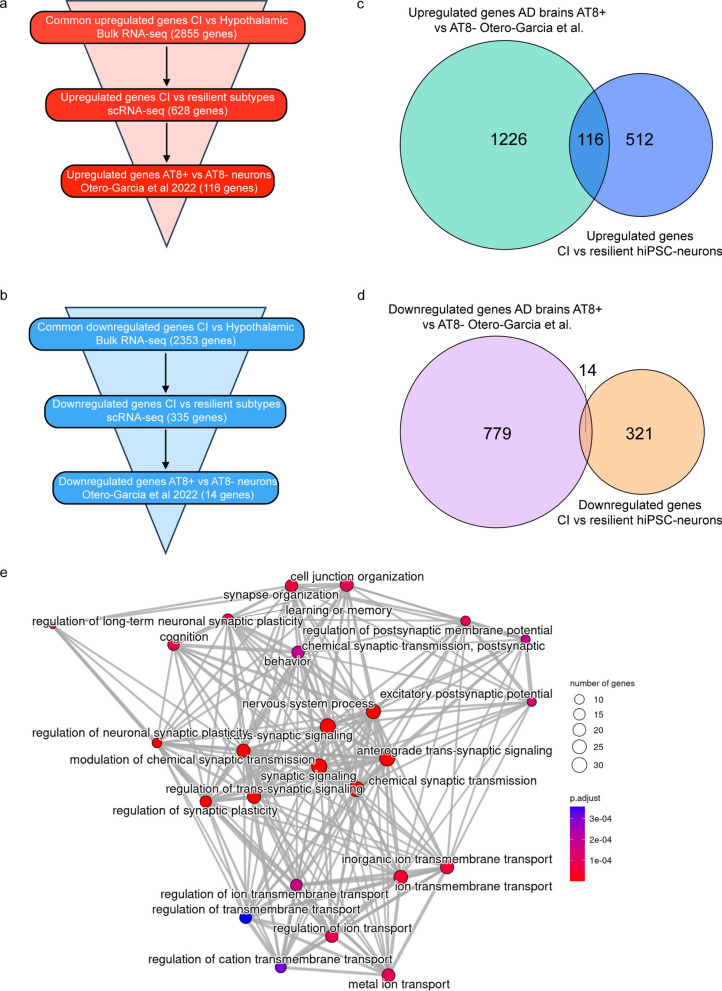
Alzheimer's disease (AD) is characterized by the accumulation and spread of Tau intraneuronal inclusions throughout most of the telencephalon, leaving hindbrain regions like the cerebellum and spinal cord largely spared. These neuropathological observations, along with the identification of specific vulnerable sub-populations from AD brain-derived single nuclei transcriptomics, suggest that a subset of brain regions and neuronal subtypes possess a selective vulnerability to Tau pathology. Given the inability to culture neurons from patient brains, a disease-relevant in vitro model which recapitulates these features would serve as a critical tool to validate modulators of vulnerability and resilience. Using our recently established platform for inducing endogenous Tau aggregation in human induced pluripotent stem cell (hiPSC)-derived cortical excitatory neurons via application of AD brain-derived exogenous Tau aggregates, we explored whether Tau aggregates preferentially induce aggregation in specific neuronal subtypes. We compared Tau seeding in hiPSC-derived neuron subtypes representing regional identities across the forebrain, midbrain, and hindbrain. Higher susceptibility (i.e. more Tau aggregation) was consistently observed among cortical neuron subtypes, with CTIP2-positive, somatostatin (SST)-positive cortical inhibitory neurons showing the greatest aggregation levels across hiPSC lines from multiple donors. hiPSC-neurons also delineated between the disease-specific vulnerabilities of different protein aggregates, as α-synuclein preformed fibrils showed an increased propensity to induce aggregates in midbrain dopaminergic (mDA)-like neurons, mimicking Parkinson's disease (PD)-specific susceptibility. Aggregate uptake and degradation rates were insufficient to explain differential susceptibility. The absence of a consistent transcriptional response following aggregate seeding further indicated that intrinsic neuronal subtype-specific properties could drive susceptibility. The present data provides evidence that hiPSC-neurons exhibit features of selective neuronal vulnerability which manifest in a cell autonomous manner, suggesting that mining intrinsic (or basal) transcriptomic signatures of more vulnerable compared to more resilient hiPSC-neurons could uncover the molecular underpinnings of differential susceptibility to protein aggregation found in a variety of neurodegenerative diseases.

Keywords: Alzheimer’s disease; Parkinson’s disease; Selective vulnerability; Tau; hiPSC-derived neurons.


Conflict of interest statement

Declarations. Ethics approval and consent to participate: Written informed consent for primary tissue procurement and the use of the material and clinical information for research purposes was obtained by the brain banks and the hiPSC providers (commercial sources or consortiums) used in this study. Consent for publication: Not applicable. Competing interests: Funding/Competing interests C.N.P., S.E.C., L.G., G.L., M.S.B., J.L., L.M.R., O.M., K.N.N., N.R.P., Q.L., P.R., R.W., D.E.E., A.S., S.B., C.X., B.S., M.C., N.R., K.Y., A.M.W., J.W., L.G., J.S., X.L., and J.D.M are employees of AbbVie. I.W., G.S. T.J.K, and M.W. were employees at the time of the study. The design, study conduct, and financial support for this research were provided by AbbVie. AbbVie participated in the interpretation of data, review, and approval of the publication.

Figures

Fig. 1
Fig. 1
Establishing hiPSC-derived neuronal models for studying selective vulnerability to Tau pathology. a Schematic depicting hiPSC differentiation to distinct neuronal subtypes along with their identifying marker gene expression. Created with BioRender.com. b PCA of DIV21 96 target gene expression data from 5 hiPSC-neuron subtypes across 5 hiPSC donor lines. The proportion of variance for PC1 is 20.73%, while the proportion of variance for PC2 is 17.04%. c Heat map with hierarchical clustering depicts select marker gene expression at DIV21 in 5 hiPSC-neuron subtypes across 5 hiPSC donor lines. Log10 normalized expression values are scaled per neuronal population to indicate highly expressed genes. CI = cortical inhibitory hiPSC-neurons, CE = cortical excitatory hiPSC-neurons, Hypo = hypothalamic hiPSC-neurons, mDA = midbrain dopaminergic hiPSC-neurons, SC = spinal cord hiPSC-neurons. d Immunofluorescence of DIV21 hiPSC-neurons differentiated to 5 distinct neuronal subtypes. Scale bar = 50 µm. e Quantification of DIV21 hiPSC-neuron percent of nuclei positive for cortical layer (CTIP2, TBR1) and regional identity markers (FOXG1, FOXA2, and HOXB4). F Western blot analysis of total Tau (TauC, red) and actin (green) from DIV16 hiPSC-neurons differentiated to 5 neuronal subtypes. L = ladder, labeled with molecular weight (kDa)
Fig. 2
Fig. 2
Distinct hiPSC-derived neuronal subtypes show differential vulnerability to seeding with AD brain-derived Tau pathology. a Representative DIV44 images from hiPSC-neuronal subtypes seeded with 1 nM SI-AD. MC1 labels Tau aggregates; MAP2 labels dendrites. Scale bar = 50 µm. b Quantification of MC1-positive spot area normalized to soluble Tau (HT7) area at DIV21 in 5 hiPSC-neuron subtypes across 5 donor lines, seeded with range of SI-AD concentrations. Data normalized to cortical inhibitory hiPSC-neurons seeded with 1 nM SI-AD. Data represents the average of 4 or 5 biological replicates + SD (3 technical replicate wells, 30 fields per well). ns = not significant, * = p-value < 0.05, ** = p-value < 0.01, *** = p-value < 0.001, **** = p-value < 0.0001 according to one-way ANOVA with Tukey’s test. c Representative DIV44 images from unseeded hiPSC-neurons (left) or hiPSC-neuronal subtypes seeded with 1 nM SS-AD. MC1 labels tau aggregates; MAP2 labels dendrites. Scale bar = 50 µm. d Quantification of MC1-positive spot area normalized to soluble Tau (HT7) area at DIV21 in 5 hiPSC-neuron subtypes across 3 donor lines, seeded with range of SS-AD concentrations. Data normalized to cortical inhibitory hiPSC-neurons seeded with 1 nM SI-AD. Data represents the average of 2 or 3 biological replicates + SD (3 technical replicate wells, 30 fields per well). ns = not significant, ** = p-value < 0.01 according to one-way ANOVA with Tukey’s test
Fig. 3
Fig. 3
Comparing Tau seed uptake and degradation across distinct hiPSC-neuron subtypes. a Sonicated paired helical filaments (sPHFs, 2 N4R P301L) labeled with Tau uptake probe (A594, not depicted in schematic) or Tau degradation probe (QA594, example shown in schematic) produce a fluorescent signal following hiPSC-neuron uptake (A594 rPHFs) or intracellular degradation (QA594 rPHFs). Adapted from “Cellular Uptake of MIL-89 Nanoparticles into Endocytic Vesicles”, by BioRender.com (2024). b Quantification of Tau uptake normalized to nuclei count over a 12-h timecourse (left) and at the final timepoint (right) in DIV16 hiPSC-neurons treated with 50 nM A594 sPHFs (Tau uptake probe). Data represents the mean + SD (3 technical replicate wells, 12 fields per well). * = p-value < 0.05, ** = p-value < 0.01, **** = p-value < 0.0001 according to one-way ANOVA with Tukey’s test. c Representative live cell images of Tau uptake in DIV16 hiPSC-neurons 12 h post-treatment with 50 nM A594 sPHFs (tau uptake probe). 594 fluorescence represents sPHF uptake, nuclei stained with Hoechst dye. Scale bar = 50 µm. d Ratio of Tau degradation to Tau uptake in DIV16 hiPSC-neurons 12 h post-treatment with 50 nM QA594 sPHFs (Tau degradation probe). Data represents the mean + SD (3 technical replicate wells, 12 fields per well). ** = p-value < 0.01, *** = p-value < 0.001 according to one-way ANOVA with Tukey’s test. e Quantification of Tau degradation normalized to Tau degradation in BafA1 pretreated DIV16 hiPSC-neurons 12 h post-treatment with 50 nM QA594 sPHFs (tau degradation probe). Data represents the mean + SD (3 technical replicate wells, 12 fields per well). * = p-value < 0.05, ** = p-value < 0.01, *** = p-value < 0.001 according to one-way ANOVA with Tukey’s test. f Quantification of MC1-positive spot area normalized to HT7 area in DIV44 hiPSC-neurons seeded with 0.5 nM SI-AD alone or in combination with StemFect. Data represents the mean + SD (3 technical replicate wells, 20 fields per well). g Ratio of transfected Tau aggregation to untransfected Tau aggregation in DIV44 hiPSC-neurons seeded with 0.5 nM SI-AD alone (untransfected) or in combination with StemFect (transfected). Data represents the mean + SD (3 technical replicate wells, 20 fields per well). Dotted line indicates a 1:1 ratio. * = p-value < 0.05 according to one-way ANOVA with Tukey’s test
Fig. 4
Fig. 4
RAB7 A genetic knockdown increases seeded tau aggregation across neuronal subtypes. a UMAP visualization of single cell RNA-seq (scRNA-seq) data generated from DIV14 hiPSC-neurons colored by protocol (top) or by RAB7 A expression (bottom). b Representative DIV44 images from SI-AD seeded hiPSC-neurons pre-treated with non-targeting control (NTC) siRNA or RAB7 A siRNA. MC1 labels tau aggregates; MAP2 labels dendrites. Scale bar = 50 µm. c Quantification of MC1-positive spot area normalized to MAP2 area in hiPSC-neurons seeded with 0.5 nM SI-AD following treatment with non-targeting control (NTC) or either of two individual (non-pooled) RAB7 A siRNA. Data normalized to cortical inhibitory hiPSC-neurons treated with NTC siRNA. Data represents the mean + SD (3 technical replicate wells, 20 fields per well). ns = not significant, * = p-value < 0.05, ** = p-value < 0.01, *** = p-value < 0.001, **** = p-value < 0.0001 according to two-way ANOVA with Tukey’s test
Fig. 5
Fig. 5
Bulk RNA-seq identifies basal transcriptional differences between a vulnerable and resilient neuronal subtype, while revealing no consistent transcriptional changes following SI-AD treatment. a Timeline for bulk RNA-seq experiments examining transcriptional responses to SI-AD treatment in vulnerable (cortical inhibitory) and resilient (hypothalamic) hiPSC-neurons. DIV16 hiPSC-neurons were treated with PBS, SI-control, or SI-AD (0.5 nM) for 72 h prior to lysate collection for bulk RNA-seq. Created with BioRender.com. b Representative volcano plots showing Log(2)FC and -Log(10) adjusted P-values from bulk RNA-seq comparison between SI-AD treated (0.5 nM) and SI-control treated (equal volume) hiPSC-neurons in the iPSC0028 donor line. c Volcano plot of differentially expressed genes in PBS-treated cortical inhibitory and hypothalamic hiPSC-neurons derived from the iPSC0028 donor line. Log2FC threshold > 1 and adj.P.val < 0.05. d Venn diagram showing the number of overlapping upregulated genes between DIV19 PBS-treated cortical inhibitory and hypothalamic hiPSC-neurons across hiPSC donor lines. e Top 25 enriched GO molecular functions for common upregulated genes in DIV19 cortical inhibitory vs hypothalamic hiPSC-neurons across hiPSC donor lines, enrichment p-value < 0.05. Count refers to the number of differentially expressed genes from each GO molecular function. Circle color represents adjusted p-value. f Top 25 enriched GO cellular compartments for common upregulated genes in DIV19 cortical inhibitory vs hypothalamic hiPSC-neurons across hiPSC donor lines, enrichment p-value < 0.05. Count refers to the number of differentially expressed genes from each GO biological process. Circle color represents adjusted p-value. g Sunburst plot of SynGO annotated cellular component synaptic genes which are upregulated in PBS-treated DIV19 cortical inhibitory vs hypothalamic hiPSC-neuron bulk RNA-seq analysis. Plot is colored by gene count per term. Gene categories mentioned in the text are outlined in yellow and labeled. h Sunburst plot of SynGO annotated biological process synaptic genes which are upregulated in PBS-treated DIV19 cortical inhibitory vs hypothalamic hiPSC-neuron bulk RNA-seq analysis. Plot is colored by gene count per term. Gene categories mentioned in the text are outlined in yellow and labeled with numbers
Fig. 6
Fig. 6
Identifying transcriptomic signatures of selective vulnerability to Tau aggregation. a Funneling strategy to identify overlapping upregulated genes between our Tau-vulnerable cortical inhibitory hiPSC-neurons relative to Tau-resilient hypothalamic hiPSC-neurons and AT8-positive vs AT8-negative neurons from Otero-Garcia et al. [64]. The 2855 genes found to be upregulated in DIV19 cortical inhibitory hiPSC-neurons relative to hypothalamic hiPSC-neurons via bulk RNA-seq was narrowed to 628 gene candidates by looking for overlapping, upregulated genes from the single cell RNA-seq analysis of cortical inhibitory hiPSC-neuron gene expression relative to resilient hiPSC-neuron gene expression (hypothalamic, mDA, and spinal cord). The list of 628 genes upregulated in cortical inhibitory hiPSC-neurons relative to resilient hiPSC-neuron subtypes identified via bulk and single cell RNA-seq was then compared to the upregulated genes in AT8-positive human AD neurons from Otero-Garcia et al. (2022). The funneling strategy identified 116 genes for follow-up analyses. b Funneling strategy to identify overlapping downregulated genes between our Tau-vulnerable cortical inhibitory hiPSC-neurons relative to Tau-resilient hypothalamic hiPSC-neurons and AT8-positive vs AT8-negative neurons from Otero-Garcia et al. [64]. The 2353 genes found to be downregulated in DIV19 cortical inhibitory hiPSC-neurons relative to hypothalamic hiPSC-neurons via bulk RNA-seq was narrowed to 335 gene candidates by looking for overlapping, downregulated genes from the single cell RNA-seq analysis of cortical inhibitory hiPSC-neuron gene expression relative to resilient hiPSC-neuron gene expression (hypothalamic, mDA, and spinal cord). The list of 335 genes downregulated in cortical inhibitory hiPSC-neurons relative to resilient hiPSC-neuron subtypes identified via bulk and single cell RNA-seq was then compared to the downregulated genes in AT8 human AD neurons from Otero-Garcia et al. [64]. The funneling strategy identified 14 genes, too few to run follow-up enrichment analyses. c Venn diagram depicting the overlapping upregulated genes from our studies on tau-vulnerable hiPSC-neurons relative to tau-resilient hiPSC-neurons and from AT8-positive vs AT8-negative neurons from Otero-Garcia et al. [64] d Venn diagram depicting the overlapping downregulated genes from our studies on tau-vulnerable hiPSC-neurons relative to tau-resilient hiPSC-neurons and from AT8-positive vs AT8-negative neurons from Otero-Garcia et al. [64]. e Pathway enrichment analysis visualization for top 25 enriched GO terms for the 116 genes identified as upregulated in both vulnerable hiPSC-neurons relative to resilient hiPSC-neurons and in AT8-positive vs AT8-negative human AD neurons, enrichment p-value < 0.05. Lines between pathways represent overlapping genes between pathways. Number of genes refers to the number of differentially expressed genes from each GO term. Circle color represents adjusted p-value

Similar articles

References

    1. Aleksander SA, Balhoff J, Carbon S, Cherry JM, Drabkin HJ, Ebert D, Feuermann M, Gaudet P, Harris NL, Hill DP, Lee R, Mi H, Moxon S, Mungall CJ, Muruganugan A, Mushayahama T, Sternberg PW, Thomas PD, Auken KV, Ramsey J, Siegele DA, Chisholm RL, Fey P, Aspromonte MC, Nugnes MV, Quaglia F, Tosatto S, Giglio M, Nadendla S, Antonazzo G, Attrill H, dos Santos G, Marygold S, Strelets V, Tabone CJ, Thurmond J, Zhou P, Ahmed SH, Asanitthong P, Buitrago DL, Erdol MN, Gage MC, Kadhum MA, Li KYC, Long M, Michalak A, Pesala A, Pritazahra A, Saverimuttu SCC, Su R, Thurlow KE, Lovering RC, Logie C, Oliferenko S, Blake J, Christie K, Corbani L, Dolan ME, Drabkin HJ, Hill DP, Ni L, Sitnikov D, Smith C, Cuzick A, Seager J, Cooper L, Elser J, Jaiswal P, Gupta P, Jaiswal P, Naithani S, Lera-Ramirez M, Rutherford K, Wood V, Pons JLD, Dwinell MR, Hayman GT, Kaldunski ML, Kwitek AE, Laulederkind SJF, Tutaj MA, Vedi M, Wang S-J, D’Eustachio P, Aimo L, Axelsen K, Bridge A, Hyka-Nouspikel N, Morgat A, Aleksander SA, Cherry JM, Engel SR, Karra K, Miyasato SR, Nash RS, Skrzypek MS, Weng S, Wong ED, Bakker E, Berardini TZ, Reiser L, Auchincloss A, Axelsen K, Argoud-Puy G, Blatter M-C, Boutet E, Breuza L, Bridge A, Casals-Casas C, Coudert E, Estreicher A, Famiglietti ML, Feuermann M, Gos A, Gruaz-Gumowski N, Hulo C, Hyka-Nouspikel N, Jungo F, Mercier PL, Lieberherr D, Masson P, Morgat A, Pedruzzi I, Pourcel L, Poux S, Rivoire C, Sundaram S, Bateman A, Bowler-Barnett E, Bye-A-Jee H, Denny P, Ignatchenko A, Ishtiaq R, Lock A, Lussi Y, Magrane M, Martin MJ, Orchard S, Raposo P, Speretta E, Tyagi N, Warner K, Zaru R, Diehl AD, Lee R, Chan J, Diamantakis S, Raciti D, Zarowiecki M, Fisher M, James-Zorn C, Ponferrada V, Zorn A, Ramachandran S, Ruzicka L, Westerfield M, Aleksander SA, Balhoff J, Carbon S, Cherry JM, Drabkin HJ, Ebert D, Feuermann M, Gaudet P, Harris NL, Hill DP, Lee R, Mi H, Moxon S, Mungall CJ, Muruganugan A, Mushayahama T, Sternberg PW, Thomas PD, Auken KV, Ramsey J, Siegele DA, Chisholm RL, Fey P, Aspromonte MC, Nugnes MV, Quaglia F, Tosatto S, Giglio M, Nadendla S, Antonazzo G, Attrill H, dos Santos G, Marygold S, Strelets V, Tabone CJ, Thurmond J, Zhou P, Ahmed SH, Asanitthong P, Buitrago DL, Erdol MN, Gage MC, Kadhum MA, Li KYC, Long M, Michalak A, Pesala A, Pritazahra A, Saverimuttu SCC, Su R, Thurlow KE, Lovering RC, Logie C, Oliferenko S, Blake J, Christie K, Corbani L, Dolan ME, Drabkin HJ, Hill DP, Ni L, Sitnikov D, Smith C, Cuzick A, Seager J, Cooper L, Elser J, Jaiswal P, Gupta P, Jaiswal P, Naithani S, Lera-Ramirez M, Rutherford K, Wood V, Pons JLD, Dwinell MR, Hayman GT, Kaldunski ML, Kwitek AE, Laulederkind SJF, Tutaj MA, Vedi M, Wang S-J, D’Eustachio P, Aimo L, Axelsen K, Bridge A, Hyka-Nouspikel N, Morgat A, Aleksander SA, Cherry JM, Engel SR, Karra K, Miyasato SR, Nash RS, Skrzypek MS, Weng S, Wong ED, Bakker E, Berardini TZ, Reiser L, Auchincloss A, Axelsen K, Argoud-Puy G, Blatter M-C, Boutet E, Breuza L, Bridge A, Casals-Casas C, Coudert E, Estreicher A, Famiglietti ML, Feuermann M, Gos A, Gruaz-Gumowski N, Hulo C, Hyka-Nouspikel N, Jungo F, Mercier PL, Lieberherr D, Masson P, Morgat A, Pedruzzi I, Pourcel L, Poux S, Rivoire C, Sundaram S, Bateman A, Bowler-Barnett E, Bye-A-Jee H, Denny P, Ignatchenko A, Ishtiaq R, Lock A, Lussi Y, Magrane M, Martin MJ, Orchard S, Raposo P, Speretta E, Tyagi N, Warner K, Zaru R, Diehl AD, Lee R, Chan J, Diamantakis S, Raciti D, Zarowiecki M, Fisher M, James-Zorn C, Ponferrada V, Zorn A, Ramachandran S, Ruzicka L, Westerfield M (2023) The Gene ontology knowledgebase in 2023. Genetics 224:iyad031. 10.1093/genetics/iyad031 - PMC - PubMed
    1. Ashburner M, Ball CA, Blake JA, Botstein D, Butler H, Cherry JM, Davis AP, Dolinski K, Dwight SS, Eppig JT, Harris MA, Hill DP, Issel-Tarver L, Kasarskis A, Lewis S, Matese JC, Richardson JE, Ringwald M, Rubin GM, Sherlock G (2000) Gene Ontology: tool for the unification of biology. Nat Genet 25:25–29. 10.1038/75556 - PMC - PubMed
    1. Barini E, Plotzky G, Mordashova Y, Hoppe J, Rodriguez-Correa E, Julier S, LePrieult F, Mairhofer I, Mezler M, Biesinger S, Cik M, Meinhardt MW, Ercan-Herbst E, Ehrnhoefer DE, Striebinger A, Bodie K, Klein C, Gasparini L, Schlegel K (2022) Tau in the brain interstitial fluid is fragmented and seeding–competent. Neurobiol Aging 109:64–77. 10.1016/j.neurobiolaging.2021.09.013 - PubMed
    1. Bichmann M, Oriol NP, Ercan-Herbst E, Schöndorf DC, Ramos BG, Schwärzler V, Neu M, Schlüter A, Wang X, Jin L, Hu C, Tian Y, Ried JS, Haberkant P, Gasparini L, Ehrnhoefer DE (2021) SETD7-mediated monomethylation is enriched on soluble Tau in Alzheimer’s disease. Mol Neurodegener 16:46. 10.1186/s13024-021-00468-x - PMC - PubMed
    1. Blum H, Beier H, Gross HJ (1987) Improved silver staining of plant proteins, RNA and DNA in polyacrylamide gels. Electrophoresis 8:93–99. 10.1002/elps.1150080203

Publication types

MeSH terms

LinkOut - more resources