. 2025 May 19;13(1):22.
doi: 10.1186/s40170-025-00392-4.

Lactate dehydrogenase A-coupled NAD+ regeneration is critical for acute myeloid leukemia cell survival

Affiliations

Lactate dehydrogenase A-coupled NAD+ regeneration is critical for acute myeloid leukemia cell survival

Ayşegül Erdem et al. Cancer Metab. .

Abstract

Background: Enhanced glycolysis plays a pivotal role in fueling the aberrant proliferation, survival and therapy resistance of acute myeloid leukemia (AML) cells. Here, we aimed to elucidate the extent of glycolysis dependence in AML by focusing on the role of lactate dehydrogenase A (LDHA), a key glycolytic enzyme converting pyruvate to lactate coupled with the recycling of NAD+.

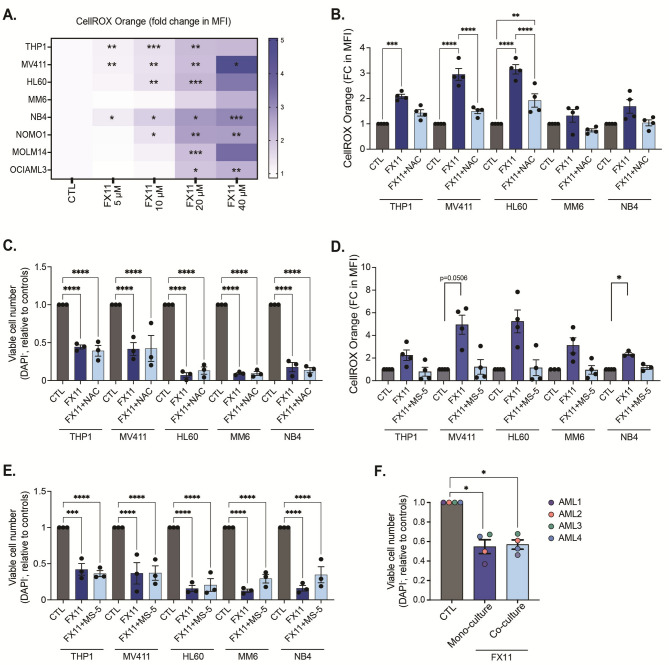
Methods: We compared the glycolytic activity of primary AML patient samples to protein levels of metabolic enzymes involved in central carbon metabolism including glycolysis, glutaminolysis and the tricarboxylic acid cycle. To evaluate the therapeutic potential of targeting glycolysis in AML, we treated AML primary patient samples and cell lines with pharmacological inhibitors of LDHA and monitored cell viability. Glycolytic activity and mitochondrial oxygen consumption were analyzed in AML patient samples and cell lines post-LDHA inhibition. Perturbations in global metabolite levels and redox balance upon LDHA inhibition in AML cells were determined by mass spectrometry, and ROS levels were measured by flow cytometry.

Results: Among metabolic enzymes, we found that LDHA protein levels had the strongest positive correlation with glycolysis in AML patient cells. Blocking LDHA activity resulted in a strong growth inhibition and cell death induction in AML cell lines and primary patient samples, while healthy hematopoietic stem and progenitor cells remained unaffected. Investigation of the underlying mechanisms showed that LDHA inhibition reduces glycolytic activity, lowers levels of glycolytic intermediates, decreases the cellular NAD+ pool, boosts OXPHOS activity and increases ROS levels. This increase in ROS levels was however not linked to the observed AML cell death. Instead, we found that LDHA is essential to maintain a correct NAD+/NADH ratio in AML cells. Continuous intracellular NAD+ supplementation via overexpression of water-forming NADH oxidase from Lactobacillus brevis in AML cells effectively increased viable cell counts and prevented cell death upon LDHA inhibition.

Conclusions: Collectively, our results demonstrate that AML cells critically depend on LDHA to maintain an adequate NAD+/NADH balance in support of their abnormal glycolytic activity and biosynthetic demands, which cannot be compensated for by other cellular NAD+ recycling systems. These findings also highlight LDHA inhibition as a promising metabolic strategy to eradicate leukemic cells.

Keywords: Acute myeloid leukemia; Cancer metabolism; Glycolysis; Lactate dehydrogenase A; NAD+; Redox balance.


Conflict of interest statement

Declarations. Competing interests: The authors declare no competing interests.

Figures

Fig. 1
Fig. 1
Human AML cells are sensitive to LDHA inhibition. A. Pearson correlation of protein levels of central carbon metabolism enzymes involved in glycolysis, the TCA cycle and glutaminolysis of primary AML patient blasts (n = 13) versus their glycolytic activity as measured by the extracellular acidification rate (ECAR) (data retrieved from Erdem et al. [10]). B. Correlation of LDHA protein expression compared to ECAR activity of CD34+ AML primary samples (n = 13). C. Heatmap showing fold change in number of viable (DAPI) AML cells (n = 5 cell lines, n = 3 AML primary patient samples) 24 h after treatment with FX11 (20 µM), AZD3965 (4 µM) or Compound 3k (5 µM). D-E. Number of viable (DAPI) cells relative to the controls in AML cells following 20 µM FX11 (D) or 20 µM GSK2837808A (E) treatment for 24 h. Each dot represents a biological replicate measured in technical triplicate. F-G. Percentage dead (Annexin V+DAPI+) AML cells upon 20 µM FX11 (F) or 20 µM GSK2837808A (G) treatment for 24 h. Each dot represents a biological replicate measured in technical triplicate. H. Number of viable (DAPI) cells relative to controls in AML primary patient samples following 20 µM FX11 or 20 µM GSK2837808A treatment for 48 h. Each dot represents a technical replicate. I-J. Number of viable (DAPI) cells relative to controls (I) and percentage dead (Annexin V+DAPI+) (J) healthy cord blood-derived CD34+ cells following 20 µM FX11 or 20 µM GSK2837808A treatment for 48 h. Each dot represents a biological replicate measured in technical triplicate. B: linear regression analysis; D,E,F,G,I,J: one-way ANOVA; H: two-way ANOVA for multiple comparisons. All experiments: lines and error bars represent mean ± SEM. *p < 0.05; **p < 0.01; ***p < 0.001; ****p < 0.0001; ns, not significant
Fig. 2
Fig. 2
Inhibiting LDHA decreases glycolytic activity while promoting oxidative phosphorylation in AML cells. A-B. Real-time extracellular acidification rate (ECAR) of AML cell lines NB4 (A) and HL60 (B) (mean ± SEM of biological triplicates) measured by Seahorse bioassay after sequential injections of either of the two LDHA inhibitors (20 µM of FX11, 10 µM of GSK2837808A), glucose, oligomycin and 2-DG. C-F. Bar graphs showing glycolytic capacity (C: FX11, D: GSK2837808A) and maximal oxygen consumption rate (OCR; E: FX11, F: GSK2837808A) of NB4 and HL60 AML cells. G-H. ECAR (G) and maximal OCR (H) of AML primary patient samples (n = 3, each dot represents a technical replicate) after treatment with 10 µM GSK2837808A. G,H: Student’s t-test; C,D,E,F: one-way ANOVA; A,B: two-way ANOVA for multiple comparisons. All experiments: bars and error bars represent mean ± SEM. *p < 0.05; **p < 0.01; ***p < 0.001; ns, not significant
Fig. 3
Fig. 3
Increased ROS levels do not contribute to AML cell death following LDHA inhibition. A. Heatmap showing the fold change of CellROX Orange mean fluorescent intensity in AML cell lines exposed to increasing concentrations of FX11 for 24 h, compared to DMSO treated controls. Data show mean of biological triplicates. B. Fold change (FC) of CellROX Orange mean fluorescent intensity (MFI) in AML cell lines exposed to 20 µM FX11 in the presence and absence of NAC (N-acetyl-L-cysteine, 2 mM) for 24 h. Each dot represents a biological replicate measured in technical triplicate. C. Number of viable (DAPI) cells relative to controls in AML cell lines (each dot represents a biological replicate) following 20 µM FX11 treatment in the presence and absence of 2 mM NAC for 24 h. D. Fold change of CellROX Orange mean fluorescent intensity in AML cell lines exposed to 20 µM FX11 in the presence (co-culture) and absence (mono-culture) of MS-5 cells for 24 h. Each dot represents a biological replicate measured in technical triplicate. E. Number of viable (DAPI) cells relative to controls in AML cell lines (each dot represents a biological replicate) following 20 µM FX11 treatment in the presence and absence of MS-5 cells for 24 h. F. Number of viable (DAPI) cells relative to controls in primary AML patient samples following 20 µM FX11 treatment in the presence (co-culture) and absence (mono-culture) of MS-5 cells for 48 h. Each dot represents a distinct AML sample, as mean of biological triplicates. F: one-way ANOVA; A-E: two-way ANOVA for multiple comparisons. All experiments: bars and error bars represent mean ± SEM. *p < 0.05; **p < 0.01; ***p < 0.001; ****p < 0.0001
Fig. 4
Fig. 4
LDHA inhibition induces global metabolic changes. A. Heatmap showing metabolomics results of AML cells (n = 3) after 24 h of treatment with 20 µM FX11. Data show mean of technical triplicates as fold change compared to vehicle-treated groups. B-C. Glycolysis-related metabolites (B) and intracellular lactate abundance (C) in NB4 cells after 15 min and 24 h of treatment with 20 µM FX11, as measured by LC-MS (each dot represents a biological replicate). D. Western blot for p-AMPK and AMPK in AML cells lines grown for 24 h in the presence or absence of 20 µM FX11. β-actin was used as loading control. Image shown is a representative of three independent replicates. E. NAD+/NADH ratio in NB4 AML cells after 15 min and 24 h of treatment with 20 µM FX11, as measured by LC-MS (each dot represents a biological replicate). F. Relative abundance of redox homeostasis related metabolites in NB4 cells after 15 min and 24 h of treatment with 20 µM FX11, as measured by LC-MS (each dot represents a biological replicate). B,C,E,F: one-way ANOVA. All experiments: bars and error bars represent mean ± SEM. *p < 0.05; **p < 0.01; ***p < 0.001
Fig. 5
Fig. 5
LDHA critically regulates the intracellular NAD+/NADH ratio in AML cells. A. Intracellular NAD+ abundance in AML cell lines after 24 h of treatment with 20 µM FX11, as measured by LC-MS (n = 4 technical replicates). B. Green (sensitive to NADH)-to-red (insensitive to NADH) fluorescence ratio in Peredox-mCherry-expressing NB4 cells treated for 15 min with either FX11 or GSK2837808A. Each dot represents a biological replicate. C-D. Cellular NAD+ levels in NB4 control cells, NB4 cells transduced with an empty vector (EV) and NB4 cells overexpressing a mitochondrial or cytosolic variant of LbNOX, treated with vehicle or 20 µM GSK2837808A (C) or 20 µM FX11 (D) for 24 h, as measured by enzymatic assay. E-F. Percentage dead (Annexin V+DAPI+) NB4 control cells, NB4 cells transduced with an EV and NB4 cells overexpressing a mitochondrial or cytosolic variant of LbNOX, treated with vehicle or 20 µM GSK2837808A (E) or 20 µM FX11 (F) for 24 h. G-H. Percentage live (Annexin VDAPI) NB4 control cells, NB4 cells transduced with an EV and NB4 cells overexpressing a mitochondrial or cytosolic variant of LbNOX, treated with increasing doses of GSK2837808A (G) or FX11 (H) for 18 h. I. Graphical abstract depicting the metabolic role of LDHA in AML cells (upper panel) and consequences of LDHA inhibition (lower panel). FAs = fatty acids, G-6-P = Glucose 6-phosphate, F-6-P = Fructose 6-phosphate, F-1,6-BP = Fructose 1,6-bisphosphate. A-F: one-way ANOVA; G,H: two-way ANOVA for multiple comparisons. All experiments: bars and error bars represent mean ± SEM. *p < 0.05; **p < 0.01; ***p < 0.001; ns, not significant

Update of

Similar articles

Cited by

References

    1. Ley TJ, et al. Genomic and epigenomic landscapes of adult de Novo acute myeloid leukemia. N Engl J Med. 2013;368(22):2059–74. - PMC - PubMed
    1. Miller CA, Wilson RK, Ley TJ. Genomic landscapes and clonality of de Novo AML. N Engl J Med. 2013;369(15):1473. - PMC - PubMed
    1. Warburg O. Über Den Stoffwechsel der carcinomzelle. Naturwissenschaften. 1924;12:1131–7.
    1. Mishra SK, Millman SE, Zhang L. Metabolism in acute myeloid leukemia: mechanistic insights and therapeutic targets. Blood. 2023;141(10):1119–35. - PMC - PubMed
    1. Jones CL, et al. Inhibition of amino acid metabolism selectively targets human leukemia stem cells. Cancer Cell. 2018;34(5):724–e7404. - PMC - PubMed

LinkOut - more resources